INTRODUCTION.
Bichi strategy is a strategy consisting of two indicators, namely: Bollinger bands and ichemoku clouds. The strategy relies on the signal provided by these two indicators to determine trend of an asset, strength of the trend, trend reversal and entry and exit points in the market.
Brief Overview Of Bollinger Bands.
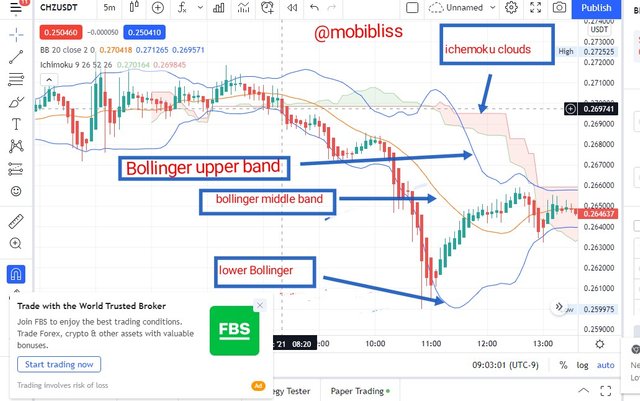
Bollinger bands has three basic components - the upper band, the middle band and the lower band.
When the price chart rallies around or breaks the upper bands, it is considered overbought and there are high probability of reversal to the bearish. A trader here will be looking for opportunity to enter a sell trade.
When the price chart rallies around or breaks the lower band, there are high probability of a bullish reversal. A trader at this point should be ready to trade buy.
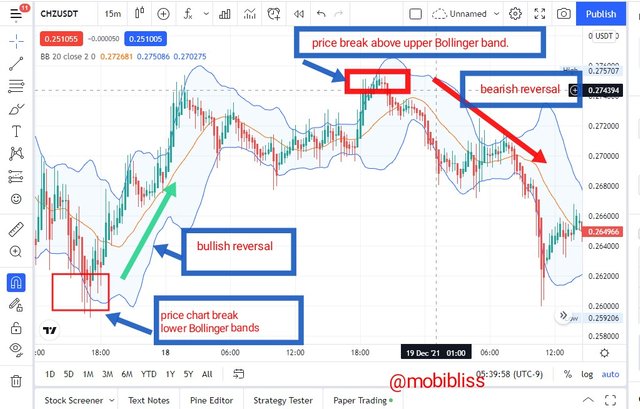
In chzusdt chart above, we can observe that price chart changed direction after a breakout at lower Bollinger band. At the upper band too, the marked area shows a breakout and a downward movement followed afterward. In the charts, We have an uptrend after the price chart touch the lower band and reverse upward. We have a downtrend after the price chart touch the upper band and reverse downward.
- Already, the upper Bollinger bands establishes a resistance line while the lower band the support. Sometimes, depending on the price movement, price bounces back when it touches the middle bollinger to either side and therefore can serve as either support or resistance lines.
Brief Overview Of Ichemoku Clouds.
Ichemoku Clouds comprises of many components that gave it it's versatile yet unique approach when analyzing charts. However, the most prominent of the components and the one relevant to our topic is the "Kumo" or the clouds. The indicator is useful in determining trend, strength of the trend, trend reversal and giving out buy and sell signals.
The better way to understand the clouds of the ichemoku is to see it as resistance and support lines.
When the price chart moves above the cloud of the ichemoku from below, it indicates an uptrend. A trader will be looking forward for opportunity to enter a buy trade. When the price chart continues above the cloud, the longer it stays tells the strength of the trend.
Meanwhile, when the price chart moves below the cloud from above, it indicates a downward trend. A trader here will be alert to trade "sell".
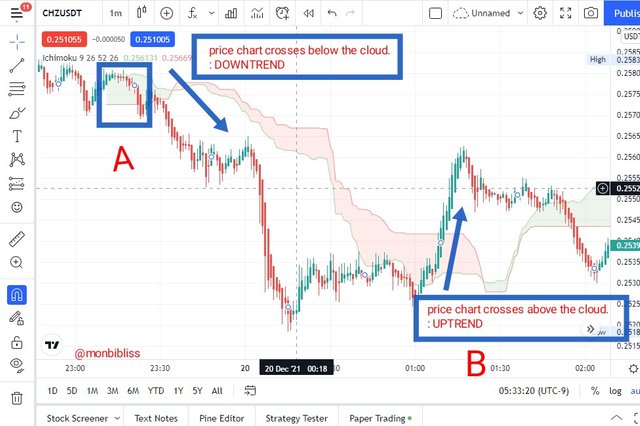
In the image above, I have adjusted some settings to enable us use only the cloud. As we can observe, when the the price chart move below the cloud in point A, we had a downtrend. At point B, the price chart move above the price chart and we had an uptrend.
HOW TO ADD UP THIS STRATEGY TO A CHART AND SETTINGS.
Here, I am using tradingview.com.
Goto the indicator area and add up the two indicators - Bollinger bands and ichemoku clouds.
See image below.
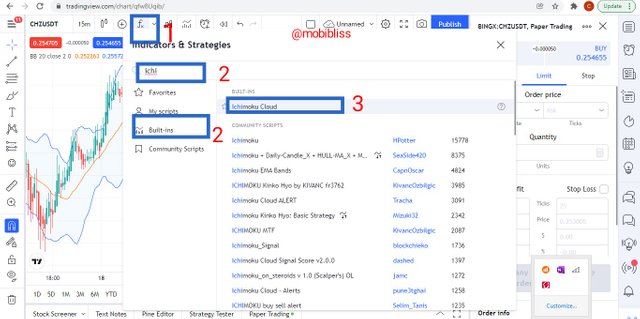
Here, we have added the ichemoku clouds, we should do same with the bollinger bands.
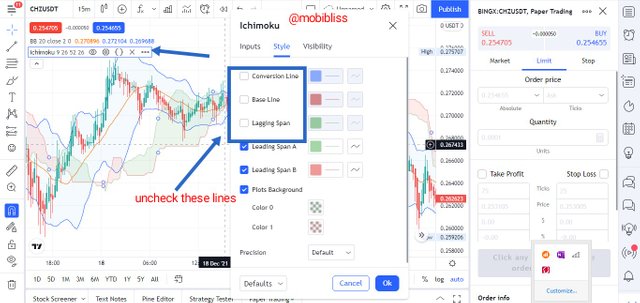
Now we goto the settings of the ichemoku indicator, goto "styles", we will uncheck the conversion line, based line and lagging line. leave the rest at default. The purpose is to enable us use only the cloud.
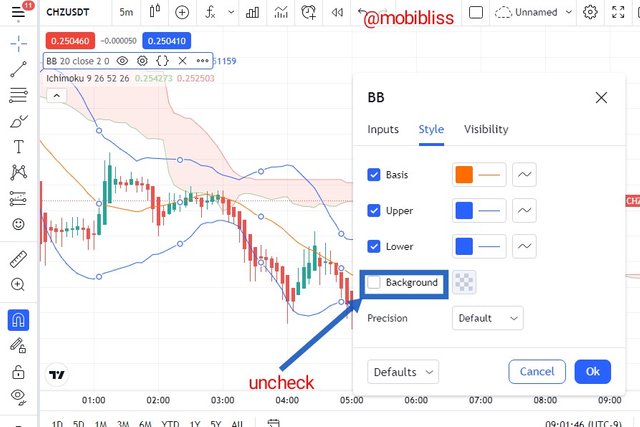
Secondly, we goto the bollinger bands indicator, also goto "styles", uncheck the background. This will remove the shades of the Bollinger.
Our strategy setup should appear as shown below.
BICHI STRATEGY.
Now that we have gotten an overview of both the bollinger band and the ichemoku clouds, it is now ripe to form our Bichi strategy. As I earlier mentioned, the strategy involves the two indicators mentioned above. We are to combine it's signals and reading to form the Bichi strategy. With this strategy, we will be able to determine trends, understand reversal and pin point the right entry and exit area.
The bollinger bands will help us to determine price overbought and oversold areas and therefore alerting us to a possible reversal, trend change, buy or sell signals.
The ichemoku clouds tells us the exact entry points.
DETERMINING TREND USING THE BICHI STRATEGY.
UPTREND.
To determine an uptrend using this strategy, price chart should touch or break the lower Bollinger band to confirm the overbought position, there should be a rebound afterward to the opposite direction.
Price chart should break above the ichemoku from below.
At the point the price chart moves above the ichemoku clouds from below, it is an indication that an Uptrend is confirmed.
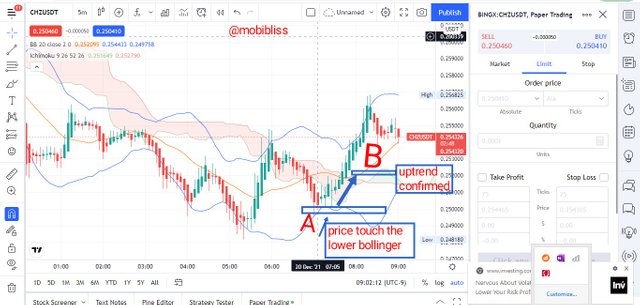
In the above image, the price chart had a rebound when it touched the lower bollinger band at point A , and blue candles ensued. At point B, price chart crosses above the ichemoku clouds, at this point, the uptrend is confirmed.
DOWNTREND.
A downtrend happens in the opposite direction of the Uptrend. When the price chart move below the ichemoku clouds, we have a downtrend.
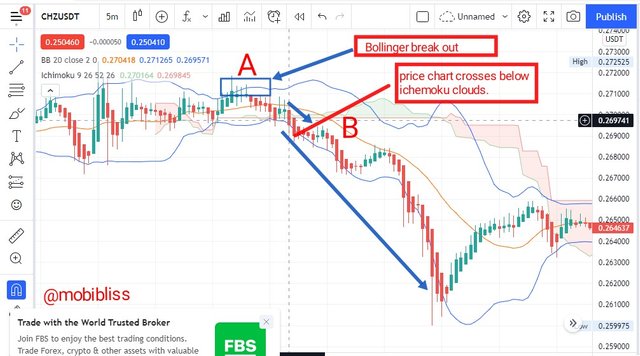
As shown in the above image, price broke at the upper Bollinger bands at point A and made a rebound. At point B price broke the ichemoku clouds confirming the downtrend.
REVERSALS USING BICHI STRATEGY.
We can easily see rebounds in the same way we see a down or uptrend.
For example,
- If there is an established uptrend, the price chart touch the upper Bollinger and rebound. Then when it crosses below the ichemoku clouds, we have a new trend - bearish trend. Therefore, we can call that a bearish reversal.
- In an established downtrend, when the price chart touch the lower Bollinger and rebound, and then crosses above the ichemoku clouds, we then have a new trend - a bullish trend. We can therefore call that a bullish reversal.
STRONGER REVERSALS
Stronger reversals can be observed by using a different method. Markets most times form a sideway movement after a breakout has occurred at either the lower or upper Bollinger.
We can notice a sideway movement when the price rallies around the middle band of the Bollinger or rally around the ichemoku clouds crossing it severally. At the end of the sideway movement, a strong reversal may be the case.
Strong Bearish Reversal.
In a bearish reversal, there should be an established uptrend. The price should break or touch the upper bollinger to indicate a possible reversal. We should notice a sideway movement after the price chart touch the overbought position of the bollinger. After this sideway movement, price chart should move below the ichemoku clouds confirming a new trend. The longer the price chart stays below the ichemoku clouds tells us the strength of the new trend.
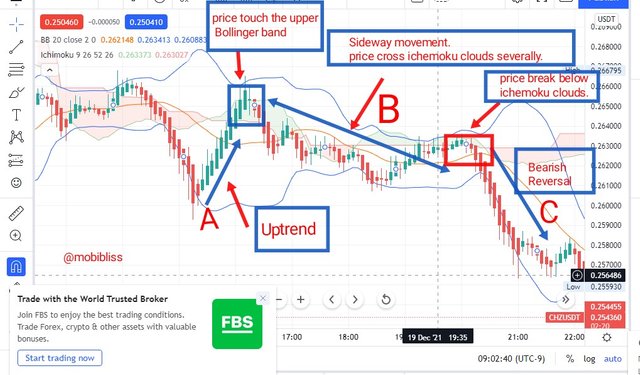
In the above image, notice that there was an established uptrend at point A, then at point B, price broke the upper Bollinger. There was a sideway movement afterwards. At point C , after the sideway movement, price broke below the ichemoku clouds causing a bearish reversal.
Strong Bullish Reversal.
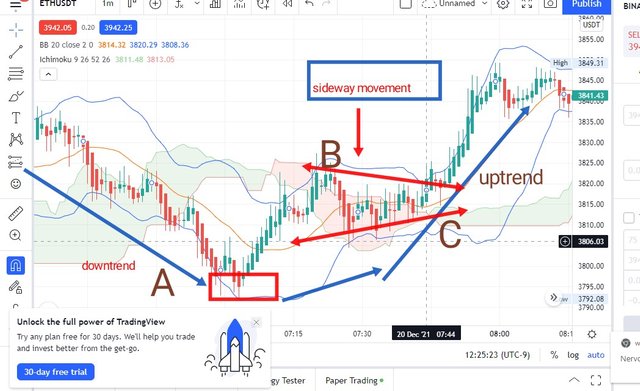
The image below shows a strong bullish reversal. At point A, we noticed an established downtrend, then price touch the lower bollinger band showing the oversold position. We could notice a rebound afterward to the up side . At point B we saw a sideway movement when the price touch the upper Bollinger. Price rallies around the ichemoku and cross it severally. Thereafter price break above the ichemoku to show a . At point C, price broke above the ichemoku cloud indicating trend continuation and a strong bullish reversal.
Another bullish reversal example using the Bichi strategy is seen below.
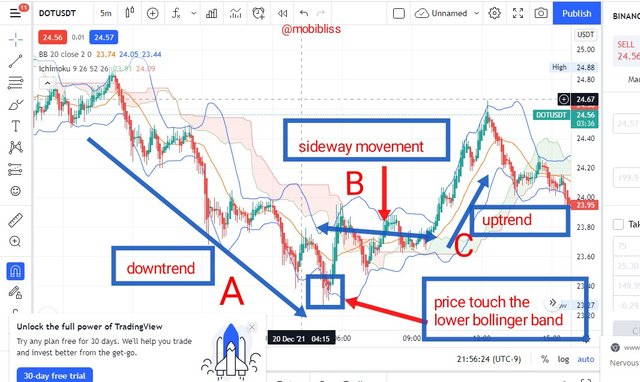
In the image above, we can notice an established downtrend. At point A , price chart touch the lower Bollinger bands. At point B, we notice a sideway movement. At point C, price broke above the ichemoku clouds indicating a strong bullish reversal.
TRADING USING THIS STRATEGY.
In this strategy, While the Bollinger prepares us to take an action, the ichemoku clouds tells us when to take such action.
Take a closer look at the image below
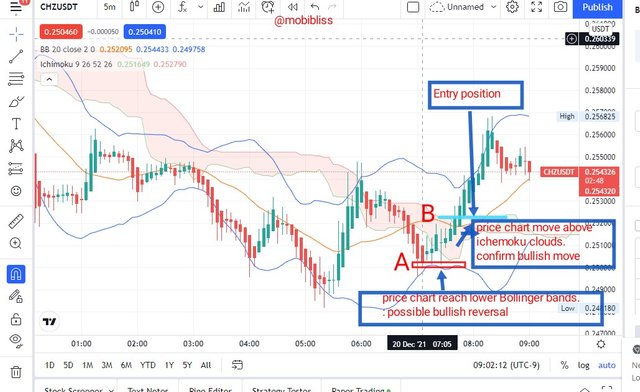
In the above image of chzusdt is an example of
a set up Bichi strategy. Notice that at point I marked A, price chart has touched the lower bollinger band, identifying that a bullish reversal is about. At point B, price chart cross above the ichemoku clouds from below . At this point, we have our entry. Notice also that the next candle after the crossing of the price chart opened below the previous candle but above the cloud, I drew a line to point out the exact opening. Our stop loss should be at point A.
CRITERIA FOR TRADING THIS STRATEGY.
BUY TRADE.
- Price chart should touch or break the lower bollinger band.
- Ichemoku cloud should not be far away from the lower Bollinger.
- Price chart should cross above the ichemoku clouds from below.
- Entry point should be the next candle after the ichemoku cross.
- stop loss should be at the lower Bollinger or we use 1:1 or 1:2 risk to reward ratio.
SELL TRADE.
- Price chart should touch or break the upper Bollinger bands.
- Ichemoku Clouds should not be far from the upper Bollinger line
- Price chart should break below the ichemoku clouds.
- Entry point should be the next candle after the ichemoku cross.
- Target lower Bollinger as take profit, upper Bollinger as stop loss or use 1:1 or 1;2 risk to reward ratio.
In the below image, I placed a demo "sell" trade meeting all the requirements. Please go through the image.
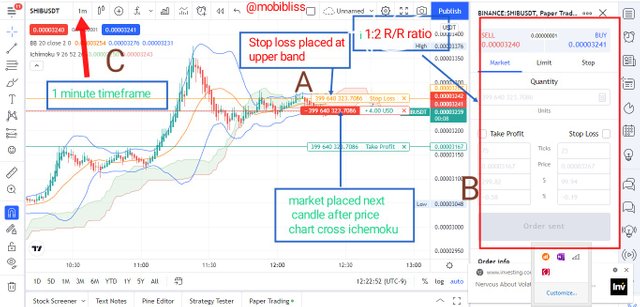
Notice in the above image that price chart touched the upper band at point A, and then made a rebound. Ichemoku Clouds was close to the upper Bollinger bands. I waited till the price chart cross below the ichemoku. I placed a trade at the next candle after the cross. I used 1:2 risk to reward ratio . I used 1 minute timeframe.
MY OPINION ABOUT BICHI STRATEGY.
One thing I appreciate about this strategy is that a trader is left with no doubt on the exact place to place a trade. For example, once all the conditions for this strategy are met and the price chart cross the ichemoku clouds, we know that we are to enter a trade. The strategy is simple and easy to read.
Another good side is that it is also easy to filter false signals with the strategy. For example, if the ichemoku is not close to the band of the bollinger, ( either upper band for "sell" or lower band for "buy" conditions), we know that the signal is not accurate and therefore should refrain from entering such trade.
Pros.
- The signals offered are stronger and offers up to 80 - 85 accuracy. When I tested the strategy over and over again, I made some notable profits in demo trade. Out of 5 trades, only one was a loss.
- The signals are easy to read and understand.
- It is good for in-traday traders since it works on a shorter timeframe.
- It is good for option traders, since the contract in option has expiration time within minutes.
CONS.
One draw back I noticed is that the signal is not fast enough. It may take some time and enough patient to get a perfect signal for the strategy. A person used to option trading may liken it to the 2 mins strategy with moving averages. It takes time to indicate a signal but when the signals come, it often has higher wins than losses.

Crypto IDX and ALT IDX is a solution made by Binomo broker to enable traders profit at fixed rate at all time.
Forex market trade on 5 working days, which is Monday through Friday. On the weekends, Saturdays and Sundays are like holidays and Market reopens on the next Monday. On the other hand cryptocurrencies and indexes work 24/7 and do not go on breaks like the forex market. When trading binary options, many brokers offer varying percentage interest, most of these interest are not fixed and can keep changing overtime. Interest rate in binary options should be above 75 percent for any value invested in other to make up for loosing trades. When profit percentage is below this threshold it becomes even less profitable to trade. To solve the problem of varying percentage profit on investment Binomo broker introduced an alternative which is Crypto index and Altcoin index. The profit on winning trade for Crypto Index is fixed at 83% , while that of Altcoin index is fixed at 82%. So when the chips are down, traders can trade the crypto index and Altcoin index.
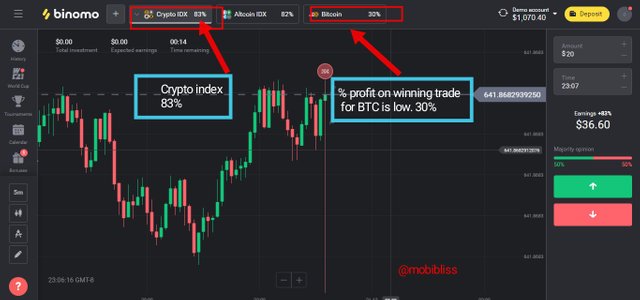
Take for example, if profit offered for trading Bitcoin is 30% at a time, then turning to Crypto index is an option.
CRYPTO IDX
The Crypto index is gotten as an average value of four basic Crypto coins - Bitcoin, Litecoin, Ethereum and Zcash.
- The profit return on investment is fixed at 83%
See image below.
- Like the rest of cryptocurrencies, it is available for trade on 24/7.
ALTCOIN INDEX.
Just like the crypto index Altcoin index is computed as an average of four Altcoins, namely: Ethereum, Monero, Litecoin and Ripple.
The Altcoin index has a fixed 82% profit on winning trade as observed from binomo site.
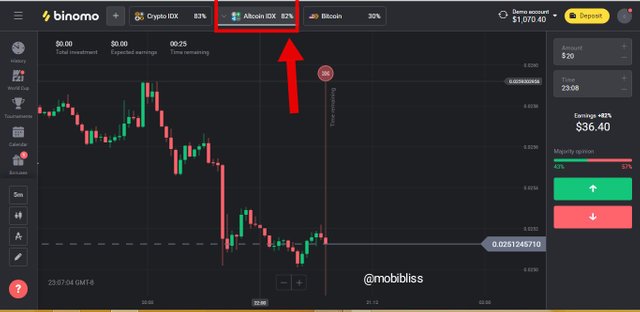
Just like crypto index, it is available for trade at all times
WHAT IS SIGNAL PREDICTION TRADING. (OPTION TRADING)
Simply put, option trading involves betting on the future movement of an asset within an agreed period. One can predict in either direction, either up or down. Correct prediction of the signal means a win even if with a pip and wrong prediction means a total loss even if with a pip.
Take for example, If I stake $1 to predict that the price of BTC will move up from it's position within 1 minute and upon the I minute expiration period, my prediction becomes correct, I have earned profit based on the percentage the broker was offering at the time. If the broker was offering 80% ROI on winning trades, I have made $0.80 . Total money that will be returned will be $1.80. However, if my prediction is wrong even if by a pip, I have lost my entire $1 investment.
When trading cryptocurrencies, brokers equally give targets. For instance , you predict that a price of alt idx will go up within 23 mins expiration period, if you choose 3x multiplier, it means that the target your expected to reach before you profit will be three times from your current position. Some brokers may not need to add the multiplier but they set target for the contract. Please see below image.
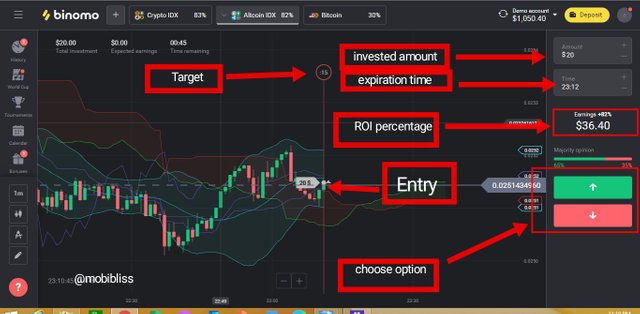
In the image, above, I am using our Bichi strategy to trade. As you may observe, I have my signal to trade buy ( from the Bichi strategy. The price chart forms support at the lower Bollinger band, price chart has crossed above the ichemoku clouds ) which is the green button. Which means from my analysis I am predicting that the price will go up. I invested $20, my ROI is already calculated, and the time for the contract is established 23.12 mins. If upon the expiration of this 23.12 mins the price moves up as I predicted, then I will win the agreed amount but if I am wrong, I will loose my $20.
Another cheat by the broker is the target area. That means, if I made the right prediction, the price also need to hit the target area, if it did not within the timeframe, then I have lost the my money.
Is option Trade legal in Nigeria?
Many countries see option trades as gambling and because some are not regulated their activities are banned in some countries. However, Nigeria accepts gambling firms and therefore the activities are legal.
Penny Currencies.
If I am to create my penny Index the first 4 cryptocurrencies in the list will be Telos, Reef finance, Chiliz and steem.
Telos (tlos)
Telos is among the fastest and scalable Blockchain existing in the crypto space. It is among the third generation Blockchain with web 3.0 feature having the capability of running smart contracts just like Ethereum but more scalable and prediction to be more robust.
We have seen as Telos counterparts like Solana, Polkadot and Avalanche price has soared within the past months, there are therefore great expectations for the crypto asset. Tlos is the based currency and the only currency for operation within the ecosystem which makes it a promising investment.
Today tlos is selling at $0.666520
Reef Finance.
Reef finance is a DEFi aggregator, bringing the best of defi in one place for DEFi enthusiast. The coin is built on polkadot and enjoys the strong security of polkadot ecosystem. Reef coin is the coin for interaction within the ecosystem and this makes the coin promising.
Reef is sold today at $0.01967193
Chiliz
Chiliz has a good innovation. The exchange platform partners with sports clubs to create a fan token for their fans which will allow them to contribute in some way to the decision making of their clubs. With Chiliz exchange, one can invest in the fan token of any club of choice and can trade it back to Chiliz on the exchange. The coin will meet more traction as more and more people transact using in the ecosystem.
Today, Chiliz (chz) is selling at $0.2906
Steem.
I want to mention steem because if the many innovations going on right now on the platform. The idea of club 5050 will allow people to hold more steem and therefore creating some kind of scarcity. These innovations would likely lead to price of steem going high in 2022.
Today steem is selling at $0.4364.
What is Penny currencies ?
Penny currencies are crypto currencies selling below $1 dollar. The basic characteristics is not the price but the potential seen in the coin especially when it is envisioned to grow in the near future.
Coins like the ones I mentioned above have great potential. These potentials are seen in the project of the coin. Coins with great projects are more likely to be adopted readily. Another thing to consider is the use case, because each of the coins has a purpose and a need that it serves, it becomes easier for investors to find it as next gold mine.

Bichi strategy is formed from the combination of two indicators - bollinger bands and ichemoku clouds. While Bollinger helps a trader understand the overbought or oversold positions, ichemoku clouds shows exact entry points. The strategy works as resistance and support and therefore guiding a trader on when to place a trade.
With the strategy, it is easy to detect trend, reversals and entry position. The strategy works on a shorter timeframe and can also benefit option traders.
Option trades provide opportunity to trade on a contract within a stipulated period. One can predict for or against.
Penny assets are assets that sell below 1 dollar.

image references.
Images for this article are drawn from tradingview.com. source
Binomo.com source