WHAT IS CONFLUENCE TRADING ?
Confluence Trading refers to building a trading strategy with a combination of two or more trading technique or analysis tool in other to increase profitability chances.
In technical analysis no single indicator or technique can be 100% accurate or even much profitable in the long run. If a trader use one technique or analysis tool which may give some level of accuracy in trading, such accuracy may be enhanced when it is combined with another indicator to confirm or filter the signal given by the previous indicator.
Take for example, a trader uses a technical indicator to analyze a trade. From the Analysis and signal given by that single indicator he want to enter a buying position. The probability of the analysis being correct will be slim, but when he adds another indicator as a confirmation tool, he will achieve more accuracy and equally will be more confident taking that trade.
The idea of confluence Trading is the use of multiple technical analysis tool or technique with similar reading to achieve more trading accuracy.
A trade setup can consist of a technic: like a chart pattern formations, a chart setup or a candle chart readings, for example the use of dogi candles, gaps, three crows and the rest to analyze a chart. It can also be a combination of two or more technical indicators or the combination of both the indicators and the technic. In building a good trading setup, we need not rely on one known technique or indicator, the more we combine more the better and more reliable our setup.
Let's examine the chart below:
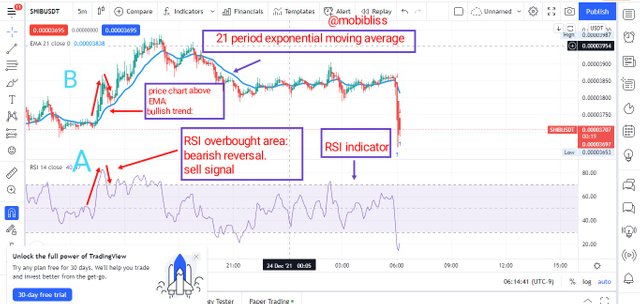
In the shibusdt chart above, notice that I have added two indicators, namely : 21 period exponential moving average and an RSI indicator.
The moving average will help us determine the trend.
- When the price chart is above the moving average, we analyze the market as an Uptrend, conversely, when the price chart is below the moving average, we analyze the market as a downtrend.
- Crossing of the price chart from above the EMA to below the EMA indicates a bearish reversal. Crossing of the price chart from below the EMA to above the EMA indicates a bullish reversal.
The RSI helps us to analyze the assets overbought or oversold positions.
- When the reading on the RSI indicator is above the 80% line, it is considered overbought and a high probability of a bearish turn is indicated.
- When the RSI reading is below 20% area, it is considered oversold and there are high chances of a Bullish turn.
Now let's see what is happening in the image above and the very importance of confluence Trading . At the point marked A, we can see that the RSI indicator reading is above 90%, a trader here without another indicator can conclude that we have a good "sell" signal. Now notice what happened, the proposed reversal turned out to be a fakeout. Now, at the point marked B, which is in our EMA indicator, we saw that although there was a rebound, there was no indication of reversal. The price chart is yet above the EMA which shows that we are still in a bullish movement. Secondly, there was no sign of trend exhaustion, the market is still making new higher highs.
From the above image, we have two confirmations proving that the RSI signal may not be relied upon at this time. These confirmations could've been ignored had a trader relied on only the RSI indicator as a signal provider. By adding the EMA and using a setup technic has helped us filter out a fakeout.
There are yet other benefits of confluence trading.
IMPORTANCE OF CONFLUENCE TRADING.
MORE ACCURACY.
The benefit of using multiple technic in technical analysis is to increase the accuracy of the analysis. One indicator may present lesser accuracy but with multiple similar indicators the trading setup accuracy is enhanced.
MORE CONFIDENCE.
Trading is speculative. With one indicator it is riskier. With multiple technique, a trader enters the market with more confidence. He understands that if one indicator is wrong, the multiple indicator will be more closer to accuracy.
FILTERING FALSE SIGNALS.
Some times, an indicator may give a false signal
or a fake out. With another indicator, it will be easy to filter out the wrong signal. As we observed happen in the above chart, relying on one indicator could have led to losses but adding more indicators help reach a better decision.
Now let's see how to do it

TWO LEVEL CONFLUENCE.
Two level confluence is when we add two confirmations in our trade. It could be two technical indicators or it could be a trading technique and an indicator. In whatever format we choose to use, it is done in the manner that one complements the other.
In the setup below, I have added two indicators, fractal indicator and RSI. When fractal indicates a buy or sell signal, we compare the signal with what is indicated by the RSI. For example, if the fractal indicates buy signal, we need to consider if the RSI is in it's oversold area ( that is close to 20% area). If the fractal indicates sell signal, we need to consider if the RSI is within the overbought zone ( that is within the 80% area).
Fractal indicator is a straight forward and simple indicator to read. When the fractal shows a green triangle above or is seen above the price chart, it indicates that a downward movement is about. A trader will get ready to enter a sell position. On the other hand, when the fractal is seen below the price chart, it indicates that an Uptrend is about and a trader will be ready to buy.
On the Ethereum chart below, I have indicated places where the two indicators complement themselves leading to a good trading decision.
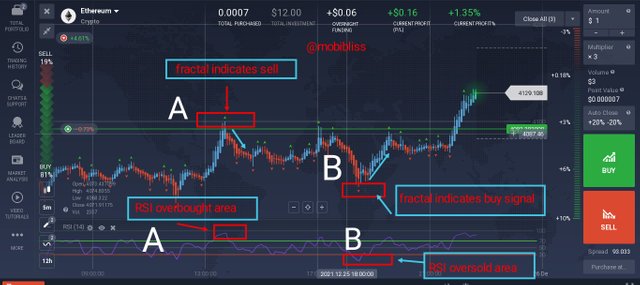
On the area I marked A on the chart, notice that the fractal indicator is above the price chart, it has indicated that a possible downward movement is about. Now I need to confirm the validity of the signal with the RSI. Also notice that the RSI is closer to the 80% line which indicates it's overbought position. Now we have our fractal signal confirmation on the RSI. What followed was a downward trend. If we have placed a sell trade at that position, it would've been a winning trade.
At the point marked B, we can also notice a buy signal indicated by the fractal indicator. The fractal is below the price chart, RSI is below the 20% area.
In both of the signals, we had a win if we had traded it. Two level confluence provides a better chance of profitability than using just one indicator.
Three level is even stronger.
THREE LEVEL CONFLUENCE SETUP.
Already, we now know what confluence is and what two level confluence means. Three level confluence is just the use of three confirmations. In this exercise I will use only indicators.
As we observed, the above setup is looking good already, but now, I am going to add a simple moving average sma period of 9. I am using a shorter period because I am working on a shorter timeframe. The SmA is a lagging indicator and it is good for confirmation. It will help us indicate trend, and entry positions.
Just as we pointed in the preceding subtopic, Moving average helps us detect the trend direction. But here, the SmA will do more than just confirming trend. It will be used to point out entry position. At the point of the SmA crossing the price chart to whichever direction we have our entry.
- If the SmA cross above the the price chart we enter sell.
- If the SmA move below the price chart we enter buy.
Now let's combine the three.
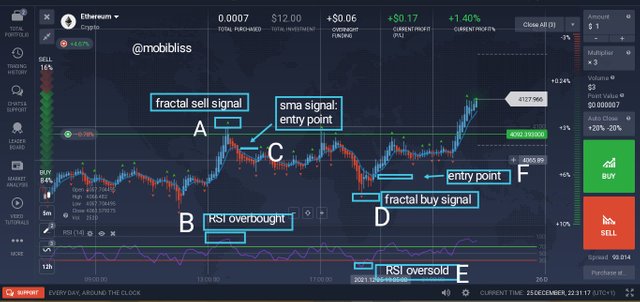
This is the same Ethereum chart as above in which we use the two level confluence. What we just added here is the Sma. Notice at point C, the SmA move above the price chart indicating an entry position. Already, we have our fractal signal sell signal at point A. At point B, RSI confirmed the signal and now we have a further signal confirmation on the SmA. While we have the fractal as our main signal, the RSI as a confirmation tool, then the SmA serves as the entry point indicator.
We can also observe same thing happened in the buy signal at points D, E and F. Fractal gives signal, RSI confirms and sma points out our entry point.

TRADING USING CONFLUENCE.
In the above subtopic, I have already explained the steps to trade using confluence, now I will apply it on two charts, that is Ethereum and bnb.
In this confluence setup, I will use three indicators as I showed above, namely : fractal, RSI and sma. Fractal will be the main signal provider, RSI will confirm our signal, SmA will further confirm the signal and indicate the exact point of entry.
HOW TO IDENTIFY TREND USING THE SETUP.
BEARISH TREND.
To identify bearish trend the following criteria need to be met.
- Fractal would move above the price chart indicating a bearish trend reversal.
- RSI should be within the overbought area.
*Notice red downward candles especially when using heikin ashi candles. - Sma should move above the the chart confirming a bearish trend.
BULLISH TREND.
To identify bullish trend
1: fractal should move below price chart giving a bullish reversal signal.
2: RSI should be within the oversold area.
3: Notice some green candles upward.
4: SmA should move below the price chart to confirm the bullish trend.
See the chart below.
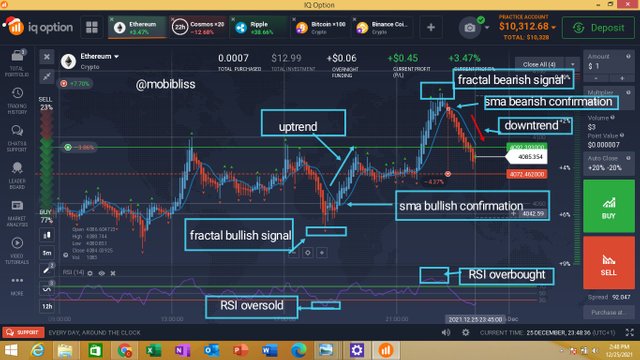
SELL TRADE.
To place a sell trade using this setup
- Fractal should give a sell signal by moving above the price chart.
- RSI should be within the overbought area.
- Wait till sma cross above the price chart.
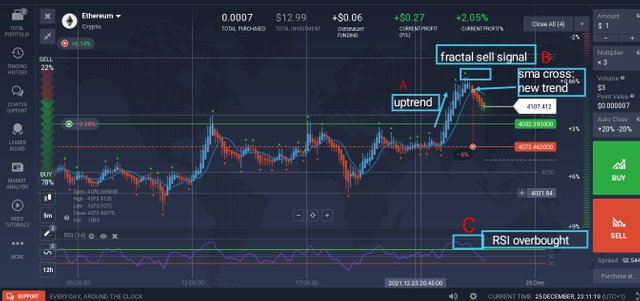
In the image above, we have an established uptrend at point A, then at point B we have our fractal indicator give out signal for a downtrend. At point C, rsi is within the overbought area confirming the fractal indicator signal. I waited untill the SmA cross above the chart before I entered the trade.
BUY TRADE.
Buy trade happens in the opposite condition of sell trade.
- Fractal should indicate bullish reversal by moving below the price chart.
- RSI should be within the oversold area.
- Wait till sma move below the price chart.
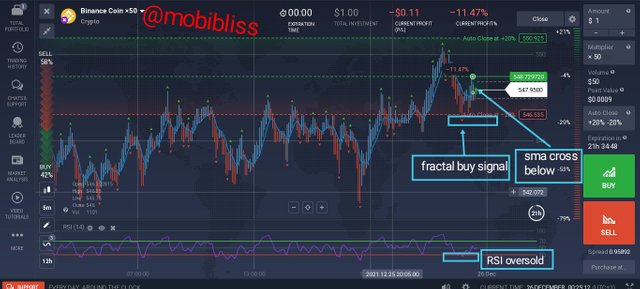
In the bnb chart above, we followed the procedure for buy setup. Fractal was below price chart indicating a buy signal. RSI is within it's oversold area. I waited till SmA cross below the price chart.

CONCLUSION.
Confluence trading refers to using more than one technique or indicator in a trading setup. The very purpose is to enhance trading profitability.
Two level setup is when two signal confirmations are used. Three level is when three confirmations are used.
The benefits of using confluence trading includes better profitability and enhanced accuracy, more confidence for the trader and filtering out false signals.

image references.
Tradingview.com source
Iqoption trading app.