1.) Perform the staking on a platform of your choice.
Which platform did you choose and why? Which wallet did you use for the procedure? Use screenshots of your own. How can you link your wallet to the platform you chose? Which coins will you staking with, what is the APY/APR (show screenshots).
Assuming the APY or APR of the coins you chose for staking and the current market value of those coins remains stable, how many coins should you have in 1 year? In US Dollars how much would that amount of coins equal?
You can use an exchange for the procedure but you cannot do staking on an centralized exchange.
Uses platforms such as PancakeSwap, MDEX, Uniswap...
2.) Pick 3 cryptocurrencies and perform a 7-day and 30-day technical analysis. Draw trend lines and describe whether the coins are in a continuation or reversal pattern. Take screenshots.
3.) How can we differentiate a bearish season from a bullish season in the market?
The graphs you use must have your Steemit username.

I must commend all you professors for your selfless efforts in educating us in cryptoacademy. I equally thank the steemit team for these intuitive program. Thank you more professor @Imagen for your lesson on technical analysis. Here below is my homework entry. I hope to meet your requirements.
Task 1
PERFORMING STAKING ON UNISWAP.
Staking is a means of adding liquidity to a staking pool. we can liken staking as fixed deposits used by banks. We fix deposit our money for a certain period of time. Banks use our money to do business and they give us interests in return for our investments. In a similar way, by staking we will be lending an exchange platform our coins and we will get interest. Because the crypto platform is decentralized the interest is calculated automatically using a process known as AMM (automatic market maker)
CRYPTO EXCHANGE PLATFORMS
There are various platforms in which staking can be done, these platforms are listed below:
Coinbase, Binance, Sushiswap, pancakeswap, Uniswap etc.
CRYPTO WALLETS
Token pocket, Metamask, Trust wallet etc.
We can stake a coin in a very simple steps. First and foremost we need to connect our exchange platform to our wallets. I want to demonstrate using uniswap and metamask.
WHY UNISWAP
Uniswap has a lot of coin listing. Over 1500 coin listed on the exchange platform. It allows one to choose from variety of options. To connect with Wallet platform is quite easy by following a few simple steps.
Step 1
CONNECTING UNISWAP TO METAMASK
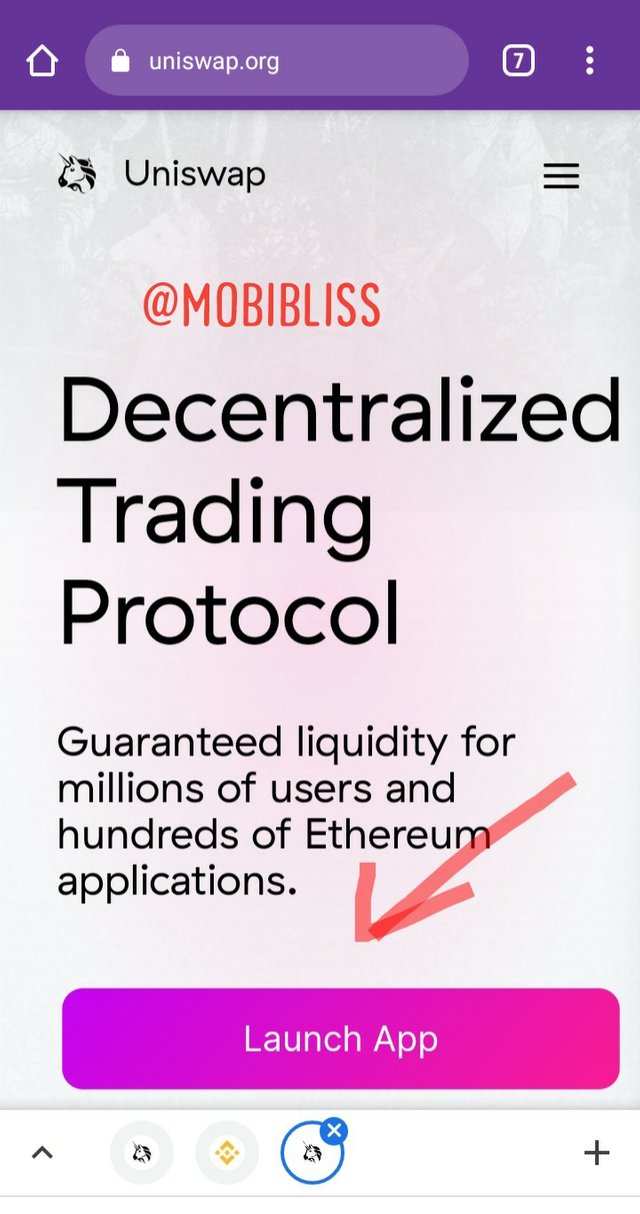
Goto uniswap.org. lauch app.
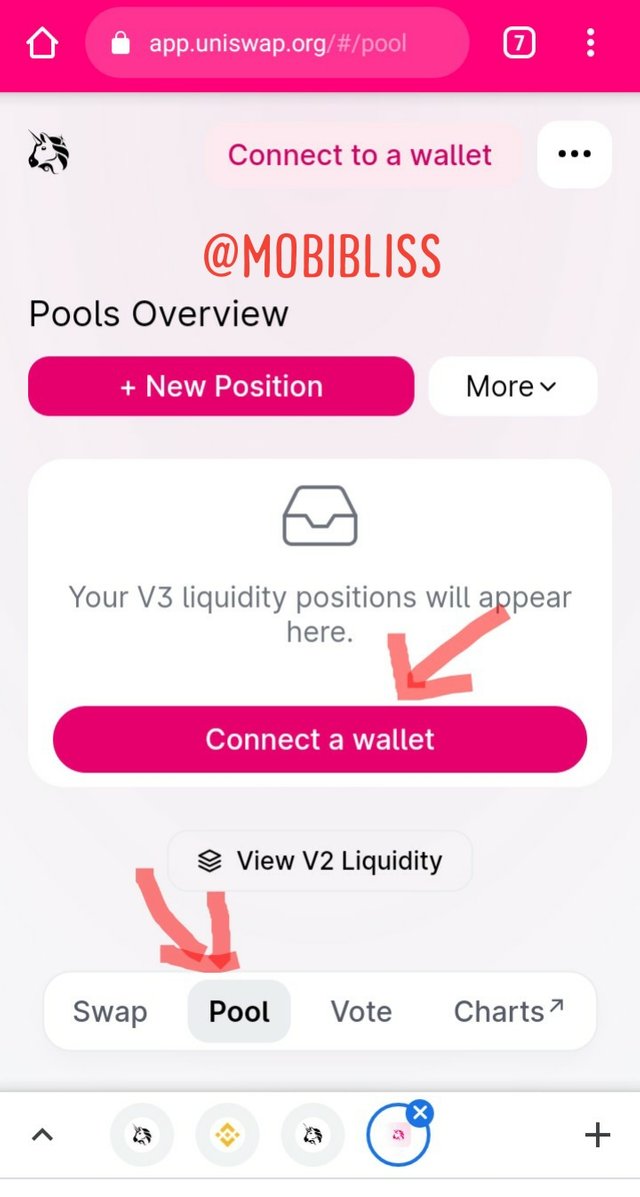
On the next screen choose "pool" and connect.
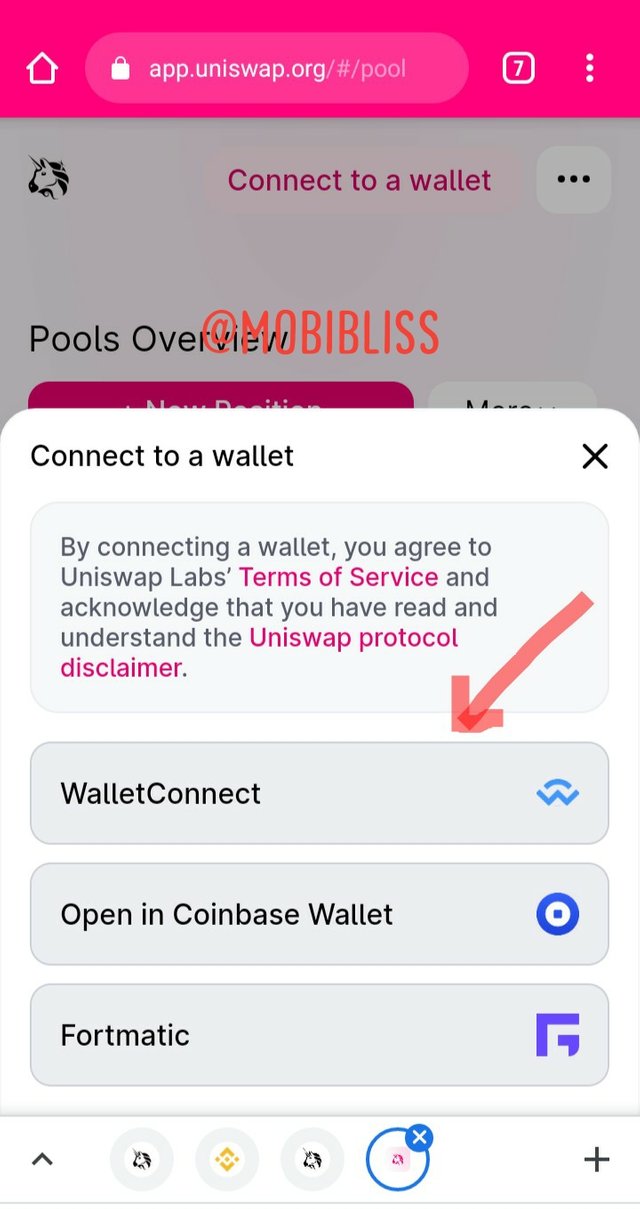
You will be asked to connect to a wallet.
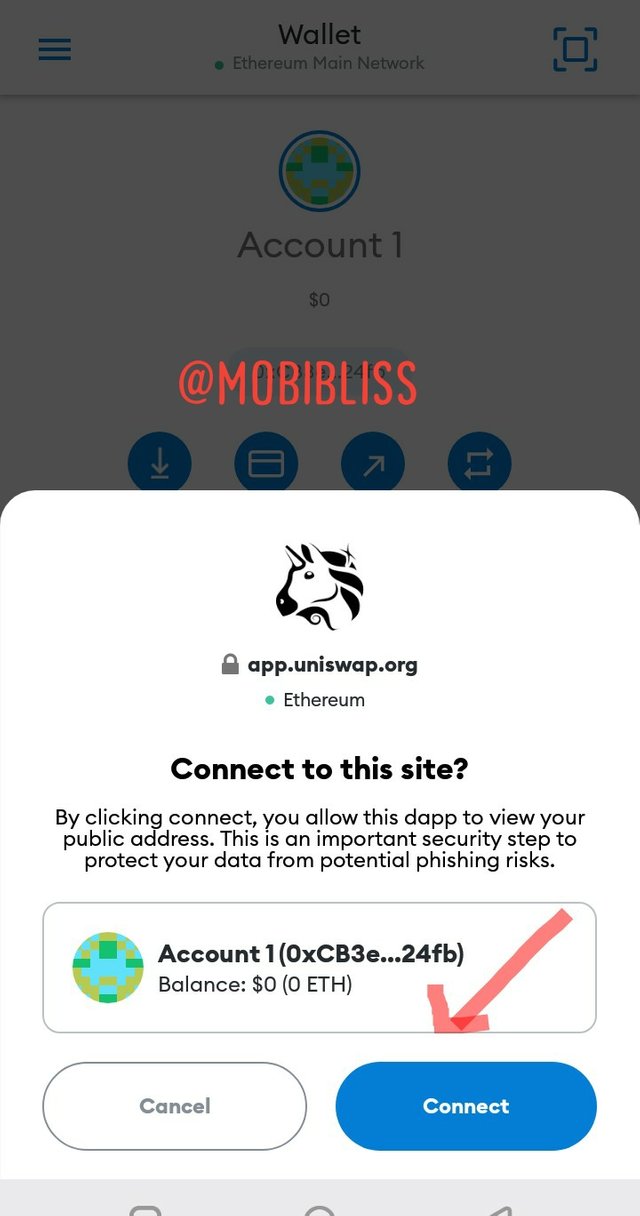
Afterwards click connect. Then choose your installed wallet.


You will be asked to input your wallet password.

Your wallet address password will show automatically, then you connect.
PERFORMING STAKING.
In this exercise I am going to make use of two currency pairs Ethereum and UNI.
After connecting our wallet, we then goto "pool" in the uniswap platform. See image below.
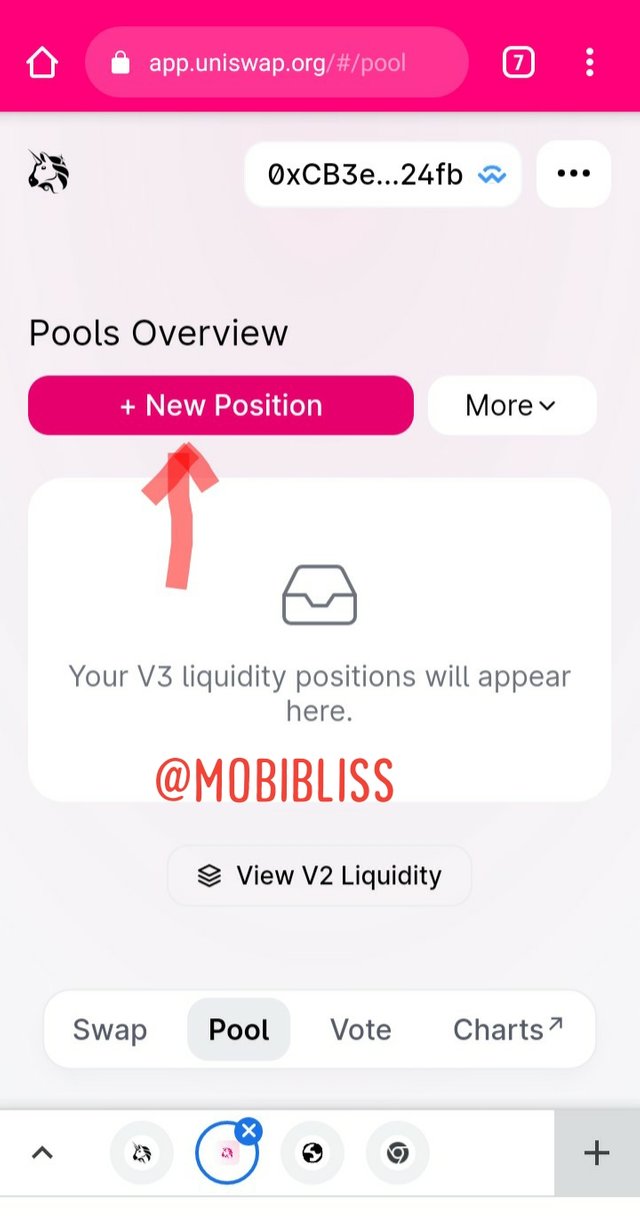
Choose new position
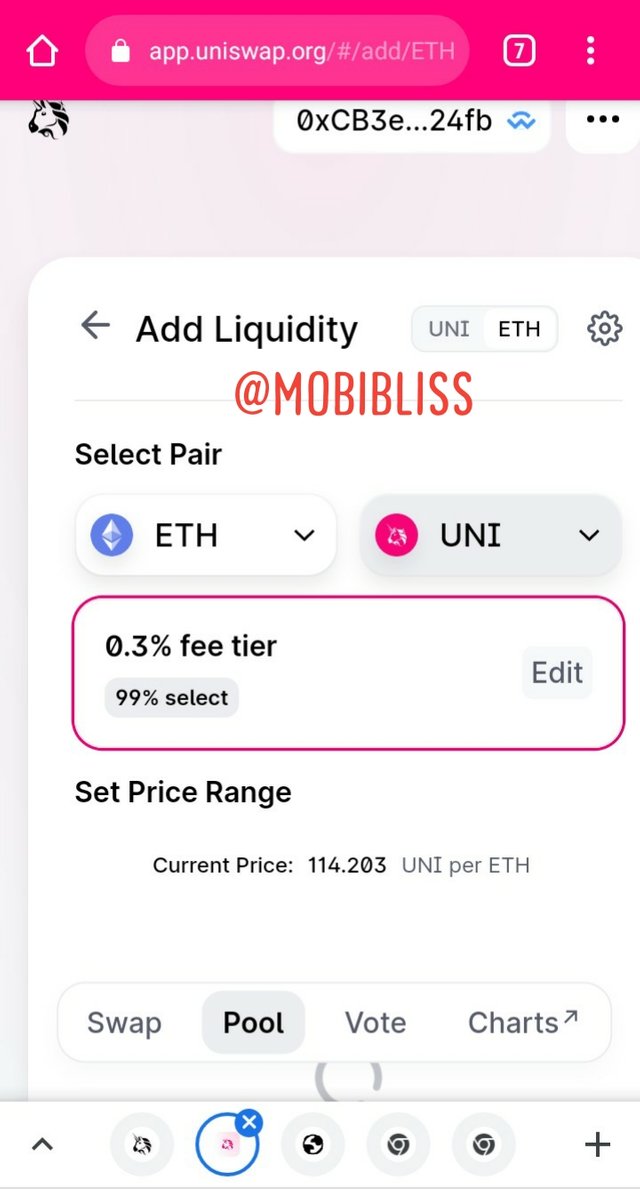
In the drop box, we select our pair. Here the percentage is calculated automatically. In this case it is 0.3%. In the next screen I will input the amount of Ethereum I wish to stake. It will automatically calculate it's UNI equivalent.
Once I click "approve" I have staked.
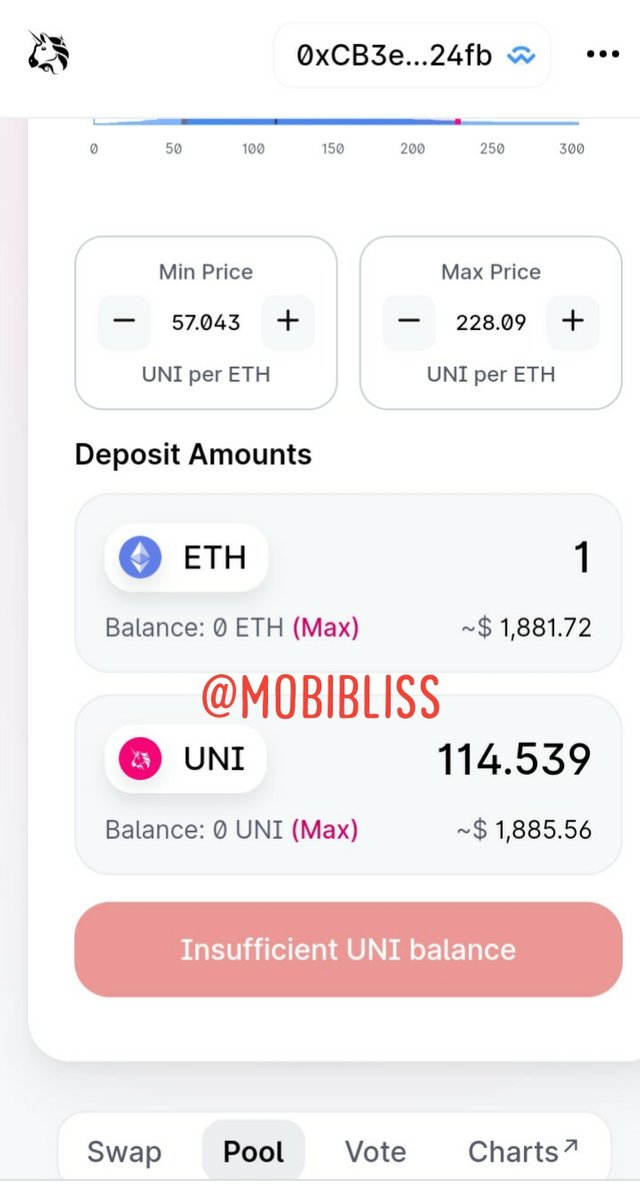
For this exercise, I used 1 ethereum and it amounts to 114 UNI with some fraction. The value of one Ethereum as at now is $1888.5.
The value of 114 UNI and it's fraction equals the price of 1 ethereum
Suppose the price of both currency remain stable for a year what will be the APY and APR?
CALCULATING APY
Apy is Annual percentage yield. It refers to compound interest. It means that staking 1 ethereum, $1,888.5 will give 0.3%. For the first month I will get the amount plus 0.3%. In the second I will get the 0.3% of both the initiative deposit + the interest gotten from the first month and so forth.
Here is the formula below.
APY= (1 + r/n )n – 1,
Using online APY calculator,
I will get the APY of 1 ethereum which is $1,888.5 for 1 year. In this case I will use "thecalculatorsite.com reference
I will input the values as shown below. And the calculator will give me the result.
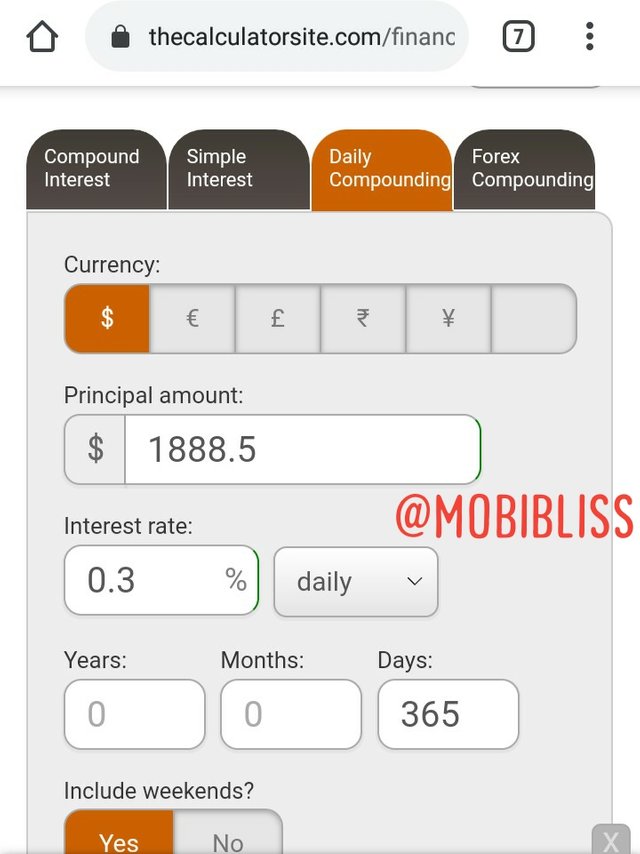
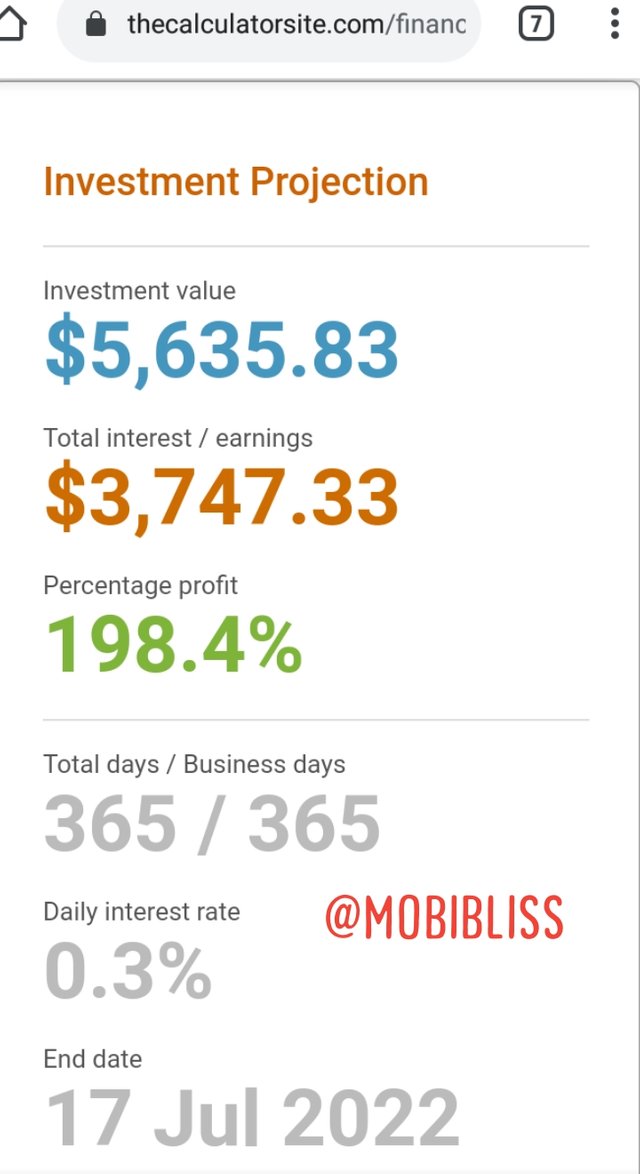
APY of $1888.5 = $3747.33
CALCULATING APR
APR is the annual percentage rate. The interest is different from APY. While APY is a compounding interest, APR do not compound.
To calculate APR we will get the interest percentage for a day multiply it by the number of days and add the result to the principal investment.
APR =(daily % interest × 365) + principal
In this case it will mean 0.3% of $18885.5 × 365 + $1888.5
Which is $1956.486
The APY is $1956.486

Task 2
TECHNICAL ANALYSIS.
For this task, I will use three crypto coins namely:
Cardonna (ADA), Tron (TRX) and Bitcoin (BtC)
1: cardonna (ADA)
ADA 7 day analysis
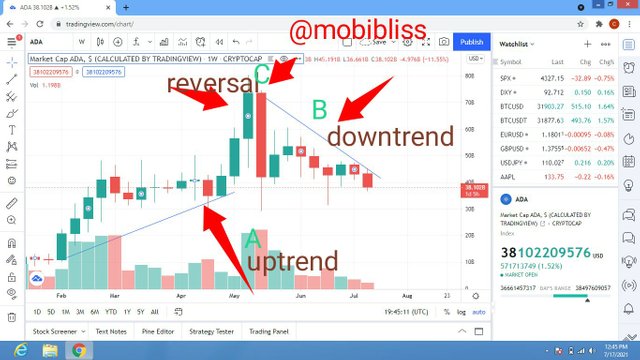
At point A we see an uptrend. Then a consolidation before the higher high occurring, likely caused by news which is a herd mentality bias. We see reversal at point C. A long red candle signifies a significant drop in price. Likely caused when people panic sell. At point B we see a downtrend. This kind of chart pattern is a continuation chart pattern called the pennant chart pattern.
1 month technical analysis of ADA
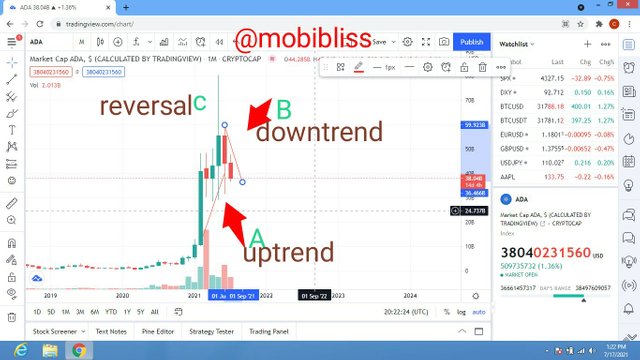
We see similar thing repeating itself in the one month chart. We have a pressure buy at point A, A reversal at point C and a sharp sell at point B. The chart pattern is still pennant chart pattern.
Tron 7 day analysis
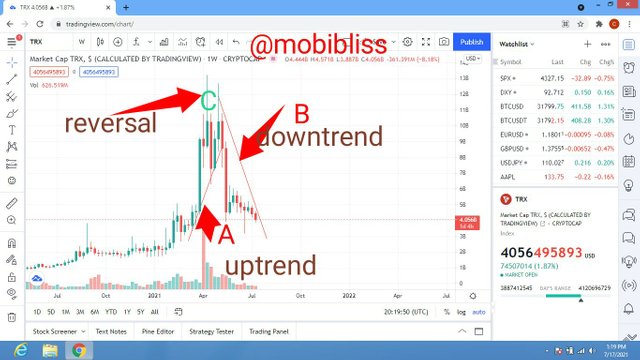
At point A, we see an uptrend happening. Within point C, we could see a swing low and high before reversal, these are often caused by whales, as they create news causing people to buy more. At point B we see an example of panic sell. The price took a long side down resulting to a downtrend. This king of chart pattern is a reversal chart pattern known as double top.
Tron 1 month analysis
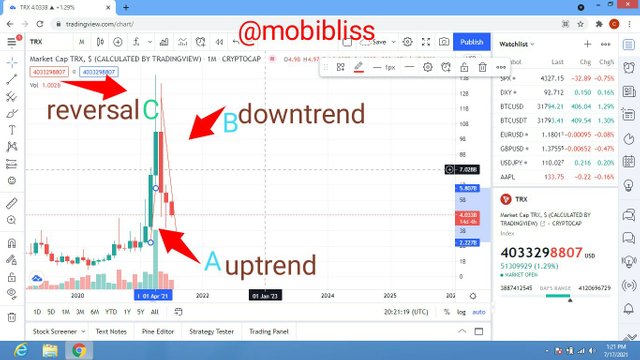
In the one month Tron chart shows a continuation pattern. We see an uptrend happening at point A and downtrend at B.
BTC 1 week analysis
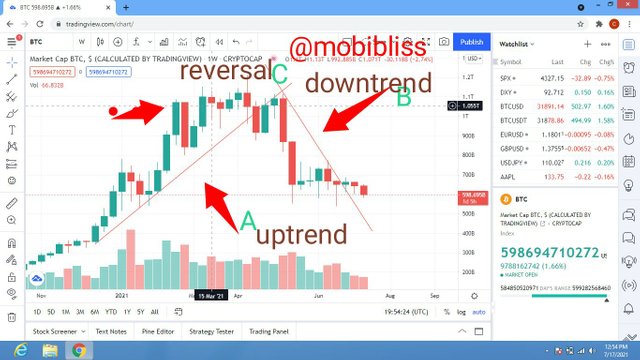
In BTC 1 week chart above, we see a reversal chart pattern known as head and shoulder. Just as in the other charts, uptrend occurs at point A.
At point C we see swings. There is this struggle between buyers and sellers. The buy sentiment seem to have won at point C before the reversal. At point B we are on a downtrend
BTC 1 month analysis
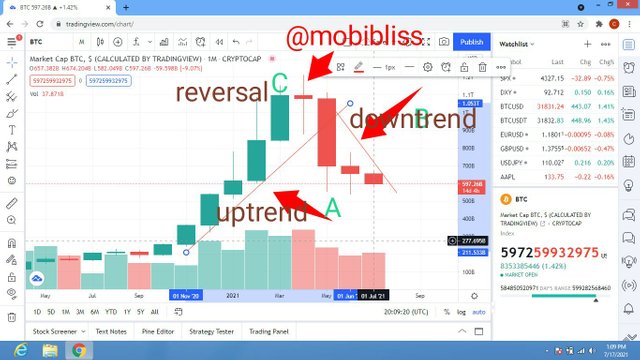
The chart demonstrated here is a continuation chart pattern. The pennant. A continuation uptrend occurs at point A and at B we have a downtrend.

BULLISH AND BEARISH SEASON
Whenever we have an uptrend, we are in a bullish season. We can indicate that on a chart by the more dominant green candles.
The candle chart is a technical indictor that tells what trend we are in. A dominant green candle tells a bullish market.
Conversely a dominant red candle points to a downtrend. Aside from the candle chart, we have other indicators that helps us identify trend. Like the RSI, moving averages etc.
RSI indicator calculates by percentage of 0- 100. Below 30 shows oversold area, above 70 shows overbought.
CONCLUSION
Staking is a means to add liquidity to a staking pool. Most staking exchanges offer compound interest know as APY.
Technical indicators are tolls for technical analysis. When used well can lead to a profitable trade.
Thank you for participating in the Third Season of the Steemit Crypto Academy.
You made a great effort, however, the following sentence is wrong:
It is not, $ 1956,486 is the equivalent amount in USD that you will have at the end of the year after stake 1 ETH
On the other hand, in Question # 2 the analyzes should be carried out for periods of time of 7 and 30 calendar days respectively and not on historical data with compressed lapses.
Continue to strive, I look forward to continuing to correct your next assignments.
Downvoting a post can decrease pending rewards and make it less visible. Common reasons:
Submit
Thank you professor
Downvoting a post can decrease pending rewards and make it less visible. Common reasons:
Submit