INTRODUCTION.
It is indeed a wonderful and concise lecture, professor @allbert. The lessons are clear and easy to understand. Thank you so much.
The intent of trading with support and resistance and gaps are to identify best entry and exit points. It enable a trader to know when to enter a trade, where to set our stop loss and take profit. These practice saves a trader from wrong market entry and helps minimize loss.
Gaps seldom occur in a trade but when they do, they carry good information.
Trading with support and resistance levels means identifying areas or levels where market price movements makes the most turns up or down. While price movement may form many patterns resembling pennant, flags, double shoulders or double bottom, Head and shoulders, sharkfins etc, yet there are these levels conspicuous enough where price movement makes most reversal repetitions up or down. It is as if a certain instruction has been given to these charts ordering them on where they should not cross, and they seem to obey.
What a trader does is to draw a line on those levels, high or low, and connect them. The line can be a horizontal line if the market is trending or slant line if the price movement slants. To draw a line, we must identify at least two level highs or lows where reversals took place.
The reversals that occur at the bottom of a chart leading to bullish reversals are known as supports, the reversals that leads to bearish reversals is know as resistance. However, market could take a new turn where former resistance becomes support.
In this post, I will focus on
- how to identify weak and strong levels, and explain the difference.
- gaps, types of gaps
- and how to trade using support and resistance and also how to trade with gaps.
•post expectations.
This task will follow as a response to the task questions presented. Each question will be asked and the answers will follow below.
•Style
I will endeavor not to be too technical in this post. I will favour plain language.
•use of images
*Most images will be drawn from tradingview.com. source
•••
1•
>Graphically, explain the difference between Weak and Strong Levels. (Screenshots required) Explain what happens in the market for these differences to occur.

STRONG SUPPORT AND RESISTANCE LEVELS.
I have already mentioned above that to draw a support or a resistance line, A trader must identify at least two repetitions where price chart hit a level and turned back up in the case of "support" or hit a level and turn downward in case of "resistance". As price chart makes hills and valleys, highs and lows, a trader may notice that certain boundaries seems to be respected by the price chart.
A "support" or "resistance" is said to be strong when there are more rebounds occuring in that area, usually above three times. When prices respect the support or resistance line more often, we say that it is a strong level.
A support or resistance line is said to be weak when there are fewer rebounds occuring within the levels.
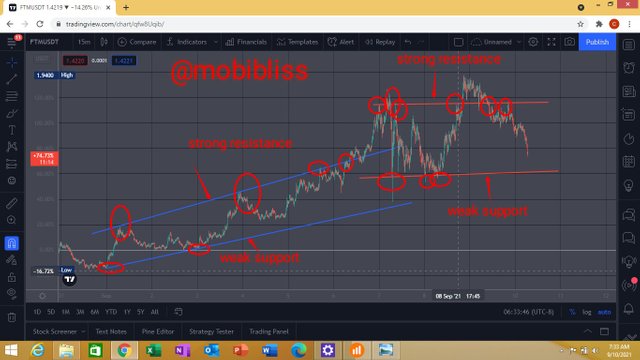
DIFFERENCES AND WHAT PRICE MUST DO FOR THE LEVELS TO OCCUR.
The difference between the strong and weak levels lies in the number of times the levels are respected by the price chart.
Individual traders usually make forecast and analysis of a particular tradable assets. These analysis leads a trader to a decision of where in the price chart he needs to enter buy or sell. Once that decision is reached, a trader sets a limit order ( Limit sell or limit buy). Analysis of most traders may agree leading them to buy or sell at the same time and at same particular point in the trade.
When many buy limit orders are initiated at the same time, price rebounds upwards within the area the buy limits are set leading to an uptrend. When many sell limit orders are triggered same time price falls downward. However these market psychology repeats severally leading to strong support or resistance.
A strong support happens due to much pending buy limit orders occuring at same level in a trade.( A buy limit order is a buy order placed below the current price position so that once price hit the target, it will be automatically executed).
As more traders continue buying than those selling, the price will continue upward leading to a defined uptrend.
Conversely, resistance levels occur due to much pending sell limit orders placed at a point by different traders. ( Sell limit order is a limit order set above the current price value so that the sell could be automatically executed when the price hit the target)When there are more sellers than buyers of an asset at a particular point in time, the price will definitely bounce downward leading to a downtrend.
Bottom line
Support level forms due to much pending buy orders at that level.
Resistance line occurs due to much pending sell orders.
•••
2•
Explain what a Gap is. (Required Screenshots) What happens in the market to cause It.
GAP.
Gap refers to a huge space occuring between the last closing candlestick of a price chart and the new one that was formed. Although gap seldom occurs, it has an important information for a trader.
Gap can occur due to low liquidity. When there were no much activity that took place within a previous period and the new forming period, gap can occur. The opposite is equally true.
Gap can indicate a huge buy or a huge sell. It can happen within an established trend or can occur as a mark to signal a new trend.
Depending on where it occurs, it can tell a trader to enter a trade or to exit.
Many people explain this as a whale movement. Whales trade with high volume of money, there purchase or sell in large quantity can shake the market to create the gap.
It is important to note however that huge investment with high volume can create a gap. It could be a rapid buy or sell occuring within a time frame larger than the previous, or it could be a high investors movement or a combination of both. This is equally the case on sell.
•••
3•
Explain the types of Gap (Screenshots required, it is not allowed to use the same images of the class)
Common gaps
These gaps are common as the name implies. It is a kind of gaps traders could likely see often. These gaps carry little information for a trader and the gap can easily be filled up. These gaps result as a low activity that occur between the last previous closing period and the present one.
Breakaway gaps
These gaps points to a trend gaining further momentum. It is gap that broke away from an already established line of support or resistance.
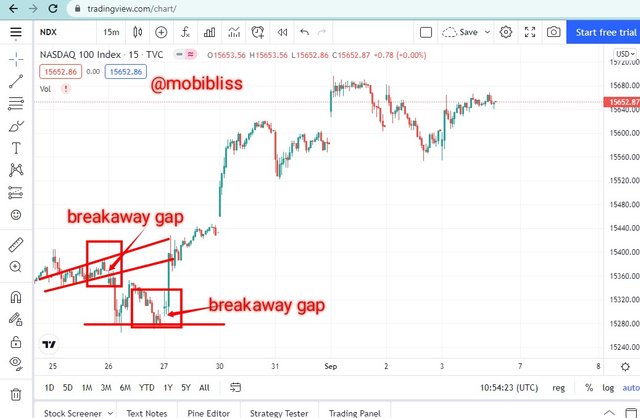
When break to resistance or support occurs with a gap, it shows that the trend is taking a new dimension and the gaps are likely not filled.
Runaway gaps
Runaway gaps shows a trend continuation. These gaps take place in the middle of an established trend. It implies a rush at which many traders plunge into the market.
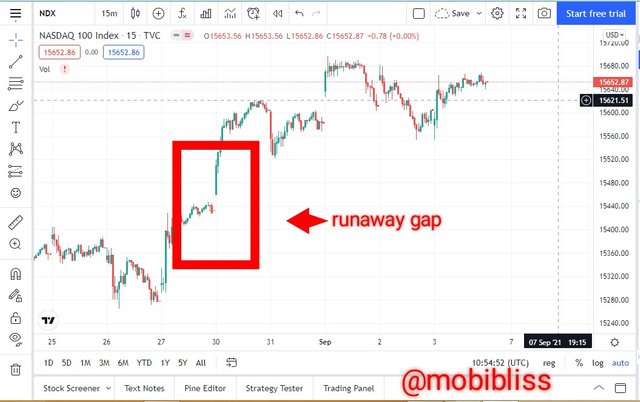
Runaway gaps happens mostly in the bullish trend. There is an established upward movement and gap continuation to the trend. This gap is likely not filled. Buyers here believe that the asset will do well and they made investments resulting to the gap.
Exhaustion gap
This gap occurs towards the end of a trend and before reversal. Sometimes this gap occurs towards the bullish trend end and bearish reversal. It is the gap caused by late buyers who bought due to euphoria or fear of missing out.
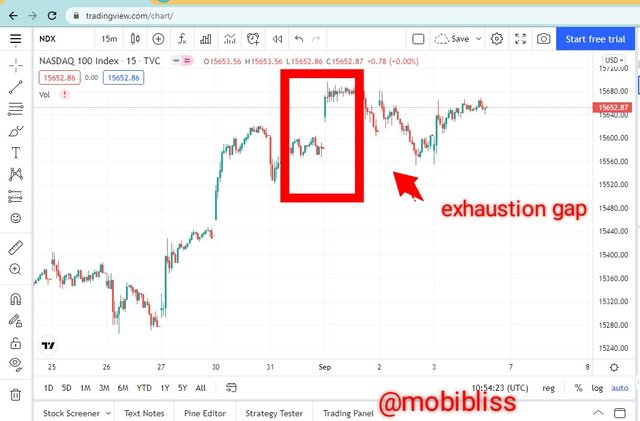
At other time it gaps towards the end caused by many late sellers who based on fear want to sell their position.
4•
Through a Demo account, perform the (buy/sell) through Strong Supports and resistances. Explain the procedure (Required Screenshots).
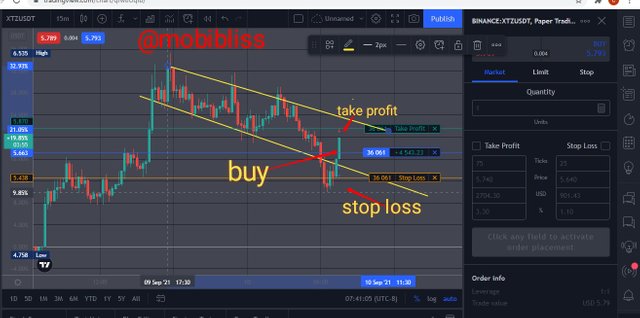
To trade with support and resistance, we need to first draw our support and resistance lines as done in the image below.
In the xztusdt chart below, we saw price respecting the support and resistance lines, however in the very one we traded, there was a breakout. Price chart broke support. What I usually do in this instance is to wait till price chart fall back to the area.
As we observed in the chart below, If we had entered trade at the the support, likely our trade could be cancelled by our stop loss order due to the break. That is why I recommend for the price to rise a bit in case of bullish reversals and for the price to lower a little in the case of bearish reversals before entering a trade.
In this trade I waited for the price to rebound and return above the support line before entering the trade.
Notice where I placed the stop loss or take profit levels.
Suggestions
- For more accuracy, do not just trade at the support or resistance levels. Wait a little to ensure that a reversal has actually occured. This is because, market can take a new turn after a breakout.
- Set stop loss a candle below the support as in the case above and vice versa.
- Enter trade at the next candle after a true reversal has occurred.
- Place stop loss before resistance levels (or support in case of bearish reversals).
- use 1:1 profit ratio or 1:2. You can configure that in the buy order section.
You may notice that I adjusted the ratio levels, this is for the chart to be clearer to a viewer.
5
Through a Demo account, perform the (buy/sell) through Gaps levels. Explain the procedure (Required Screenshots).
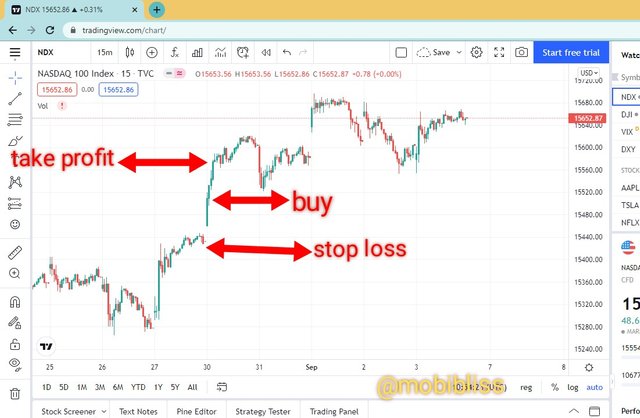
In this exercise, I will demonstrate how to trade gap using runaway gap.
As noted, runaway gap signals strong continuation. See image below.
Suggestions.
- Set stop loss at the previous closing period before the gap.
- Enter trade a candle after the gap.
- Use risk to reward ratio to determine your take profit.
CONCLUSION.
The beauty of support and resistance levels is to sport out reversals.
Trading on weak support or resistance may lead to inaccurate entry.
Gaps are useful for reversals and determining trend strength. Mastering gaps can lead to profitability.
As an added indicator, We can add Bollinger bands indicator for newbies learning how to trade with support and resistance
Please professor @allbert, please attend to my work sir
Downvoting a post can decrease pending rewards and make it less visible. Common reasons:
Submit
Come on man!!!.. you used the wrong tag... How could I find you? The right tag is #allbert-s4week1... You must be careful. You wrote #allbert-sw4eek2
Downvoting a post can decrease pending rewards and make it less visible. Common reasons:
Submit
Thank you, I will correct it
Downvoting a post can decrease pending rewards and make it less visible. Common reasons:
Submit
Please so sorry for the error, I have corrected it
Downvoting a post can decrease pending rewards and make it less visible. Common reasons:
Submit