INTRODUCTION
Among the very goal of using technical indicators in trading is to dictate market reversals, possible entry and exits, market trends and trend strength. These enable traders to know when and where to enter the market and when to exit. Predicting the market becomes easier using indicators.
Many technical indicators has been built to the effect of telling reversal points. RSI, Bollinger bands, random index, moving averages etc tends to identify trend direction and reversal points whereas indicators like ATR focuses on the trend strength.
A simply and more available tool for traders however is the heikin ashi candles.
What is heikin ashi candles and how can it be used in trading cryptocurrencies?
In this post, I am going to provide an answer to these questions following cryptoacademy intermediate homework post questions by professor @reddileep.
writing format
This post will respond to the task questions. The question will be quoted and answers will be provided beneath each enquiry.
use of image
Images on this post are produced by the author using tradingview.com
and iqoption trading app template.
style
I will favour simple words and basic tenses.
1
Define Heikin-Ashi Technique in your own words.

WHAT IS HEIKIN ASHI?
Heikin ashi is a candlestick pattern indicator that can be used by traders to establish price reversals, market trend and trend strength.
Simply put, heikin ashi is a candlestick pattern that works better in identifying trends and reversals when compared to traditional candlestick chart. By mere looking at just the chart, a trader is left with no confusion about what trend the chart of the tradable asset is in, and where the trend began. It is also very easy to spot out reversals.
It differs from the traditional candlestick patterns slightly in it's graphics and majorly on how the candles are formed.
Heikin ashi is gotten by obtaining the smoothed average of the previous price data plus the current data. The candles do not just open where the previous candles "close" stops like in the traditional candlestick but the new candle's "open" is the average of the previous price data data connected to the present.
In Japanese the word "heikin ashi" means average bar, which means that the average is what is considered.
The heikin ashi is very much accessible and available on almost every broker or trading platform just like the traditional candlestick, the line graph and the bars.
ADDING HEIKIN ASHI TO CHART.
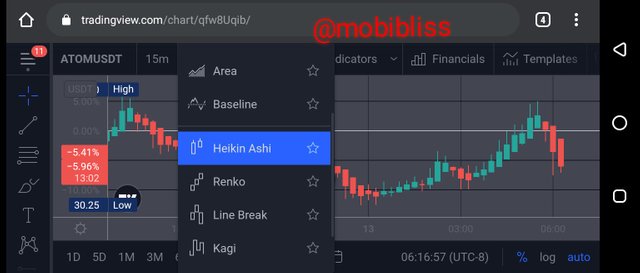
Adding heikin ashi is like adding any other chart pattern. Goto chart patterns button, choose heikin ashi from the list.
Tadingview.com sample
Goto tradingview.com, goto charts on the charts goto chart patterns button as shown below.
Fig.1 heikin ashi tradingview.com
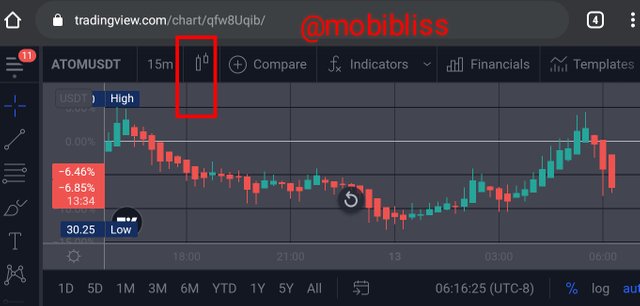
Fig 2. Heikin ashi. Tradingview.com
•••
COMPONENTS.
Fig 3. Heikin ashi. Iqoption.
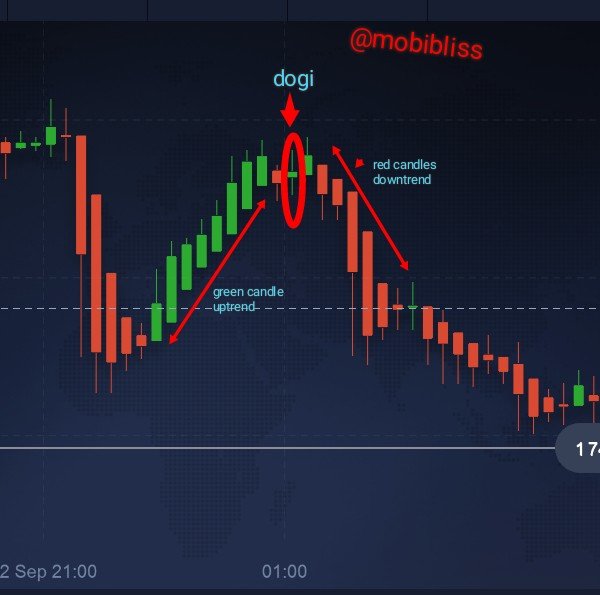
Red candles
Red candles signifies a downtrend.
Green candles.
Green candles signifies uptrend.
dogi
Dojj can be red or green. Doji represents indicisive movement. It can mark a harbinger of a new trend.
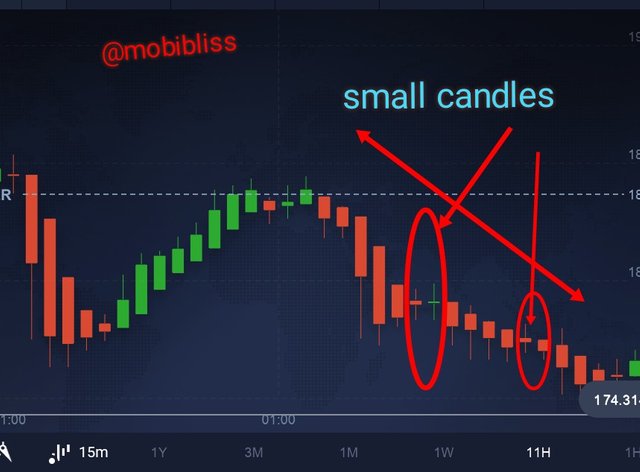
Small candles
Small candles signifies a strong pause or a trend reversal.
Fig 4. Heikin ashi. Iqoption.
2•
Make your own research and differentiate between the traditional candlestick chart and the Heikin-Ashi chart. (Screenshots required from both chart patterns)

The difference between the two chart patterns can be observed by mere looking at them. Other differences are rather hidden due to differing functions. See fig 5. and fig. 6.
Fig 5.
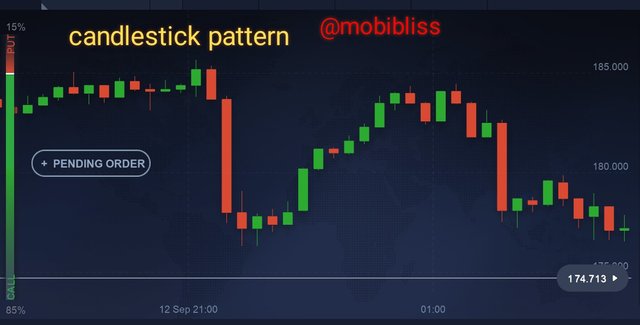
Candlestick chart pattern. Iqoption.
Fig 6.
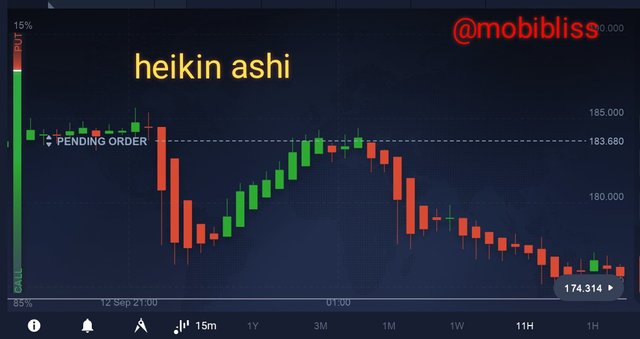
Heikin ashi chart pattern. Iqoption.
One difference between the traditional candle and heikin ashi is the procession of the candles. In the traditional candlestick, one can see differing candle colours in-between, such are hardly seen in the heikin ashi.
In traditional candlestick patterns, any little different change in price movement is observed, whereas in heikin ashi such are smoothed over.
A major difference in the heikin ashi and traditional candlestick is how a new candle is formed. While traditional candle is gotten by taking into account the previous close,high,low and open, heikin ashi considers these too but in a modified manner. It is the averages of previous data connected to the present.
Price chart in the traditional candlestick represents the actual price of the tradable asset whereas in heikin ashi, the record is different because it is the average value that is considered.
Reversal in the heikin ashi are easier to spot out when compared to traditional candlestick patterns.
Gap pattern are formed in the traditional candlestick but not present in the heikin ashi.
| Candlestick | heikin ashi |
|---|---|
| Observes minor price changes | smooths out minor price changes |
| Not easy to spot out reversals | easy to spot out reversals |
| Actual asset price | different from actual asset price |
| Makes use of asset close, high, low and open | obtained by previous average data + present |
| All trade patterns are available | some patterns like gaps are missing. |
| Requires more technical know-how to understand | easier and simpler even for newbies |
3
Explain the Heikin-Ashi Formula. (In addition to simply stating the formula, you should provide a clear explanation about the calculation)

Just like the traditional candlestick pattern, price high, low closing and open are always taken into consideration. The difference with the heikin ashi is that it obtains data from previous candle.
To calculate heikin ashi therefore, we need to work with some formula to get the open, the close, the high and the low of the current candle.
Heikin ashi open To get the heikin ashi "open" we need to get the open of the previous candle, add it to the close of the previous candle and divide it by 2.
HA open = previous candle close +previous candle open/2
**Heikin ashi "close". To get the current candle close of the heikin ashi, we need to sum the open, the close, the high and the low of the current candle and divide it by 4
HA close = current candle open + close + high + low/4
Heikin ashi high. The heikin ashi high represents the maximum value from the current period open, close and high.
HA high = maximum value of current high, open and close.
Heikin ashi low. The heikin ashi low is the current periods lowest value, obtain by the minimum value of the current period open, low, or high.
4
Graphically explain trends and buying opportunities through Heikin-Ashi Candles. (Screenshots required)

USING HEIKIN ASHI CANDLES TO IDENTIFY TREND.
BULLISH / BEARISH TREND
Bullish trend is marked by successive green candles usually moving upwards. In the presents of these many candles, a trader will be alert to trade buy.
Bearish trend is identified by many red candles. The direction of the movement of these candles are downwards. Once the red candle movement are established, a trader is poised to trade sell.
STRONG TRENDS.
In heikin ashi, identifying strong trends are easy. When a trend begins and consists of longer candles , it gives evidence that the trend is strong and will likely continue. Traders therefore has more confidence to enter the trade.
Fig 7. Long candles.

Now let's take a look at the image below. In the image I will show trend and how to buy and sell using heikin ashi.
Fig 8.
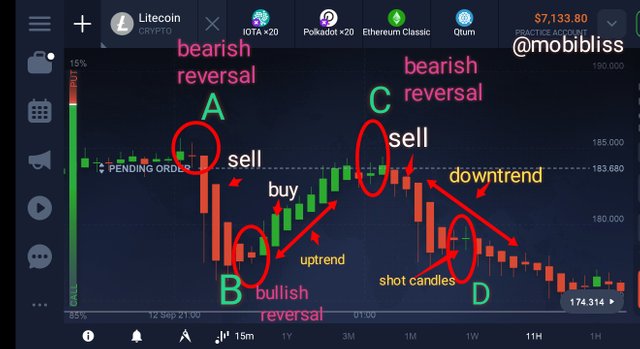
In the image above, point A is a bearish reversal, the dogi was a harbinger of the reversal. We notice long red candles afterward, which is an indication of a strong trend. Although it is a long candle which signifies strong trend, it is often best to place the trade at the second candle.
point B is a bullish reversal. We may notice same dogi candle following after the red candles then green candles ensued leading to an established upward movement. I indicated a buy at the second green candle after the dogi.
PointC is a bearish reversal. I indicated a "sell" at the second red candle after the dogi. The candle indicates that a bearish trend has begun.
Point D shows short dogi but did not indicate a reversal. This can be a problem for inpatient traders who hurries to trade at the site of a dogi.
Bottom line
- An established upward or downward movement is noticed by many candles in a roll.
- A dogi indicates a pause in the trend. It can lead to reversal or it can just be a pause. It is best to wait for two or more candles before entering a trade.
- Trade in the movement of the trend. It is not advisable to place a trade with the hope that reversal is imminent.
- Place a trade when the trend has been established.
- An asset opening with a long candle can give you confidence that a strong trend is about.
Trading with heikin ashi may appear simple but it requires some mastering. Patience is needed by a trader so as not to enter a trade prematurely.
It is important to add stop losses like the trailing loss stop, this is important because it will aid in minimizing losses.
5
Is it possible to transact only with signals received using the Heikin-Ashi Technique? Explain the reasons for your answer.

A trader may rely solely on candle chart pattern like the heikin ashi. With good mastering a trader could trade without any further indicator. So the answer is yes! it is possible to transact using only the heikin ashi candles.
Meanwhile, transacting with only the heikin ashi indicator is not advisable, adding other indicators has proven to be more effective. This is because, no indicator is 100% perfect and secondly no indicator despite how good can predict the future accurately.
Traders have combined two or more indicators for more accurate prediction.
6
By using a Demo account, perform both Buy and Sell orders using Heikin-Ashi+ 55 EMA+21 EMA.
HEIKIN ASHI STRATEGY.
Heikin ashi is similar to the traditional candlestick. Indicators can be applied to it to form a trading strategy.
In this exercise, I will use the moving averages strategy with heikin ashi. The strategy will require 2 exponential moving averages. I will add the period of 21 and the period of 55.
Adding the moving averages.
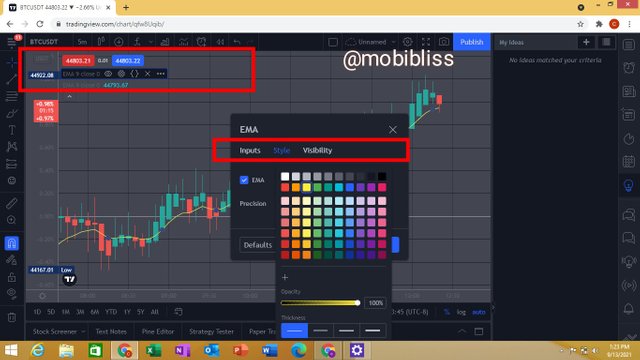
In tradingview.com, goto indicator icon and add EMA.
Fig 9.
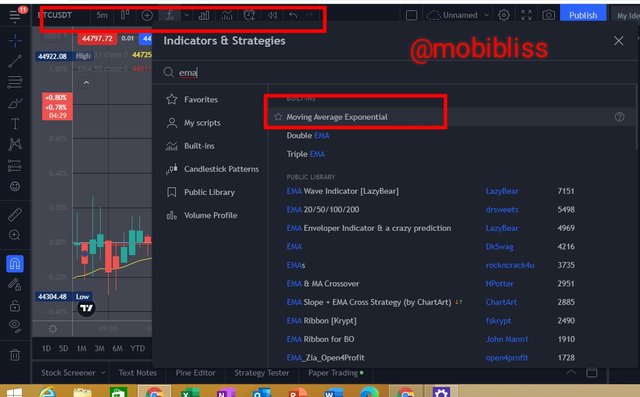
Once added edit it to desired settings. In this case we are adding 2, the period of 21 and 55.
In the input, add the periods, in the style, change the colour as desired, keep the visibility to default.
Fig 10.
HOW THE STRATEGY WORKS.
Determining trend
When the EMA moving averages Ema 21 and Ema 55 moves below the price chart, it indicates an uptrend. Conversely, when the 2 Ema moves above the price chart, it indicates a downward trend.
Determining buy signal
At the point of the 2 two EMA move from up to down, a trader can enter "buy". Patience need to be exercise to allow the two lines of the Ema move from above to below before the buy order can be initiated.
When the two lines of the ema cross while the price chart is above, a trader can take a long buy.
Determining sell signal
The opposite is true for sell signals.
The two ema line need to move above the price chart.
A cross of the two ema while price chart is below it signifies a long sell.
Take a look at the image below.
Fig 11.
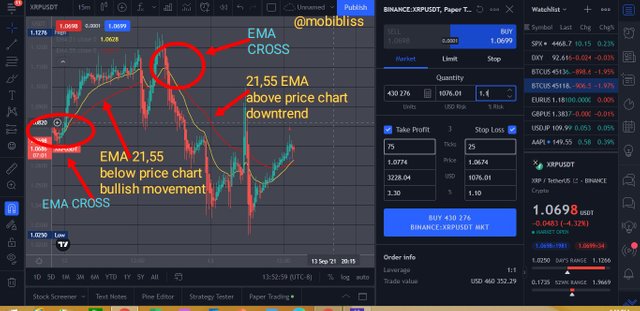
In the image above, we saw a clear picture of what we are talking about. Ema above price chart and we have downtrend. Ema below price chart and we have uptrend.
Cross of the the 21 and 55 ema while price chart is below indicates long sell. Cross of the 21 and 55 ema while price chart is above inndicatws long buy.
In the two images below, I will enter the trades at the first signal. At the point the 2 ema move above the price charts and vice versa.
Stop loss and take profit is configured automatically using 1:2rism to reward ratio, 25% stop loss and 75% take profit.
Buy trade
Fig 12. Icpusdt. Buy signal. Tradingview.com
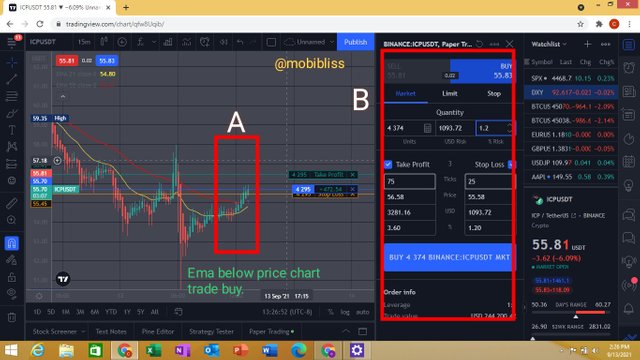
At point A, observe that the two lines of the ema are below the price chart. At point B I used the inbuilt setup.
Sell trade
Fig 13. Xtxusdt. Sell trade. Tradingview.com
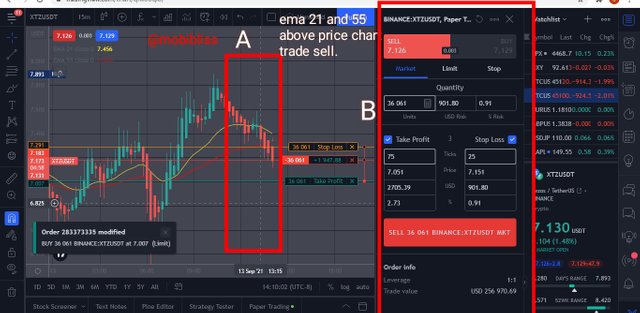
Notice at point A there were an actual cross of the two ema moving from below to above.
CONCLUSION.
Heikin ashi candles works so well in establishing trend, spotting out reversals in price chart and identifying trend strength.
Heikin ashi has many benefits above traditional candlestick which includes it's ease to read the charts. However due to the smoothing mechanism, it omits useful information like gaps.
Heikin ashi with good mastering can be used alone yet adding other indicators works better.
Just like traditional candles, a lot of strategies can be implemented to help a trader become profitable. The use of moving averages is one such strategy.
Thank you for reading through.