(1) What is a HODL wave, how do you calculate the age of a coin(BTC, LTC) in a UTXO accounting structure? How do you interpret a HODL wave in Bull cycles?
Before coming to HODL Wave, We should know the meaning of HODL. HODL is a word used for holding the asset in crypto. HODL Wave is formed when a large amount of Bitcoin will tend to make a progressive high.
HODL Wave is formed when most of the traders or people are holding their coin. They are not selling their coin, as a result there will be minimum supply and hence, It will results in a bullish move and then We can see a HODL Wave.
When People Hold their coin, then there will be less Circulating Supply and There will be only maximum number of buying as compared to selling and hence it results in forming a HODL Wave and It also increases high price of the coin.
How to Calculate the age of a Coin (BTC, LTC) in a UTXO accounting structure?
We cannot Calculate the age of a coin from the date of it's mining but We can Calculate the age of a coin from it's transactions or Transfer from one Account to another by the help of UTXO accounting structure.
Like suppose I have mined 0.5 Ethereum on 7th September and I have transferred it on 9 th September from one Account to another. Then We can Calculate it's age from 9th September as It was transferred on 9th September.
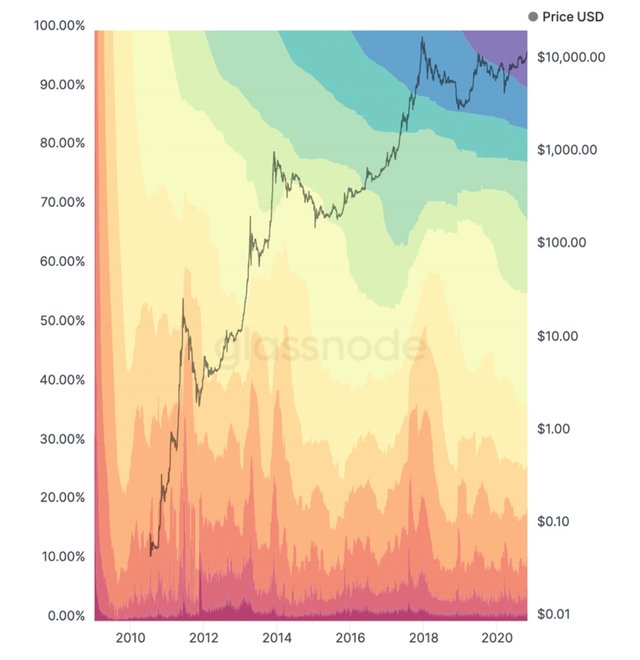
As per the above image, We can check the age of Bitcoin by checking the colour. This is the chart of Bitcoin by UTXO Age Distribution. There are many colours. This is a Year vs Price graph.
There are some colours in the graph. There is dark red colour in below and Purple colour on the upper side. Below side colours represent that these BTCs have been recently transacted whereas Upper side colours represent that these BTCs have not been transacted from a long time.
Below side colours represent the age is less like 24hours to 6 months as Dark Red colour represent age of 24hour, Orange Colour represents age of 1 week
Similarly, Purple colour represent age of more than 10 years, Blue colour represent age of 7years to 10 years. You can see the image for each colour age group.
How do you interpret a HODL Wave in Bull Cycles?
We can identify HODL wave in a Bull Cycle. Let me show you by a chart in UTXO structure.
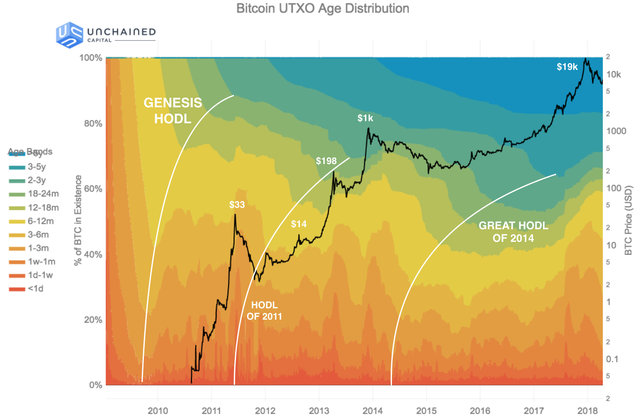
This is BTC UTXO Age Distribution Chart. In this Chart, We can easily identify HODL wave. There are 3 HODL wave in this chart. Genesis HODL, HODL of 2011 and Great HODL of 2014. There are curves which represents all these HODL waves.
Let's discuss about each of this HODL -
• Genesis HODL - This HODL is from the starting of Bitcoin. Bitcoin was first appeared in 2009. Actually, At that time, Minimum number of people knew about Bitcoin and there was also none exchanges at that time so that People can buy/sell their assets and as a result, No one will be able to Transfer their bitcoin due to lack of exchange and hence it becomes a HODL.
• HODL of 2011 - In 2011, Bitcoin was reached to some number of people but No one was fully aware about Bitcoin. At that time, there were some contest in which people can win bitcoin.
So, Some people has bitcoin but mostly have not sold their bitcoin as almost every person has hold their assets and as a result, It formed a HODL wave.
• HODL of 2014 - In 2014, Bitcoin has a descent value of around 1000$. It's value has increased in these days. It was becoming popular at that time. As a result, Everyone wants to buy bitcoin as After buying, They hold their assets for a long time which is our Great HODL of 2014.
(2) Consider the on-chain metrics-- Daily Active Addresses, Transaction Volume, NVT, Exchange Flow Balance & Supply on Exchanges as a percentage of Total Supply, etc, from any reliable source(Santiment, Coinmetrics, etc), and create a fundamental analysis model for any crypto[create a model for both short-term(up to 3 months) & long-term(more than a year) & compare] and determine the price trend (or correlate the data with the price trend)w.r.t. the on-chain metrics? Examples/Analysis/Screenshot?
I will be doing fundamental analysis of BTC by all the On-chain metrics from Coinmetrics
Daily Active Addresses
Daily Active addresses are the addresses which are the active one. It also varies with price of that crypto asset.

We can see that there is a lot of changes in price of BTC day by day or monthly. There are also many active addresses increasing or decreasing with time.
Let me correlate it with both Short term and Long term.
For Short Term- In Short term time period like 1 month, there is a very difference in price and also in active addresses. We can see up and down of a price movement and increment and decrement in Daily active addresses.
For Long Term- In long term like 1 year, The price will surely increase. The Number of Active will surely change.
As we can see in the above image, there were around 1.14 million active addresses in March and then it reduces to around 900k in September.
Transaction Volume
Transaction volume means total number of volume processed in the time interval. Total number of volume has transacted and it will vary with price of that crypto asset.
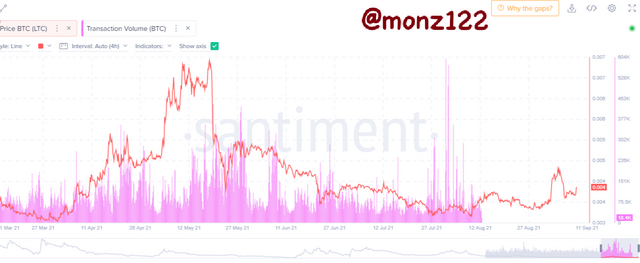
There is made thousands of transactions in a day. So there is so much volume made in a day.
For Short term- In small time interval like 1 month, there can be high transaction of volume made with variation of price of crypto.
For long term- In time interval like 1 year, the volume transaction is much much higher. And It will always increase as there are many volume transactions made in a day.
NVT
It will show the NVT ratio with transaction volume in the graph with the variation of price of crypto asset. NVT is obtained by dividing the network value by Transaction value.
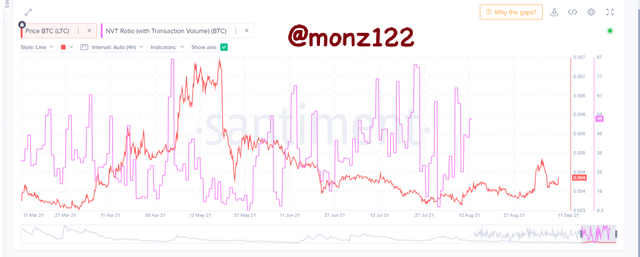
For Short term- As seen in the above chart, Its price sometimes increase and then decrease.
For long term- It will follow some steps like first increasing then decreasing. It will not generally only increase.
Exchange Flow Balance
Exchange Flow Balance means how much amount of assets flow from one exchange to another exchange.
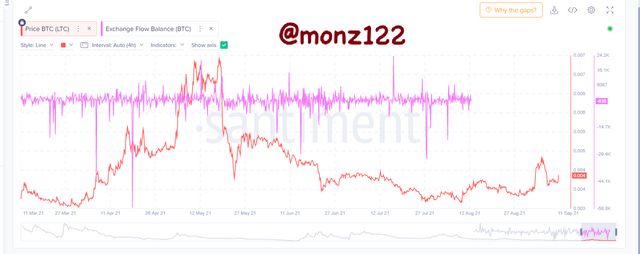
For short term- It is Mainly remains in accumulating area. Sometimes when, high volume of flows from exchange then it makes dump.
Long term- same for long term, mainly remains in accumulating area.
Supply on Exchanges
It is the Circulating Supply which remains active on exchange. It kept changing. Let's take a view on chart of this Onchain metrics.
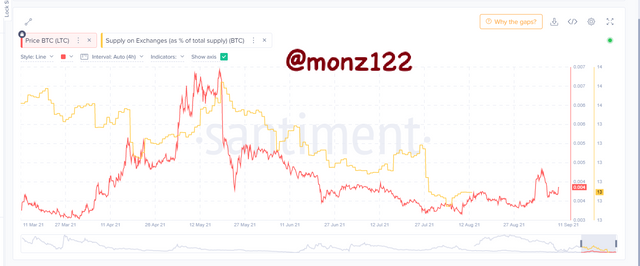
For Short term- It varies with price of crypto asset. As we can see in the above image, When btc increase, supply is increasing and when price decreases, supply decreses.
For long term- Well, In long term like more than 1 years, Price mainly increases of Crypto asset so we can consider that Supply will also be increases.
(3) Are the on-chain metrics that you have chosen helpful for short-term or medium-term or long term(or all)? Are they explicit w.r.t price action? What are its limitations? Examples/Screenshot?
I think On-chain Metrics are helpful for long term. As We cannot get proper orientation or graph from that chart for short term. There is very high volatility in short term charts for all on chain metrics.
We can get enough proper data if we look at the long term charts for these on chain metrics. We can look the NVT, Exchange Flow Balance, Supply on Exchanges for long term in a clear wat and thus, We can summarize proper data and hence it will be best applicable for long term.
I think it explicit with respect to price Action as We can see in the chart of Supply on Exchanges, Supply also decreases when there is price decreasing and supply increase when price increases.
It's limitation can be that We cannot use it for very short term trade like in day Trading. This is only helpful for long term trades. It is helpful in trades more than 1 year time interval.
Thank You Professor @sapwood for providing this wonderful lecture in crypto Academy.
