Assalamualaikum,
Hello and welcome fellow steemians to my post. I am good and healthy and I hope so that you all are also good. Today I am posting again in @cryptoacademy. I hope that you all will like it and give some of your precious time to give it a read.
I have read the assignment given by Professor @kouba01. He has very enormously described all the aspects and uses of the William Percent Range indicator and I am looking forward to giving my best in this homework post. So, let's get started.

We are now in season 4 of the @cryptoacademy and along with many topics, we have a constant topic for trading via indicators and I can say that through the @cryptoacademy initiative I am now able to study and understand the language of indicators to an extent.
Today, in this homework post I will discuss and describe the William Percent Range indicator and also shed light on different processes to use it.

Explain the Williams %R indicator by introducing how it is calculated, how it works? And what is the best setting? With justification for your choice.
William Percent Range Indicator or William %R or WRP is developed by Larry William. This indicator is a type of momentum indicator just like RSI and Moving averages or MACD indicator. This momentum indicator shows the overbought and oversold signals for better trading and till date it is very efficient and fast forward in providing the answers. WRP shows the price convergence in market from high to low and unlike RSI it shows values between 0 to -100.
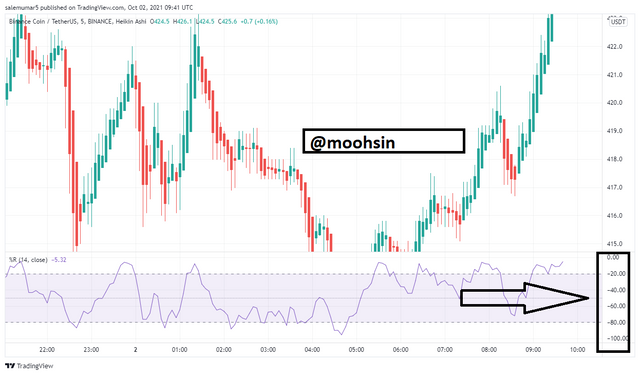
- All the prices shown between -20 to -80 are in intermediate zone whereas, from0 to -20 are considered as Overbought and prices between -100 to -80 are considered as Oversold regions.

The formula derived by Larry William is as follows,
- This formula seems to be quite difficult but in simplified words it is real easy.
%R = [Highest High(N days) - Most Recent Close}/{Highest High(N days )- Lowest Low (N days)] x -100
N days describes the number of days in which oscillator is working. It can be of any time frame depends upon the feasibility of the trader.
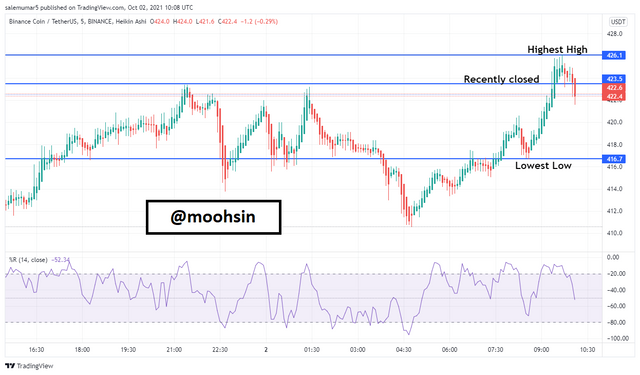
For Calculation
Highest High = 426.1
Lowest Low = 416.7
Recently closed= 423.5
%R = [426.1(14 days) - 423.5}/{426.1(14 days )-416.7 (14 days)] x -100
%R = 0.27659574468 x -100
%R = -27.65
The value of WRP is -27 which shows that price is fall from overbought region and now trader have to make a choice either to run with it or sell it.

- First we have to search Tradingview or any other trading site on our search bar.
- I have used Tradingview to depict my answer.
- After the main page of trading view open up, go to the charts section and take any of the cryptocurrency.
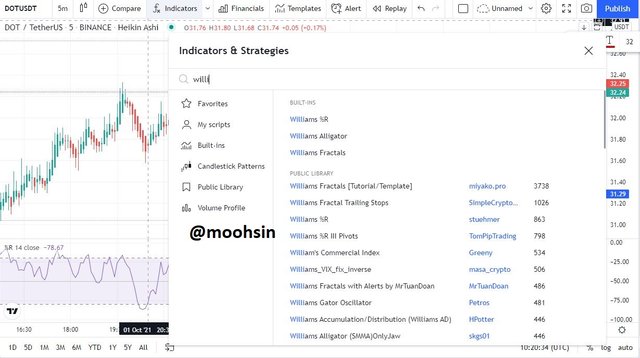
- Then Click on fx Indicators bar and a screen will pop up.
- In that Screen type William % R and you can see that the name of indicator appears, Click on it.
- Then Indicator will open below your chart.
- In order to open settings, took your cursor on top left of indicator section then you will see a setting option, Click on it and settings will open where you can set the input of time frame.
- My settings are set on default which is of 14 days time frame.
- You can also select the style of line, I have my settings set as default.
- You can also set the seconds, minutes, hours and days of your time frame in visibility section.

- As far as concerned to myself I usually use default settings in many indicators but if someone changes it, this can be justifiable because many people uses very short or very long trading strategy and so they can set according to it. But a positive point is that when we use short timeframe we can be able to get changing signals more rapidly which mean that we can be able to know about the change of trend and make our decisions early, however, in longer periods we have to face many difficulties regarding trend movement.

How do you interpret overbought and oversold signals with The Williams %R when trading cryptocurrencies? (screenshot required)
As we have discussed earlier that the oscillator moves between 0 to -100 which means that it also drive us through overbought and oversold regions. When the price of any commodity is between 0 to -20 that means that the price is in overbought region and it is likely to be fall. Similarly, when the price is in between -80 to -100 it means that price is in oversold region and it will go to a uptrend. I shall discuss this further in more depth below,
OVERBOUGHT
Overbought means that the price of the commodity has now reached on its highest point and likely to go on a downtrend. At this point the trader has to sell and took his maximum profit.
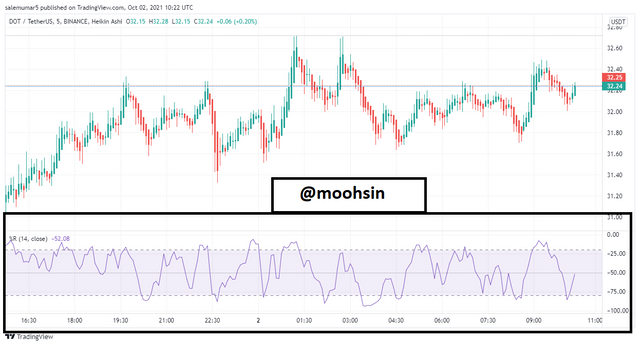
In the William % Range indicator price is considered as overbought when it is between 0 to -20 and in below chart you can see many points where price of commodity reached overbought region and then fall. This indicator exactly shows every point very clearly which shows the accuracy of the indicator.
OVERSOLD
Oversold means that the price of commodity reached to its lowest point and it is the time when trader have to enter the market because after that point market will likely to take uptrend approach.
In below chart I have highlighted many strong oversold regions after which market caught bullish trend. At that point the price of commodity is between -80 to -100. The trader have to enter the market at this point to gain profit.
At the end of indicator's chart we can see that the price of commodity is continuously in oversold region and cannot able to get through it. but it recently break the curse and fast forward towards the overbought region , this is no doubt a very best time to invest in this commodity to get benefit.

What are "failure swings" and how do you define it using The Williams %R? (screenshot required)
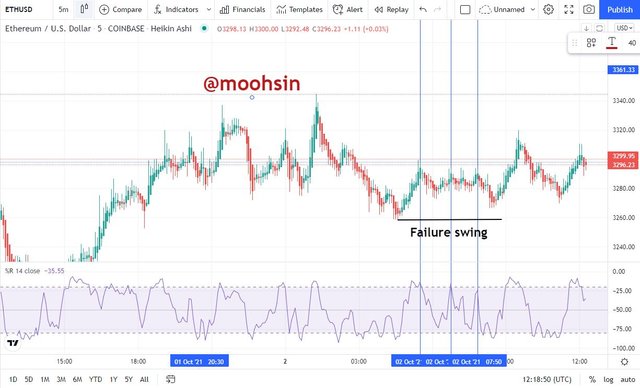
- Failure swing is caused by the low momentum or low trend in the oscillator which means that after a high rate of purchase/sale when market decided to move in other trend but after a while this trend became low due to insufficient amount of trade.
- As you can see below that after overbought region the price of commodity started a downtrend but very near to dangerous line the price got a reversal in trend and it wasn't able to get into the oversold region. After reaching near -20 line it again started to fall which shows that the reversal of trend had not sufficient amount of trade.
- In between these three lines the indicator gave us the buy signal two times when it reached near -80 line but wasn't able to cross it.
How to use bearish and bullish divergence with the Williams %R indicator? What are its main conclusions? (screenshot required)

Divergence
Divergence occurs when indicators line and price chart moving oppositely like if one is following an uptrend but the other follows a downtrend. Divergences help to indicate reversal of trend earlier than started.
Divergences are of two types,
(1) Bullish.
(2) Bearish.
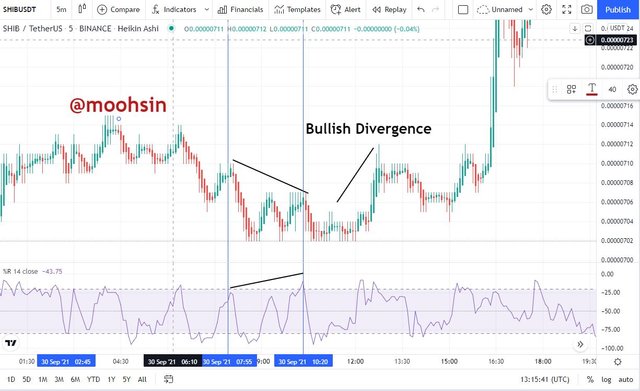
- In Bullish divergence, the price of asset is closing towards lower-lows but indicator shows it as the lower highs. This means that the upcoming trend is most probably be the bullish trend.
- In the above chart of SHIBUSDT, the priceof asset is falling but WPR indicator indicate a upper movement which gives us the prediction of trend reversal and you can see that the price started to rose up after that and it is the best time to take an entry in the market.
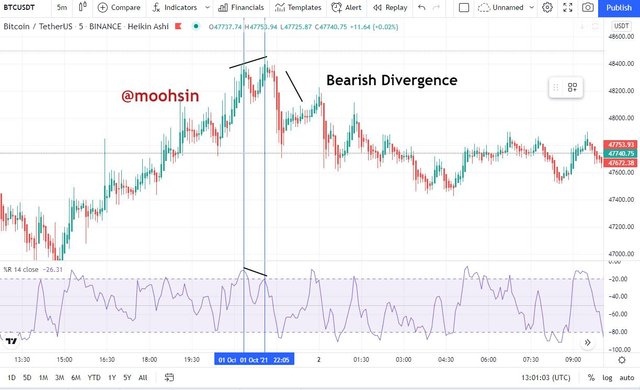
Bearish Divergence predicts the potential downtrend when price of asset is moving in an upward direction following a strong bull. In this divergence indicator shows the direction of trend downtrend while the price movement in chart is upward. This difference is the actual definition of bullish trend and traders have to sell their asset and exit the market with handsome profit.
In the above chart of BTCUSDT we can see that the price is moving from lower-high to higher-high whereas in William indicator the price moving from higher -high to lower-high which indicates that a trend reversal is likely to occur and it can be seen clearly that the price of asset starting to fall after that so the trader have to sell the commodities and back out from the trade.

How do you spot a trend using Williams %R? How are false signals filtered? (screenshot required)
William % Range indicator is quite helpful with trend settings because it shows the movement very rapidly and we know that price between -20 and -80 are in intermediate position.
When price of the asset is above -50, it means that a bullish trend is going on and traders have to take entry to make profits from it.
When the price is below -50, this means that it will follow a bearish trend and it is likely to touch the oversold region so it is better to get an entry when the price is in oversold region.
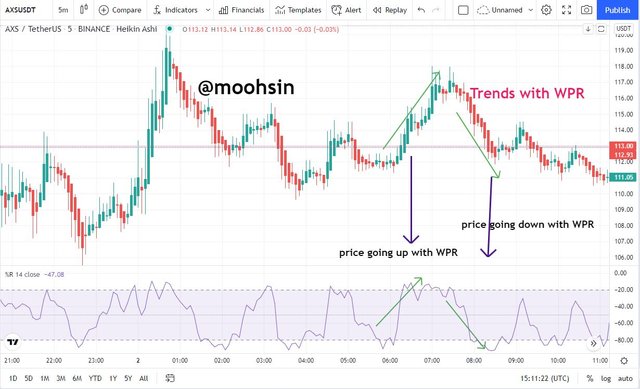
- We can easily spot different trends through WPR and an example is shown below in which the price of AXS coin is following an uptrend and with it WPR also shows an uptrend and similarly ahead , the value of AXS is started decreasing so did WPR shows a bearish trend.
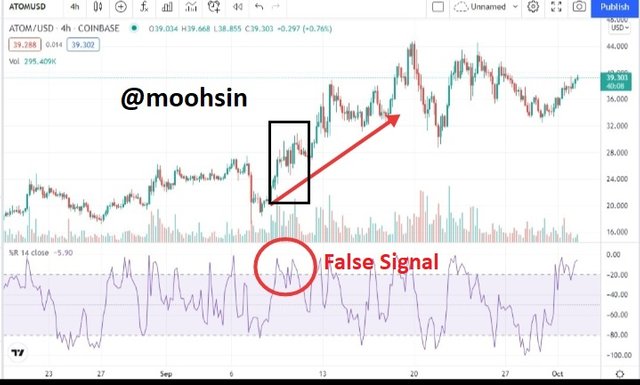
- False signals are the one in which the indicators shows a change in trend but it will nor occur. For example, if any indicator indicates that the price of the asset will going to increase because the price going above the dangerous region and leaving oversold region but after 5 or 6 candles the price is continuously falls this means that your indicator has brought a false signal. Let's take a quick run on a example of ATOM coin,
- In the red circle area, we can see that the price is in overbought situation and overbought situation told us that the price of this asset will going to fall but in this case it can be clearly seen that the price have not fallen at all but instead of it, it took strong bull so those traders who has only used WPR for signal have to face a loss because they exited the market after watching a short term change of trend. That is why it is recommended to use any indicator with a pair so that you can filter the false signals.
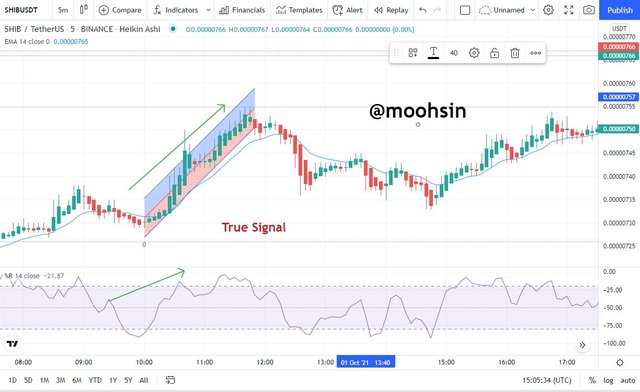
- WPR indicator in the above chart of SHIB/USDT shows the price of asset in oversold region and then WPr indicator started to move towards -80 line which means that the price of asset will rise. In order to get the rightest result I also open EMA and set it at 14 timeframe.
- When the price started moving up EMA also support the movement which means that it will become the highest buying point. EMA also makes an important support there which follows till the very next break.

Use the chart of any pair (eg STEEM/USDT) to present the various signals from the Williams %R indicator.
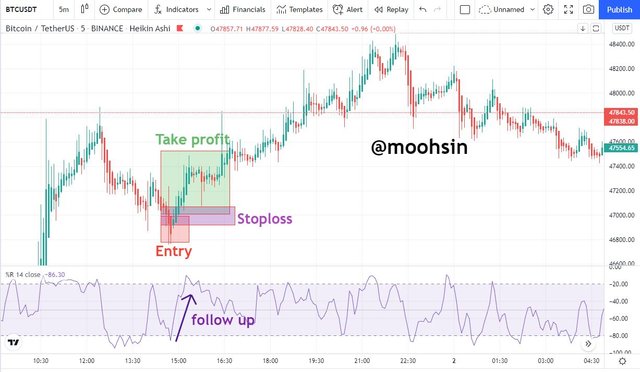
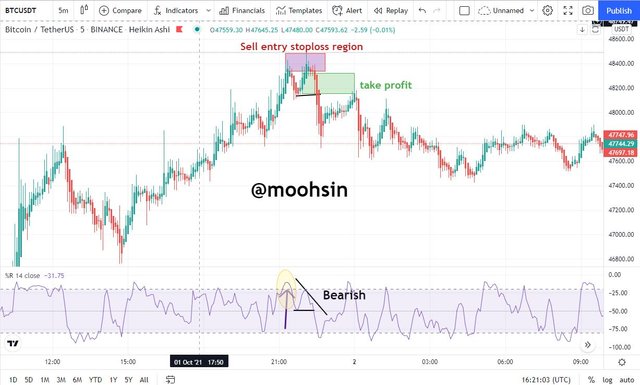
- I have chosen BTC/USDT pair to present signals using WPR indicator.
- I have set 5minute timeframe for trading chart as it is a short term trade or scalping which I really like.
- As discussed earlier that after crossing above -80 line of WPR, bullish trend started to follow so as I have seen the uptrend line I decided to get enter into the trade and I set up my stop loss near 47000$ line but the bullish trend is too much strong which means there are too many traders in the market .
- A thing to remember that I only used WPR here because we have to check the authenticity of the indicator and as we follow the direction of indicator it follows up to the overbought region so that's the area where trader get much profit. So after buying it in a profitable zone we wait for it to reach the oversold region.
- When the price of asset reached overbought region, WPR clearly indicate a reversal of trend, however it seems to loose its grip a bit in early stage but then it started to take control of the situation and a bearish trend starts.
- When it breaks the black line it became clear that the market will fall and trders started leaving market and due to the less volatility in market I also took my profit and leave market.

Till now we have go through many indicators which helps us in increasing our understanding with trading. William Percent Range indicator is however very much functional and respondent towards the sudden price movement just like RSI and other momentum based indicators.
Through this lecture, we now have a more clear understanding with WPR and its very helpful aspects like overbought and oversold positions are now more exposed and we can now better follow bearish and bullish divergences. One of the key factor is filtering false signals, through WPR paired with a moving average we can now more efficiently filter those signals and make our trading more accurate.

In the end, I want to thank @kouba01 for this useful and in-depth knowledgeful lecture about William Percent Range Indicator and also thankful to @cryptoacademy for this amazing series of courses.




Hello @masumrbd,
Thank you for participating in the 4th Week Crypto Course in its 4th season and for your efforts to complete the suggested tasks, you deserve a Total|9/10 rating, according to the following scale:
My review :
Excellent content in which you were able to answer all the questions related to the WPR indicator with a clear methodology and depth of analysis which is a testament to the outstanding research work you have done.
Thanks again for your effort, and we look forward to reading your next work.
Sincerely,@kouba01
Downvoting a post can decrease pending rewards and make it less visible. Common reasons:
Submit