
QUESTION NO:1
Define Heikin-Ashi Technique in your own words.
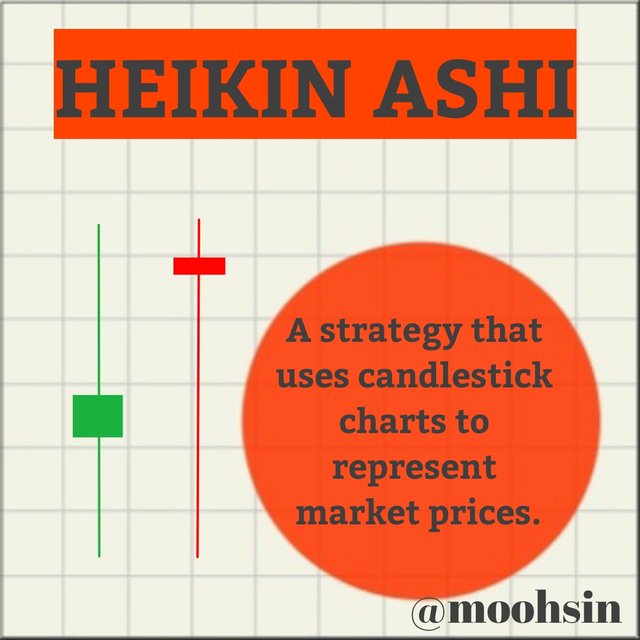
Heikin-Ashi is like any other trading indicator or tool, it uses candlestick charts that represent market price. It helps in forecasting market prices and market trends. Compared with the traditional candlestick, Heikin- Ashi helps to eliminate noise giving the chart a cleaner look. This also helps in the proper identification of market trends as it helps in giving signals to the user as to retain a trade or not. Thus, they can secure themselves from losses and even make a profit.
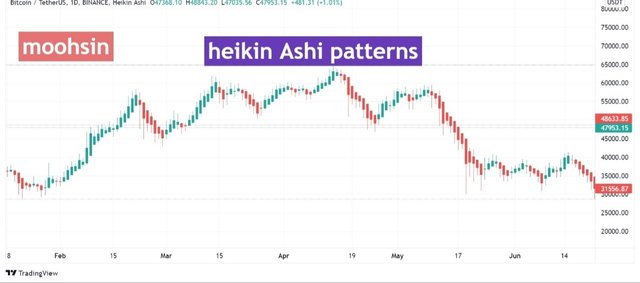
Heikin-Ashi means ‘average bar’ in Japanese. Lets explore it in chart below

QUESTION NO:2
Make your research and differentiate between the traditional candlestick chart and the Heikin-Ashi chart. (Screenshots required from both chart patterns)
By comparing Heikin-Ashi candlesticks and the traditional candlestick side by side, we can easily identify the following distinctions between the two: -
The smooth and clean look makes it easier for new traders to understand it better compared to the traditional candlestick chart, thus making Heikin-Ashi candlestick easier to identify the market trends and pattern.
The opening of Heikin-Ashi is mathematically formulated by adding the opening and closing of the previous candle and then dividing it by 2 (average between the opening and closing of the previous candle). Whereas in the traditional candlestick, the closing of the previous candlestick becomes the opening of the next one.
In traditional candlestick there is no adjustment done to the data displayed on the chart. The plain display of movement of price thus leads to the display of noise. However, in Heikin-Ashi, the data is meticulously calculated or formulated mathematically, which leads to the adjustment to the data shown over the chart. The noise elimination in Heikin-Ashi charts makes it easier for traders.
The color of the candlestick changes frequently in the traditional candlestick, whereas in Heikin-Ashi the color of the candlestick changes only when the trend is easily identifiable.

QUESTION NO:3
Explain the Heikin-Ashi Formula. (In addition to simply stating the formula, you should provide a clear explanation about the calculation)
We already know that Heiken-Ashi candlesticks use 4 types of data to create current candlesticks in a chart.
Open
Close
High
Low
In Heikin-Ashi, we use 4 types of data to create the whole chart that shows the candlesticks: -
- Opening of a candle: -
The formula used to find opening is formulated in a way that amazingly links the candle with its successors.
(Open of a previous candle + close of a previous candle)/2
Or
Average of the previous candle.
- Closing of a candle: -
For closing, we simply find the sum between opening, closing, high and low, and then we simply divide it by 4.
(Open + Close + High + Low of current candle)/4
- High of a candle: -
To calculate the value of high we simply find the maximum value from either high, open, or close of the current candle.
Maximum (High, Open, Close) of the current candle
- Low of a candle: -
To calculate the value of low in Heikin-Ashi, we simply find the lowest or minimum between the low, opening, and closing of the current candle.
Minimum (Low, Open, Close) of the current candle

QUESTION NO:4
Graphically explain trends and buying opportunities through Heikin-Ashi Candles. (Screenshots required)
The trends in Heikin-Ashi candlestick charts are pretty easy to spot compared with traditional candlesticks charts. If we closely look at the candles, we can see the wick, which helps us predetermine the trends that follow.
Heikin-Ashi charts are used as an indicator to help clarify the current trend. There are primarily 5 signals that help explain the trends and buying opportunities. They are as follows: -
- Uptrend: -
It is represented as a green candle, and it is the beginning of an uptrend and the prices are going to rise.
- Strong Uptrend: -
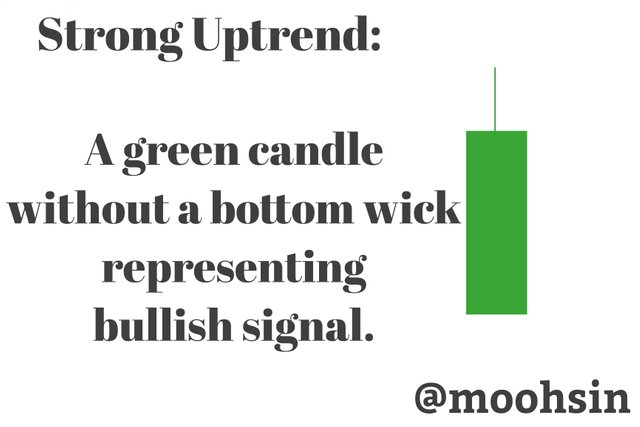
It is a green candle but without the bottom wick or shadow-less. As the trend name suggests it indicates a strong uptrend which is a big buying indicator (opportunity). It is particularly a bullish signal.
- Trend change: -
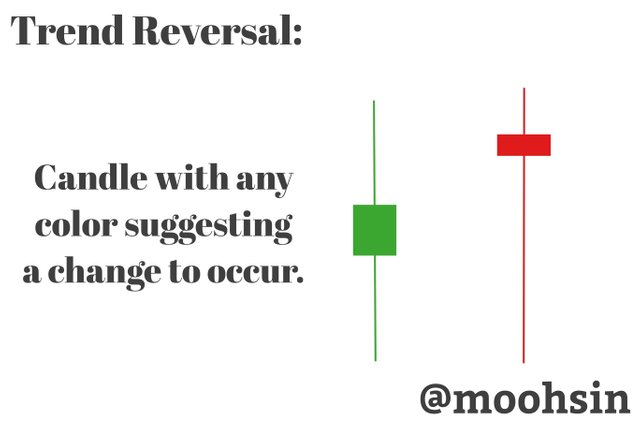
No matter the color, a candlestick with both long wicks, suggesting a change to occur. That is the trend is going to reverse in the opposite direction.
- Downtrend: -
It is represented as a red candle, and it is the beginning of a downtrend and the prices are going to fall/ go down.
- Strong Downtrend: -
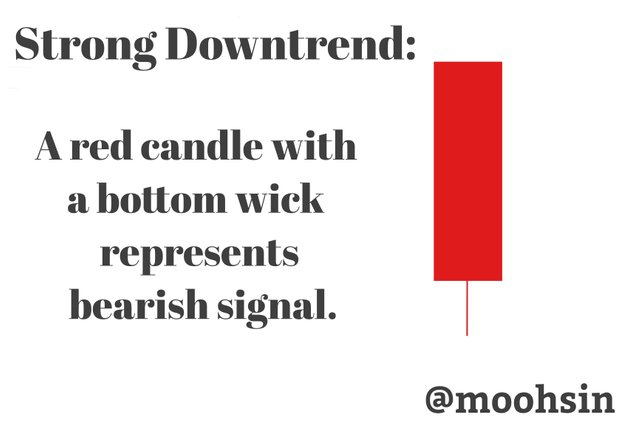
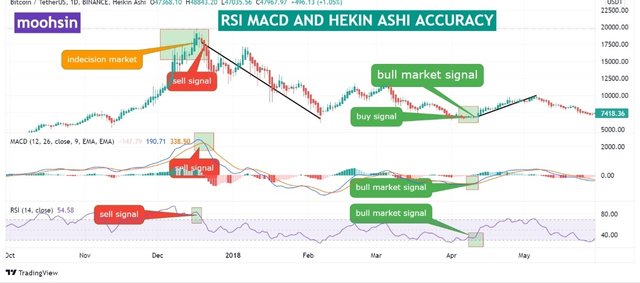
Using heikin Ashi to obtained buy/sell positon:
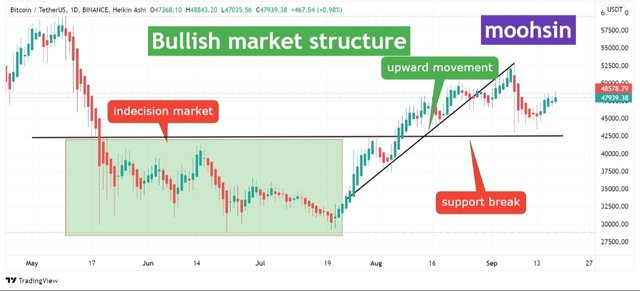
The belwo chart you can see i used heikin ashi patterns are embedded in bullish and bearish market where i enlightened the buy and sell orders with long and short positon.
Bearish signal and short criteria:
Here you can maintain short positon after a indecision patterns made by marekt although must use more indicator for trade here i just use the strategy to gain short position.
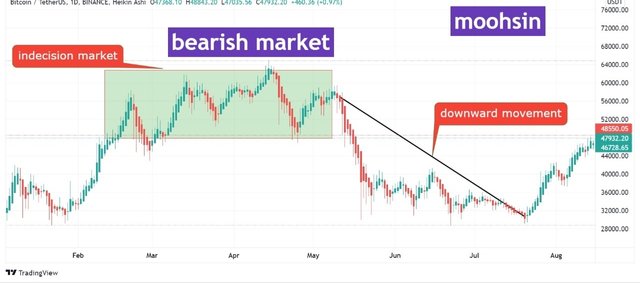
Bullish signal and long criteria:
Here you can maintain long positon after a indecision patterns made by marekt although must use more indicator for trade here i just use the strategy to gain long position.

QUESTION NO:5
Is it possible to transact only with signals received using the Heikin-Ashi Technique? Explain the reasons for your answer.
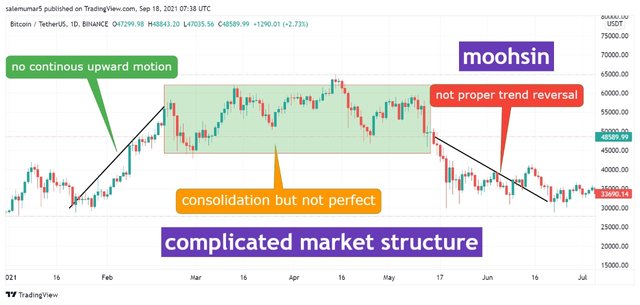
Heikin-Ashi candlestick presents the trend prevalent in the market through its indicator signals. To simplify it more, they are just indicators and not a confirmation. although Heikin-Ashi helps us with clear identification, it is not supposedly fool-proof (guaranteed) when used without any other indicators.
It is simply advisable for any trader to not rely on a single indicator but to rather combine other trading indicators to make better decisions and it also gives us an extra confirmation.
As recommended by @reddileep for combining 55-EMA and 21-EMA, both at the same time as they act as support and resistance indicators. The help of these indicators such as Exponential Moving Average (EMA) and Moving Averages (MA) helps traders to ease identify entry points, stop loss points, and to better understand the underlying trends.
Here the chart below is used multiple indicator to maintain my accuracy with heikin Ashi. There would be a wide probability that fakeouts and bullish and besrish nodes could be enlightened.


QUESTION NO:6
By using a Demo account, perform both Buy and Sell orders using Heikin-Ashi+ 55 EMA+21 EMA.
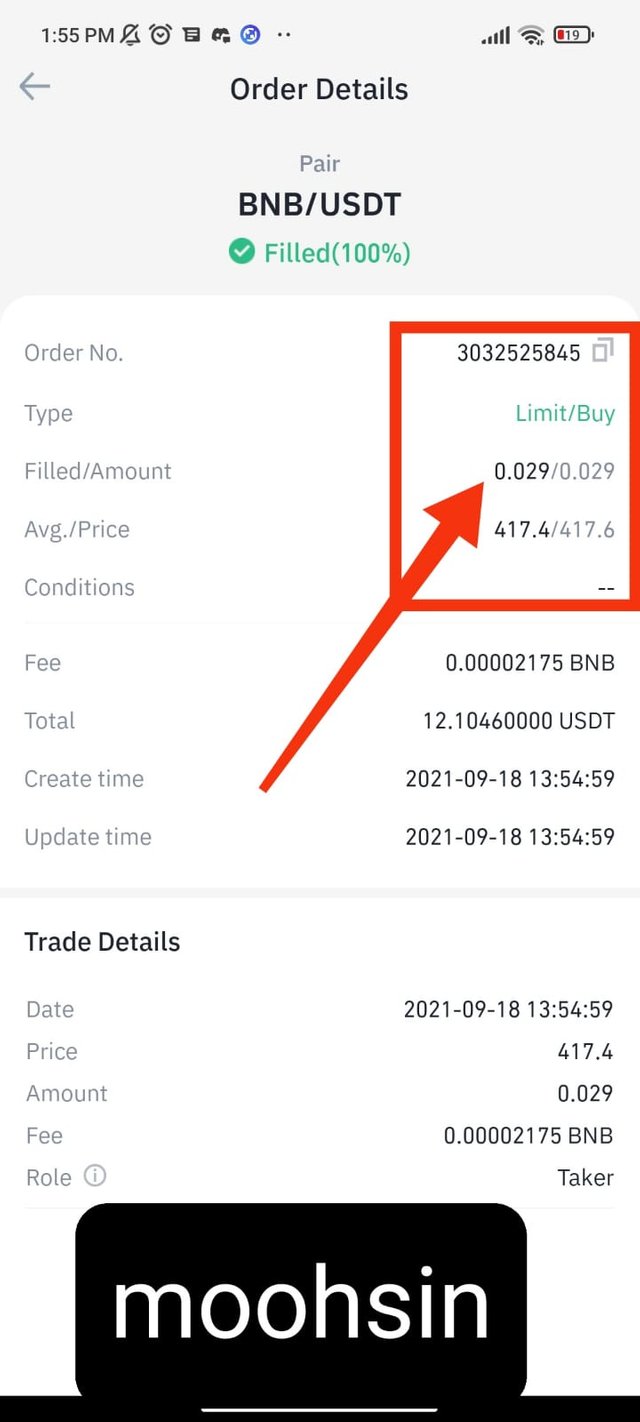
- First open a demo account, and when a buy signal appears put it on your account and buy it.
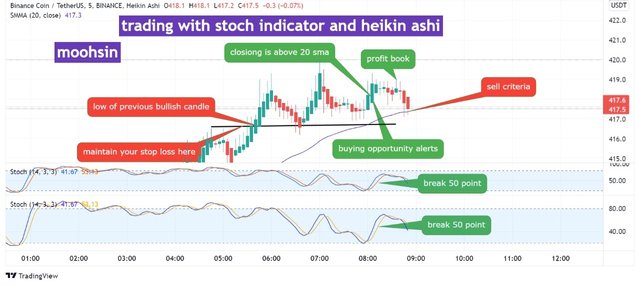
- After some time, a sell signal will be apparent and you can then put the sell trade on your account and the transaction is done.

CONCLUSION:
Heikin-Ashi is undoubtedly a revolutionary strategy that shows a lot of promise to its users. This candlestick strategy is very unique and stands out among others of its kind. It is astonishing how Heikin- Ashi helps to eliminate noise to give the chart a cleaner look.
I am both amused and grateful to learn about this indicator. I wholeheartedly thank the professor for sharing this project. I learned a lot about this strategy and I will commit myself to learn more about Heikin-Ashi.

Amigo se equivocó con el tag. Por favor cambiarlo.
Downvoting a post can decrease pending rewards and make it less visible. Common reasons:
Submit
Sorry professor that was a mistkae
Downvoting a post can decrease pending rewards and make it less visible. Common reasons:
Submit