QUESTION NO:1
How do you calculate Relative Unrealized Profit/Loss & SOPR? Examples? How are they different from MVRV Ratio(For MVRV, please refer to this POST)?
RUPL mean and bands category
The Relative Unrealized profit/loss evaluate us that from current price at any interval and adding UTXO and contemplate them with Circulating supply of asset then we can extract unrealized positve or negative value of profit or loss. This estimation of unrealized P/L based on paper working thus indicates us to obtain the sentiments of investor over assets that has been build on following categories;
✓Above 0.75- (Euphoria)
✓0.50 to 0.75- (Greed)
✓0.25 to 0.50- (Optimism- Denial)
✓0.00 to 0.25- (Hope- Fear)
✓0.00 or Below- (Capitulation)
The Relative unrealized profit/loss (RUPL) is attested with on-matrics that distinguishes the trader about unrealized profit or loss by using a formula in which difference of market cap and realized cap with total supply of assets. The asset can be called realized profit or loss, when it is sold whilst before selling of asset it is called unrealized profit or loss.
Diagnosis of Realized and unrealized P/L
The realized cap identify the users between the specific asset value considering it in alone diagnosis accumulating the UTXO price and you can get realized profit or loss by realized price rather than market price. This price consider as UTXO prices with their last moved. As per concept the before asset sold the calculation is accumulated were unrealized and after asset sold then we consider them as realized profit (with UTXO last moved).
Movement of UTXO with respect to current and realized price simply when the UTXO has made a move and the price action deviates from current position and it leads above the Realized price with price considering UTXO last moved it would be profit analysis statement and similarly if the Realized price is above the current price action with last moved of UTXO then would be consider loss analysis statement.
If you had a concept relating to market cap you would probably affirm about the ideal fluctuations of market cap that it contingent the overall value of market whilst realized are estimated to accumulate the individual differences with UTXO (last price moved) thus the formula states us the profit or loss of unrealized mechanism with combination of two on-chain matrics differences (market and realized) state us the unrealized profit and loss.
As per market analysis of many assets state us the concept of hope and fear/ (fomo) you all are familiar with this abbreviation (fear of moving out) initiates the trader to sell the asset thus this hope/fear can be excluded if you had an absolute practice on calculation of unrealized profit or loss, thus it is very is easy for traders by assembled the values in formula and if the value is positive you are in profit amd negative you are un loss.
Summed up
Piling up the unrealized profit or loss with market you can simply judge Relative unrealized profit or loss
Calculation of RUPL
Calculation study
The realized cap waves the actual value of asset with UTXO last move, Realized capital and the trade also values when UTXO make last move.Market cap linking the with current price of asset. **Unrealized P/L = difference between Realzied cap and market cap.
All the above note prepare us the RUPL formula which states that;
RUPL= (Unrealized P/L)/Market Cap

Calculation Example;
1: First we use to identify the unrealized profit by below formula and data.
Suppose an asset A;
Market Cap: 50,00,000
Realized Cap: 30,00,000
Unrealized profit/loss = $50,00,000 - $30,00,000
Unrealized profit/loss= $20,00,000 profit
Now it's a positive amount, Crypto A unrealized profit is $20,00,000
2- Now applying the initial formula to identify RUPL:
Relative unrealized profit= ( $50,00,000 - $30,00,000) / $50,00,000
Relative unrealized profit/loss = 0.4
Thus It is observed that 0.25 to 0.50- (Optimism- Denial) and our range band is under 0.50 and 0.4.
Explanation:
Thus its suggested that our RUPL is 0.25 to 0.5% and it would be emerge glance with fresh fluctuations has been seen and it will shoots beyond .50 further deviates till .75% and greed zone further euphoria will be achieved in mean time.
SOPR Means and calculation
SOPR ideally used to determine the swings high low making top and bottom with deviating price action having a attachment with on-chain metrics cycle emerging the market with bull and bear signals. Although it rationalize the trader about the UTXO spent by dividing their sum and attributes by creating a value under profit and loss.
Calculation Example:
Spent Output Price Ratio Calculation
The spent output price ratio is calculated by diving the spent output price by the initial created price;
SOPR = spent output price / Initial created price

Suppose an asset A spent UTXO of 5X at price 50$ and initial price 40$ maintain a data to calculate a SOPR as;
SOPR = Spent output price / Initial created price
where the:
Spent output price = 5 × $50 = $250
Initial created price = 5 × 40 = 200$
According to formula
SOPR = 250$/200$
SOPR = 1.25
According to below notes we indicate that 1.25 above 2 and its profit acquiring area for trader.
Note If the answer is greater than 1, it indicates profit, and if the result is less than 1, it carries loss.
SOPR RUPL AND MRV differential approach
RUPL is an on-chain attesment which instruct the traders to take profit from BTC behalf of market cap, visualize the traders about important tops and bottom regarding bullish and bearish zones. Ultimately leads unrealized profit or loss with accumulating the circulating supply though it also having link with UTXO spent and conjure the trader to known its profit or loss postion in market
SOPR determines the trader about bearish and bullish zones and true profit or loss position in market by sustaining a particular investment in coin via adjusting the ratio of UTXO buy and sell in current market.
MVRV determine the user the Bullish and besrish zones in market regarding the deviating price in market capital to realized capital with premium ratio and alter the trader to envision the price above or belwo true value and some traders regard it also the average profit or loss in market and stimulating the overprice and undervalued of price.

QUESTION NO:2
Consider the on-chain metrics-- Relative Unrealized Profit/Loss & SOPR, from any reliable source(Santiment, Glassnode, LookintoBitcoin, Coinmetrics, etc.), and create a fundamental analysis model for any UTXO based crypto, e.g., BTC, LTC [create a model to identify the cycle top & bottom and/or local top & bottom] and determine the price trend/predict the market (or correlate the data with the price trend)w.r.t. the on-chain metrics? Examples/Analysis/Screenshot?
RUPL Practical analysis
Relative unrealized profit or loss
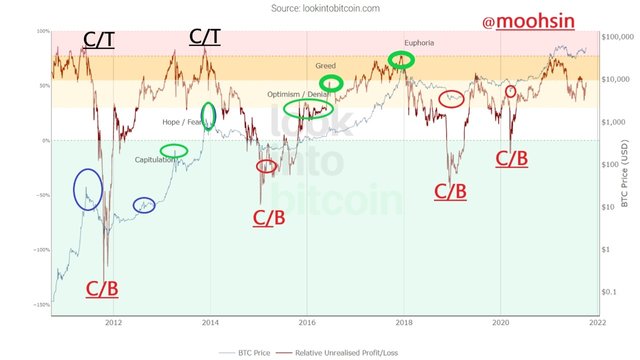
As per on-chain metric statement with RUPL elaborate us the unrealized profit or loss of UTXO spent under market cap showing us the emerging bull and bears cycles in market thus realzing the profit covering points and accumulation zones with bands category affirmations below we cans see clearly
The chart formalized us the sequencial study of bands which we elaborate in above questions that lies under 0 making cycles between above and below
✓Above 0.75- (Euphoria)
✓0.50 to 0.75- (Greed)
✓0.25 to 0.50- (Optimism- Denial)
✓0.00 to 0.25- (Hope- Fear)
✓0.00 or Below- (Capitulation)

In above chart price hits the euphoria zones 6 times in starting years (2011 and 2012) we can see clearly with green circles how ut hit the means and very heavy reversal which might been bend the price and there is perfect euphoria zones came 2018 this deviation or price refers a red zone because the greed area where the heavy loss or might sometimes a good profit would extract according to sentimental analysis.
Why I am expecting this historical prices are true picture that sometimes this reversal is for short term to liquidate traders thus by holding in that situation might be golden opportunity also.
The above chart clearly show us each trend when below zero i enlightened the area if bottom zone by the way this zone highlighted four times than a capitulating zones came than denial greed and again euphoria cycle came in to being but just constant the profit of trader and then again a bearish cycle came which reversed the market in between 2018 and 2020 years gap then you can see this season of 2021 is going greed and euphoria cycles which is highlighted above.
How i interpreted above chart make it simple always just focused on the concept of on-chain metric you are performing than utilize its band category strategies here above chart is integrated in two zones bullish and bearish 0 to 0.75 thus price below bottom zone and above show us the above show you positive area of sequencial band cycles above which is capitulation,hope/fear and greed.
Three years practical approach of BTC:
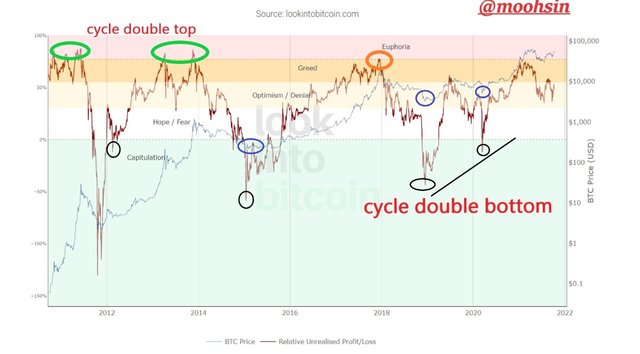
The chart below is btc and RUPL case study show us the euphoria zones in BTC is very rare and attestation of greed zone is also figuring with it. There you can see how RUPL maintain a deviating move from 2012 after a short reversal making double bottom and passes each zone smoothly and hits the mean of euphoria.
It is observed that price deviation are just like swing high and lows pretending the price bear and bull cycles in 2011 the starts is from cycle double top further a bear season you can observed with heavy reversal of Price till 1$ between -100% to -150% than in
After that BTC is in a continuous uptrend making local top and bottom but still haven't entered in euphoric phase to make new historically top.
SOPRPractical analysis
After a hope/fear zone there is another downward price fluctuation and price reversal thus it's for liquidation might seen and then a continuous upward zone competing the optimism/denial greed and euphoria zone ultimately reached in 2018 and reversal and then a greed and making cycle double bottom then consolidated price seen and market further price moved with RUPL in 2021.
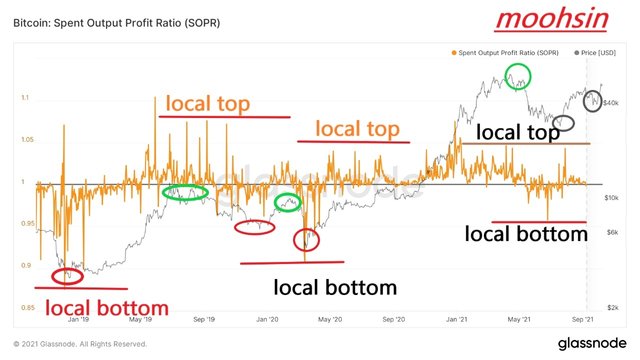
SOPR is on chain metrics which also determine the local tops (bottom) which and bull cycle (bear). Spent the ratio of created UTXO. The chart below show us the price formation of btc with SOPR.

The above chart is making several tops and bottom which is located and highlighted making a bullish and bearish cycle, interpreting the measurement above and below 1 imply us the local top amd local bottom in market the price above 1 i enlightened the local top whilst below 1 is bottom clearly maintain.
Thus traders different strategies can be implemented over here with SOPR to advance more results just like using RUPL you can admire your post when it reaches near 1 in bull cycle pretending a buy signal and if reaches 1 in the bear* cycle it indicates the sell signal. Thus interpretation is per analysis.
Here above the the spikes are alos seen downward spike is formed just below local bottom at $6k near and in between $6k -$2k and last local bottom observed at near $2k these are the contrast which is highlighted above in circle can be seen clearly.
You can make a sell and buy signal as jan 2021 the SOPR is above one in bull cycle which is highlighted with green can be a sell signal a local top is also manifest over the are and highlighted above ( **SOPR 1.02814021 AT PRICE $ 26,388.15) and then consolidation might seen at further nodes.

QUESTION NO:3
(3) Write down the specific use of Relative Unrealized Profit/Loss(RUPL), SOPR, and MVRV in the context of identifying top & bottom?
The process in which user identify market sentiments while top and bottoms and planning different views and market visualisating attitude with different on chain-metrics to extract different cycle in comparison with times frames thus above question stated us to exaggerate three metrics RUPL,SOPR and MVRV. Here we will discuss them in context of identity the top and bottom.
RUPL means with top and bottom
RUPL is On -chain metirc and we had briefly discuss its functionality above now lets extract some of its uses cases with respect to squeeze the top and bottom area from market hence it evaluates the unrealized profit or loss manifesting us the ratio of tip and bottom areas in market, however by its formula the RUPL having a systematic a way of acquiring the sentiments though after all that dividing the unrealized profit/loss with market resulting us the outcome of band category in range bound with 0-0.75% above .75 it accumulating the profit zone (top) and below 0 it indicates th bottom and accumulation zone.
Ideal bands category
Measuring the sentiments with fear and hope zones in marekt can extract from following areas and results;
✓Above 0.75- (Euphoria)
✓0.50 to 0.75- (Greed)
✓0.25 to 0.50- (Optimism- Denial)
✓0.00 to 0.25- (Hope- Fear)
✓0.00 or Below- (Capitulation)
SOPR means with top and bottom
SOPR Determine us the tops and bottom but in different medium and sentiments with market having different range bounds and evaluation if bull and bear cycles un market, thus range are banded under 0 level below or above. Signifying value at 1 a bull cycle whilst below 1 a bear cycle can be assumed thus traders use this case study interpret the buy and sell in market.
Thus also interpret us the ratio of sum UTXO spent woth respecting to the creating value of asset. Ultimately they also can observed in such below bands;
✓ Down spike in SOPR
✓ Upward spike in SOPR
Thus resulting bands accumulates them in a cycle of bear and bullish zones creating a top and bottom deviations in market.
MRVR means with top and bottom
MRVR determine us the top and bottom but indicating the the overall positon and sentiments of marekt visually contrast the trader about the underprice and overprice state ins market by the attested combination of its reflect the price with range banding in % as per historical ratio above 300% is considered as overpriced and can be take reversal and might liquidate the trader hence contrary with undervalued historical assumption states below 100% considered underpriced and hope of making higher profit thus they are accumulated un terms if bulla nd bear cycles making a top and bottom in each of underpriced and overprice band zones.
Summary of RUPL MRVR AND SOPR use cases:
Hence we thoroughly identify the statements if each on chain metric which were covered in our lesson though i state my view point regarding the best way to initiate each metric thus the combination of these three metrics are remarkable, accumulating each zone top and bottom whilst implementing indicator and strategy to make better analysis with these on chains thus the combination which suited best were RUPL and SOPR this is my means howbiet people use different combinations to analyse the market sentiments.

Conclusion:
These are known on-chain methodology to determine the market sentiments of whike suing RUPL SOPR** strategy these might not be a strategy but a way to analyse the price deviation with respect to on chain metrics. It evaluates the profit or loss areas by spend their UTXO thus thats how Investor lies under profit or loss zones. MRVR average or profit or loss acquisition of coin by bear and bull cycles under the provisions of 100% to 300% this was the historical analysis throguh thats how the price deviates and intimate the average ratio of profit or loss.
In all on chain metrics the most remarkable thing i extract and likes is the formation if band and their category each metrics devised their strategy to analyse the profit or loss positon in market with respect to market cycle.
Thanks, @sapwood, For such a knowledgeable homework post.
Regards;
@moohsin

You've got a free upvote from witness fuli.
Peace & Love!
Downvoting a post can decrease pending rewards and make it less visible. Common reasons:
Submit