Cover page Designed by me, @msquaretk | Made on imarkup
It's another week in the Crypto Academy; this is the week 3. The past two weeks of lectures from Professors have been awesome and the two weeks of the trading competition were full of experiences. Thanks to the Admins and all the Professors. This post is written in response to Prof. @pelon53 's assignment. He taught break of support and resistance and at the end of the lecture, he gave us questions as homework. I will be responding to the questions given. So, follow me closely.

1. Explain in detail the advantages of locating support and resistance on a chart before trading.

In this first task, I'm going to be explaining the advantages of locating support and resistance on a chart before you start trading. Support and and resistance are key levels area which every trader need to know how to identify on the chart. Knowing how to locate these levels will help traders in his analysis and positioning in the market.
Supports are area of price where price is likely to reverse to the uptrend after a considerable fall in price, or seller have dragged the price to the downside and are weakened. Supports are treated as zones where traders (buyers) are gathered to take buy position in the market.
Resistances are area of price where price is likely to reverse to the downside after a considerable rise in price, or buyers have dragged the price to the upside and are weakened. Resistances are zones where traders (sellers) are gathered to take sell position in the market.
To further understand support and resistance, it's important I let you know that support and resistance can be static or dynamic. Static support and resistance are those which are represented by horizontal line in the chart, while dynamic support and resistance are often represented by trendline.
It's important to identify these levels or zones called support and resistance before embarking on taking position in the market. Support and resistance serve as entry and exit levels in the market. We all know how important entry is in the market. When you know when to enter the market, you already have almost great percentage success rate.
Also when you know when to exit the market, you safe yourself of losing your profit and your capital can also be protected. When the trade goes in your predicted direction, it's better to exit when you have made some profits before the trade changes. This is because no trend is everlasting. Trend changes. So, knowing when to exit (take profit) will help you. Sometimes, we take trades that goes against our prediction; when that happens, our exit (stop loss) will help protecting our capital and we usually use support and resistance levels for this.
Furthermore, support are area where the forces demand tend to be greater supply and this makes price to shoot up. You would heard about demand and supply in elementary economics. When traders demand for the asset, then they will want to accumulate more of the asset. Support zone shows that the traders are demanding for the asset.
Also, resistance are area where forces of supply tend to be greater and of course we know the implication, the price will fall. When price begins to approach a resistance zone, traders think of increase in supply and the buyers who have been in the market exit and sellers take over the market.

2. Explain in your own words the breakout of support and resistance, show screenshots for the breakout of a resistance, use another indicator as a filter.

Here, I am going to be explaining the breakout of support and resistance and show screenshot only for the breakout of resistance.
The price of an asset often moves in a range, especially when the market is not trending. During the time, the market is said to be ranging. It's has been said that about 70% of time, the market will be in a range and 30% the market will be in a trend. Even when market is trending, it will sometimes pause and create a range.
The price moves up and do during in the range and sellers and buyers play in the market. When the the price moves up, the buyers are in control and when it moves down, the sellers are in control. The upper part of the range which resist the price is called resistance and the lower price which support the price is called support.
Support and resistance can only hold price for sometimes. Meaning they aren't everlasting. When the price tests the support zones and resistance zones multiple times, it gets to a point when they become weak. In fact, multiple tests of these zones signifies more weaknesses. Price can break the support zone. When this happens, support will turn to resistance. And also price can break the resistance zone. When this happens, resistance will turn to support*.
Let's see a case of a resistance that breaks. It's often as a result of weaknesses in the sellers part. Buyers pushes the price to the resistance zone and sellers couldn't take over the market because the buyers at this time are very stronger, coming with great momentum.
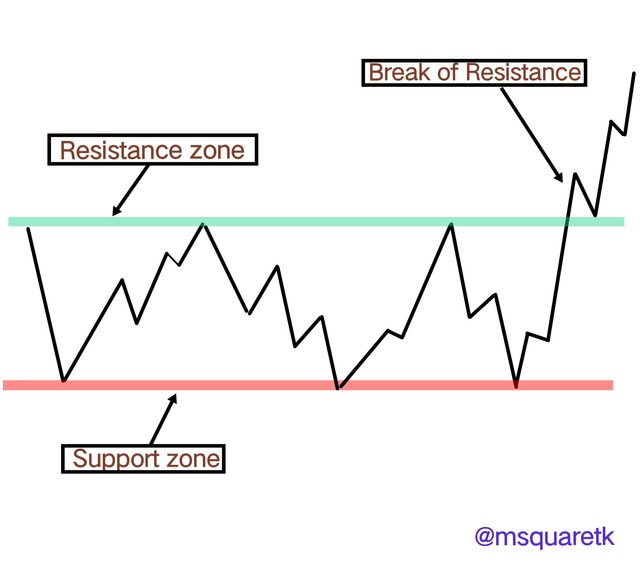
Image made on imarkup
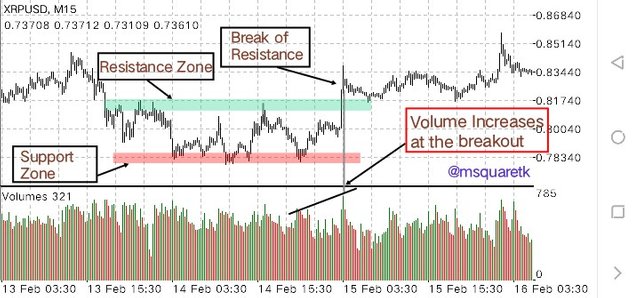
On the chart of XRPUSD, M15 timeframe, you will notice that the price was in a range, the support and resistance were holding until the price broke the resistance and turned that resistance to support. You will also notice that the price retested the resistance that turned to support.
Traders take a buy position at he retest of his zone and place stop loss below the zone and take profit at a closest resistance. Sometimes, the price may not retest this some and continue to rally upside.
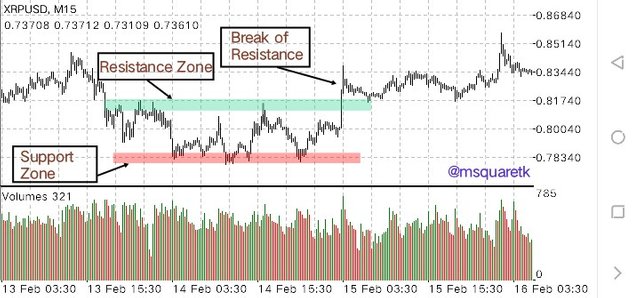
Screenshot from Mt4 App
To filter the break of resistance, it's important that traders use other tools or technical indicator to do that. This is to ensure a correct analysis and not get caught. Here I will use volume indicator to show how to filter the indicator.
If the breakout is valid, the volume should increase at the point of breakout. This will signifies that the momentum with which the buyers come to that zone is great. It will mean that the buyers are in control of the market and are willing to take the price up. If they volume doesn't increase, it may be a false breakout. See the screenshot below.
Screenshot from Mt4 App
You can see in the screenshot above that the volume increased at the break of the resistance zone.
Having done with that, let's move to the next question as we will see the screenshot for breakout of support in the next question.

3. Show and explain support breakout, use additional indicator as filter, show screenshots.

Like I mentioned earlier, price doesn't continue in a range for life. The resistance and support zone get broken when they become weakened.
Support break occurs when the buyers could not push price to the upside at the support zone. This is due to the aggressive push in price by the sellers. Often, the support zone get weakened as a result of multiple tests on this zone.
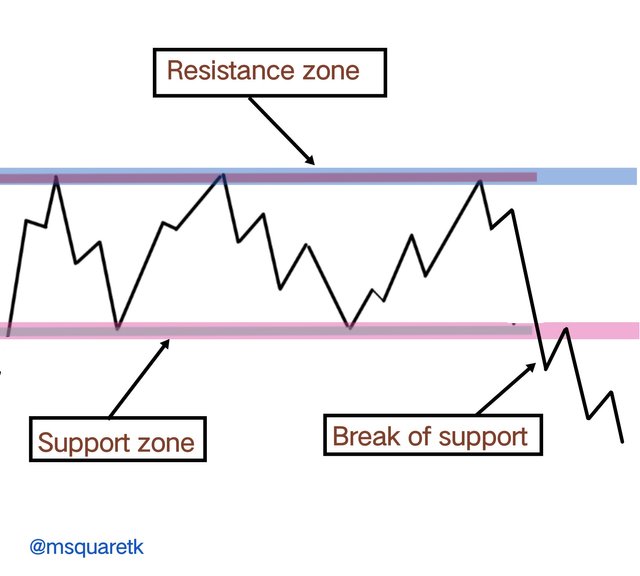
Image made on imarkup
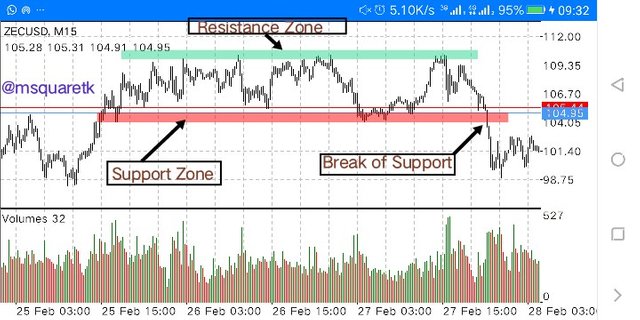
Now, let's look at the example of this on a real chart. On the chart of ZECUSDT, M15 timeframe, price is seen to be in a range for sometime. We will see in the screenshot. As price reaches the resistance zone, it keeps resisting the price and turns it to the downside. Also, price gets to the support zone and it's being supported as price turns to the upside.
This dragging of price between the buyers and sellers which creates a range continued until the sellers broke the support (it's indicated in the screenshot below). This means that at the support zone, sellers could not push the price higher, the support fails to support the price and buyers broke the area with a great momentum. A sell position could be opened when the price retest the zone it broke and stop loss being placed above the zone and take profit at the nearest support zone.
Screenshot from Mt4 App
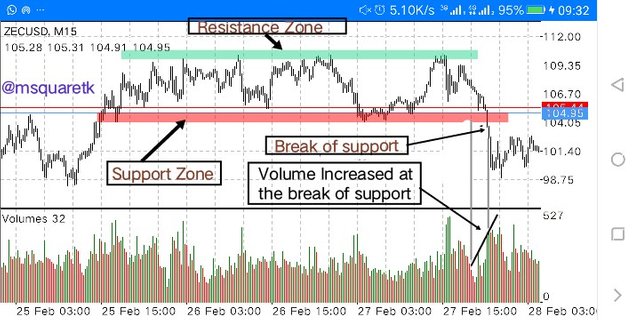
It's important to filter this breakout using other tools or technical indicators. To filter this, I will use volume indicator. When the price breaks the support zone, if it's a valid break, the volume supposed to increase. If that doesn't happen, then it may man the breakout is false. See the screenshot below.
Screenshot from Mt4 App
Now, let's proceed to the next question.

4. Explain what a false breakout is and how to avoid trading at that time. Show screenshots.

Here, I am going to be explaining false breakout. Sometimes the break of resistance and support could be a false breakout. Meaning it will just break the range and come back I the range. Traders should be aware of this because it can lure them to take position and the price will just reverse against them.
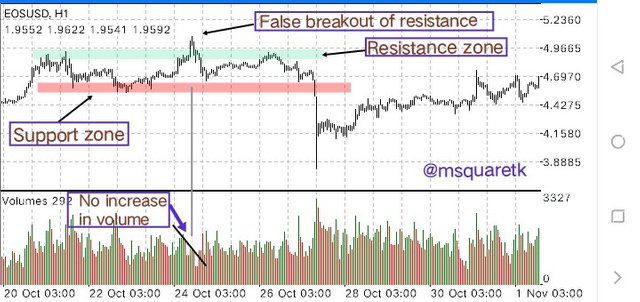
When a false breakout of the resistance happens, the price will break the upper part of the range and quickly moves to the upside, and then later come back to the range. The resistance now resist the price and the sellers drag the price lower back to the lower part of the range, or support zone. Let's see the screenshot below.
Screenshot from Mt4 App
In the screenshot above, we can see the chart of EOS/USDT was in a range. There was a false breakout of the resistance zone. The price moved above the zone and later came back to the zone.
If traders during this time had open position Immediately at the break, it would reverse against them. One of the ways to avoid this is to filter the signal, the breakout. Technical indicators could be used to do this.
Volume indicator will show if a breakout of the resistance is a false breakout. If the volume doesn't increase at the point of breakout, then it means the breakout may be a false one. In the screenshot above, you can see that the volume doesn't increase.
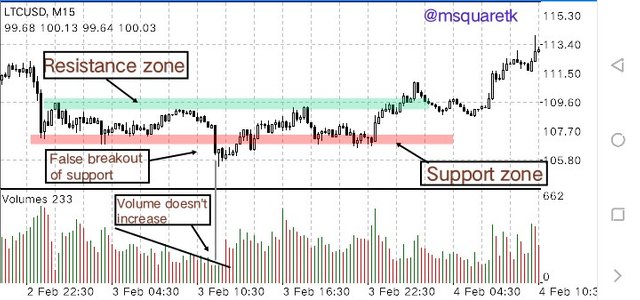
Also, when a false breakout of the support happens, the price breaks the lower part of the range and quickly moves to the downside, and then later come inside the range. The support now support the price and the buyers drag the price back to the upper part of the range, or resistance zone. See the screenshot below.
Screenshot from Mt4 App
In the screenshot above, we can see the chart of LTC/USDT was in a range. There was a false breakout of the support zone. The price moved below the zone and later came back to the zone.
If traders during this time had open position Immediately at the break, it would reverse against them. One of the ways to avoid this is to filter the signal, the breakout. Technical indicators could be used to do this.
Volume indicator will show if a breakout of the support is a false breakout. If the volume doesn't increase at the point of breakout, then it means the breakout may be a false one. In the screenshot above, you can see that the volume doesn't increase at the break of the support zone.

5. On a demo account, execute a trade when there is a resistance breakout, do your analysis. Screenshots are required

In this task, I'm going to be placing a trade after the resistance breaks.
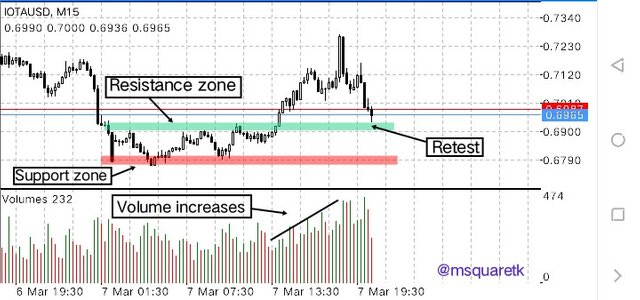
On the chart of IOTAUSD, the price was seen in a range for sometime before a break of resistance happened. The resistance which has resisted the price for more than two times eventually got broken. After the break of this zone, aggressive traders can open a trade immediately, but conservative traders will wait for the retest of the zone.
It's important that we filter the signal, the break of resistance before deciding to take a long entry. Here, I have used the volume indicator to filter the signal. If the signal is valid, it's expected that the volume increases at the break of this zone. See the screenshot below.
Screenshot from Mt4 App
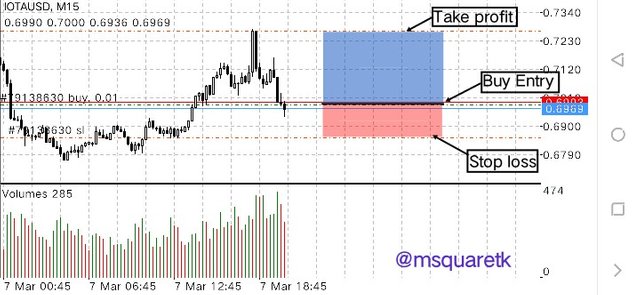
As it's seen in the screenshot above, the he break of resistance occurred and the volume increases. Then, the price is now at the zone which it broke. Meaning it's retesting the zone. Then noticing this, I opened a buy entry at this zone, at $0.6989 and stop loss was placed below the zone and take profit was at the nearest resistance zone.
Screenshot from Mt4 App
Then, after executing the trade, I took a screenshot of the trade running. This screenshot is taken immediately after placing the trade. I will be monitoring the trade and see how it's going to end.
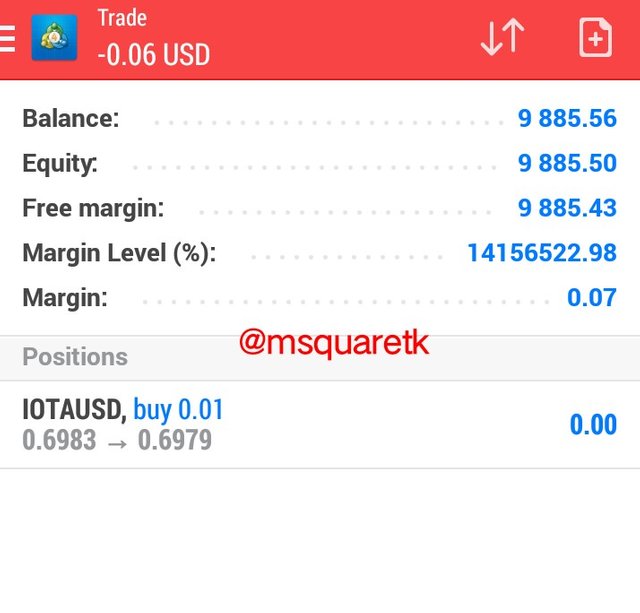
Screenshot from Mt4 App
Let's now see the break of support level and how I traded it.

6. In a demo account, execute a trade when there is a support break, do your analysis. Screenshots are required.

Here, we will see how I did my analysis after a break of support and how the sell order is taken.
The same order i will be taking is the pair of XRPUSD. On opening the chart of XRPUSD, M5 timeframe, the price was seen in a range. Meaning the price was moving between a horizontal support zone and horizontal resistance level. As the buyers keep buying f on the support zone, the price keeps moving to the resistance zone. And sellers take over when the price reaches the resistance zone.
But, it gets to a time when buyers couldn't push the price from the support zone because the sellers overpowered them. Then the price broke the support zone. The breaking of this support zone signifies that the price is likely going to continue the bearish move. However, traders need to be careful because I may be a false breakout.
As soon as i saw this break of the support, I knew it's a signal for sell. But of course, I'm aware of the false breakout; I had yo confirm the validity of the signal using volume indicator. When the indicator shows an increase in volume at the break of support zone, then it means the breakout is valid. See the screenshot below.
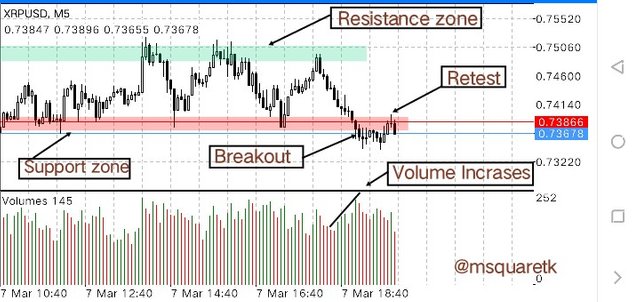
Screenshot from Mt4 App
As it's seen in the screenshot above, there was a breakout of the the support zone which I think sell signal we are interested in. Then , volume indicator shows an increase in volume. That means the breakout is valid. Also, the price has retested the zone that got broken.
Upon seeing that, I opened an instant sell order at the retest of this zone, $0.7368 and stop loss was placed above the done and take profit at the nearest support level. See the screenshot below.
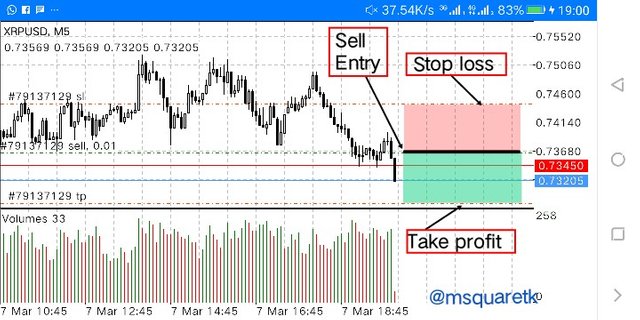
Screenshot from Mt4 App
Then, immediately after the execution of the trade, I screenshot the trade while running. See the screenshot below.
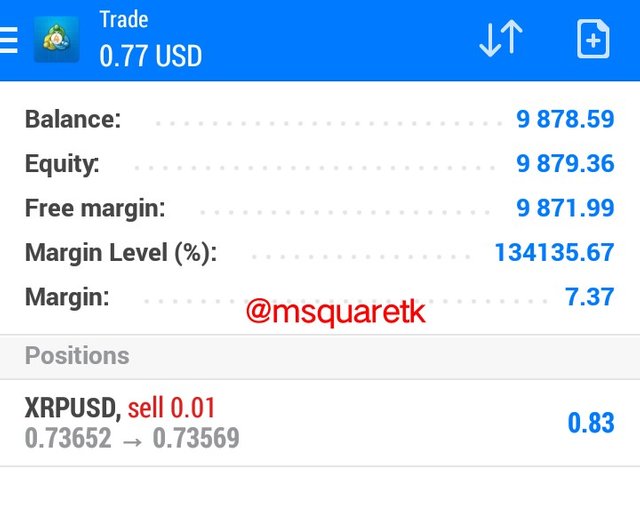
Screenshot from Mt4 App
Then some minutes later after the execution of the sell trade, it hits my take profit. It went according to my prediction. The screenshot below shows the profit made from this trade.
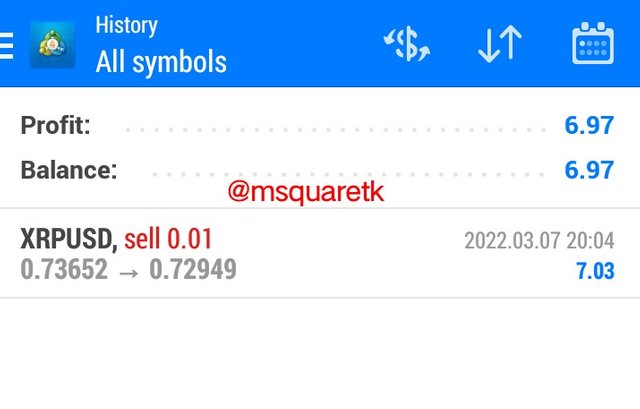
Screenshot from Mt4 App

Conclusion

Support and resistance are key level areas where the price is likely to bounce back when it reaches these levels. They are treated as zones and not as line. There's are two types of support and resistance. Support and resistance can be static or dynamic.
Static support and resistance are indicated by drawing horizontal zone or line on the chart where price has been supported or resisted. This type occur in a ranging market. Dynamic support and resistance are those represented by trendline. They occur during a trending market. We have considered static support and resistance extensively in this task.
It's important that traders identify these zones on the chart before taking trades. They important for entry and exit in market. Traders are also encouraged to filter the breakout of the support and resistance because of false breakout. Technical indicators such as volume, RSI, MACD etc. can be used to filter the breakout.
Thanks to Prof. @pelon53 for this insightful and educative lecture on support and resistance breakout.

CC: @pelon53
Written by @msquaretk
Saludos @msquaretk, necesitamos que la redacción de tu tarea sea totalmente diferente a la de @msquaretwins, porque de lo contrario pensaremos que las tareas la hace una sola persona.
Ambas tareas son muy similares y necesitamos que sean totalmente diferentes.
Por favor, preste atención a esto.
Downvoting a post can decrease pending rewards and make it less visible. Common reasons:
Submit
Dear Prof. @pelon53,
Honestly speaking the work is done by separate individuals. Is it a crime to be Twin brothers? We have provided evidences some months ago regarding this.
I did my work myself and he did his. Please check it very well. If you need any other information, I will surely supply it.
Thank you.
Downvoting a post can decrease pending rewards and make it less visible. Common reasons:
Submit
Good day Prof. @pelon53. Thanks for bringing this up. Some of the the Professors have raised the issue before. But the truth of the matter is, I did my own work myself and besides, the person you referred to is my Twin brother. He has his own account and I have mine.
We don't work together. And if you think it this way, how can someone be posting 8 assignments with quality contents. I don't think it's possible.
Before I joined steemit, my brother and I have been exposed to forex trading and we learned under the same teacher. So most of the technical indicators are tools are not strange to us. So, the thinking pattern may be the same. But truly, if you go through our work, you will realize it's not the same, it's done differently. It may be hard to believe, but that's just the truth.
When this issue was raised some times ago,we provided evidences that justified that the two accounts belong to different individuals. But, if you still have any iota of doubt, I will gladly provide you with more information.
Thank you for your understanding.
Kind regards.
CC: @pelon53
@steemcurator01
@steemcurator02
Downvoting a post can decrease pending rewards and make it less visible. Common reasons:
Submit
Saludos amigo @msquaretk, entiendo que sean hermanos gemelos, pero cada trabajo debe ser totalmente diferente.
Queremos estar seguro que cada trabajo sea realizado por personas diferentes. Se que han mostrado evidencias de que son personas diferentes, pero necesitamos que la redacción de sus trabajos sean totalmente diferentes. Por favor tomen nota de esto.
Espero que lo entiendan, gracias
CC: @steemcurator02
Downvoting a post can decrease pending rewards and make it less visible. Common reasons:
Submit
Thank you Prof. @pelon53 for your understanding. But as earlier said, the account belongs to two different persons and the homeworks are done separately.
Thank you.
Kind regards,
– @msquaretk
Downvoting a post can decrease pending rewards and make it less visible. Common reasons:
Submit