
Cover Page created by me, @msquaretk | Designed with imarkup
It's the last week of the season 5 in the Steemit Crypto Academy. This is the week 8. The past 7 weeks were full of experience and lessons from our Professors. Thanks to them all and the entire management of the community. This post is written in response to Professor @reddileep 's assignment. He taught "Advanced Technical Analysis Using Fractals" and explained the topic very well. At the end of his lecture he gave us questions for assignment. I will be responding to the questions one after the other. Follow me closely.

1. Define Fractals in your own words.

In this first task, I am going to be be explaining fractals. One of the the popular saying in finance trading is " market moves in wave". That's market moves in such a way that there's the price is seen on the chart as waves. That's why many studies have been formulated based on this. There's what is called wave theory. Traders study this to predict the movement of price. It's also important to know that market is fractal in nature.
The word fractal means a shape or curve that comprises of smaller sizes of the same shape or curve. What does this have to do with finance or cryptocurrency trading? Now, remember I tell you that market moves is fractal in nature. Actually what happens is that, the behavior of buyers and sellers over time form what's known as patterns. These patterns are very useful in predicting the direction of price in the market. Then, it's believed that the pattern reoccur, and form what's known as fractal.
To understand this very well, you will notice when the price forms a shape on a higher time frames, if you switch to lower timeframes, the shape of smaller sizes could be seen. This means, there are many smaller shapes of the same shape with the bigger shape. This is often inform of repetition on the chart.
In essence, fractals can be liken to the repetition of patterns on the price chart. This can be in a bearish or bullish trend. The knowledge of fractals are very useful in finance trading. Traders study the past patterns, having known that price is liable to repeat the pattern, and position themselves to open a position either in the direction of trend or against it depending on the strategy they use the fractals for. Fractals are useful to predict the direction of price and of course because patterns do repeat, many traders have taken so much study on the repetition of patterns.
These days, as result of the quest to know more about fractals and to accurately predict the price of an asset, many indicators have been developed or created for the recognition of fractals in the market. Williams Fractals Indicator is one of the most popular indicators which traders use to identify fractals. This indicator came into being to help traders to easily recognize the repetitive patterns on the chart.

2. Explain major rules for identifying fractals. (Screenshots required)

In this task, I am going to be explaining the major rules for identifying fractals. Like I said above, fractals are repetitive patterns which occur on the price chart. They can help us predict the direction of price.
The first thing to note is that, to identify the fractals, we need at least 5 (five) candles or bars. It could be more than that, but lesser candles may lead to low accuracy, and then it cannot be considered as fractal.
Basically, we have two categories of fractals. We must recognize them. We have bullish and bearish fractals. Then, we also need to recognize the trend which an asset is. It's vital because after recognizing a pattern, we will predict that such type of pattern will reoccur in that particular trend.
For the bullish fractal to occur, the middle candle of the fractals must have the lowest low and the candles at the sides must have higher low. In the screenshot below, you will see an illustration of a bullish fractal where the middle candle is at the lowest and the candle at the sides are higher than the lowest candle.
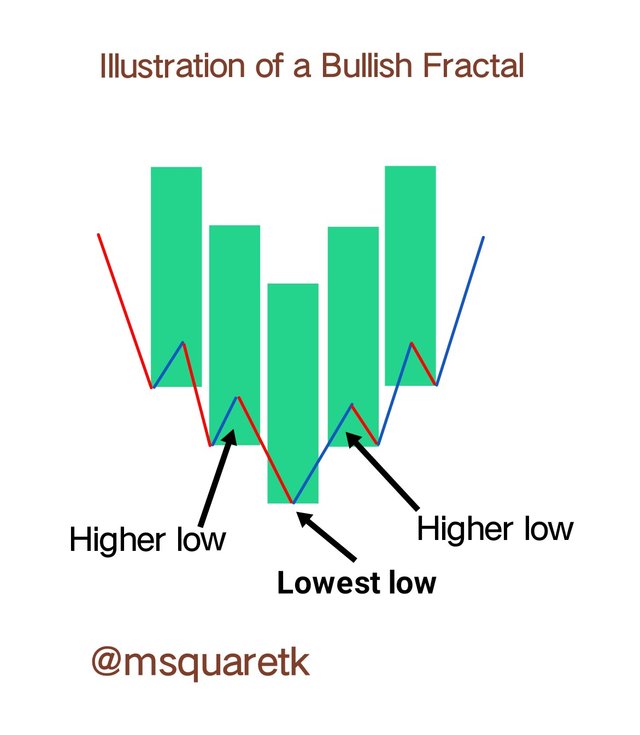
Illustration made with imarkup app
- For the bearish fractal to occur, the middle candle of the fractals must have the highest high and the candles at the sides must have lower highs . In the screenshot below, you will see an illustration of a bearish fractal where the middle candle is at the highest and the candle at the sides are lower than the lowest candle.
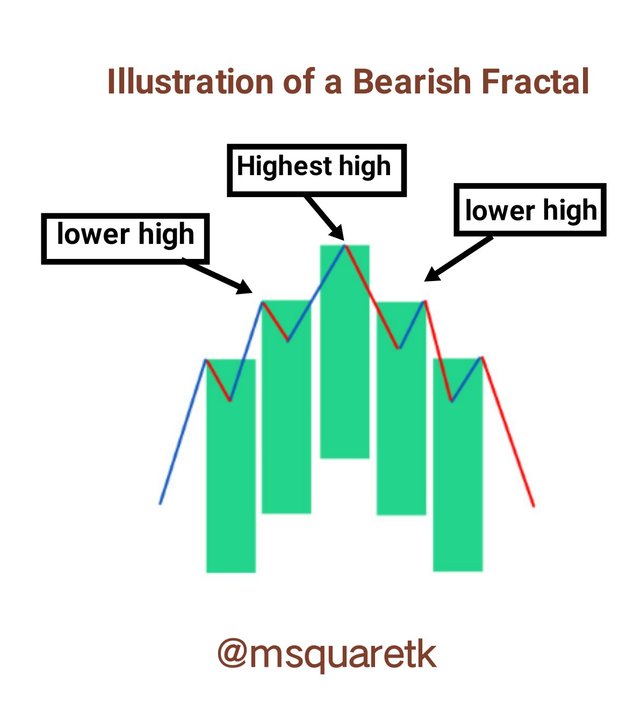
Illustration made with imarkup app

3. What are the different Indicators that we can use for identifying Fractals easily? (Screenshots required)

In this part of the question, I'm going to be discussing different indicators which can be used to identify fractals easily. Like I said above, the most popular indicator is Williams fractal indicator. However, there are some indicators such as fractal indicator, fractal breakout, fractal support and resistance etc. which can also be used for identification of fractal.
Williams Fractal Indicator
I'm going to be using trading view platform to add the indicator to the chart. Firstly you visit the website. You can click this link: https://tradingview.com. Upon clicking the link, navigate to the left top side of the homepage, click the menu and on the menu, click the chart. If you don't have an account with them, you may need to firstly create a free account. Upon clicking on the chart, go to the top of the chart and look for "fx indicator". Then click on it.
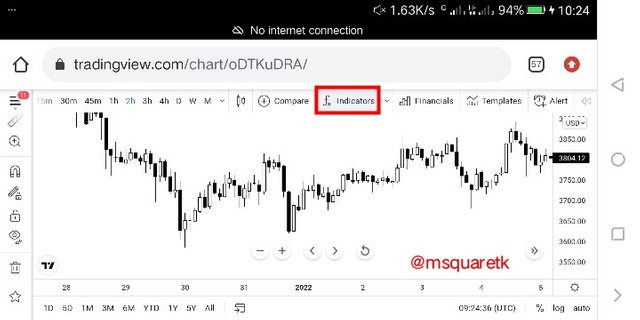
Screenshot From Trading view | SOURCE
Upon clicking on it, a search box will appear. Type "Williams fractal indicator" in the search box and allow the result to show. Click on it just once.
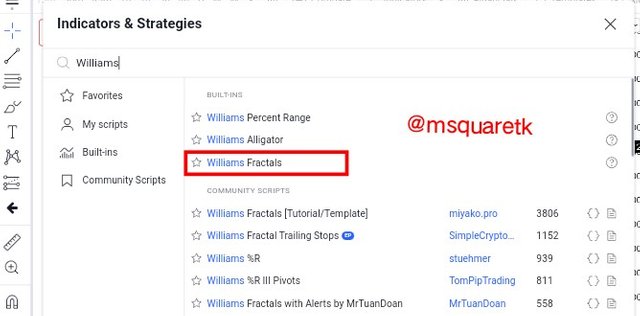
Screenshot From Trading view | SOURCE
Upon clicking on it, the indicator will be added to the chart. In the screenshot below, you will see that the Williams fractal indicator was added to the chart.

Screenshot From Trading view | SOURCE
As it can be seen in the screenshot above, Williams fractal Indicator has been added to the chart. It comprises of green and red dots which appear below and above he price depending on the direction of the trend. The indicator enables the traders to see or identify the reversal points on the price chart. Like I said, the indicator shows green and red dots or arrow. The green arrow points toward the upside and when it appears on the chart, it shows sell fractal. The red arrow points toward the downside and when it appears on the chart, I shows buy fractal.
Fractal Breakout
Another type of indicator which can be used to identify fractal is fractal breakout. Just as we added the Williams Fractal Indicator, use the same process. Click on $fx Indicator* at the top of the page. Then search on for fractal breakout by writing or typing fractal breakout in the search box.
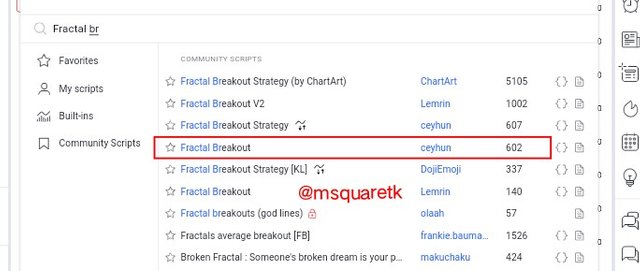
Screenshot From Trading view | SOURCE
Then, once the result appear, click on it just once. If you click it more than once, it will be added multiple times. In the screenshot below, you will see that I have added fractal breakout to the chart of ETHUSD.
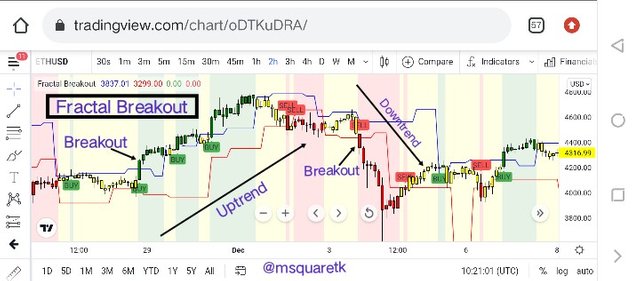
Screenshot From Trading view | SOURCE
In the screenshot attached, you will see that fractal breakout is made up of two bands, red and blue. And also, sell and buy are shown below the price. They are actually buy and sell fractal. When the price buyers are aggressive, the price breaks above the upper band, blue. We can see that in screenshot above. When the buy fractal shows, and price breaks above the upper band, blue line, that means the uptrend is building up. And as we can see, a break of this band happened and the price rally to the upside. On the other hand, when the sell fractal shows and the price breaks the lower band, red line, that means a downtrend is building up. And that was what happened in the screenshot above where I marked with a downtrend.
Fractal Breakout is a good indicator which is used to identify fractal. Apart from identifying the buy and sell fractal, it can also be used for trend identification. When price is above the upper band, the trend is bullish and when price is below the lower band, the trend is bearish. There are also many indicators which can be used to identify fractals apart from **Williams Fractal Indicator and fractal breakout which have been discussed extensively. Some of these Indicators are:
- Fractal Indicator
- Fractal support and resistance
- Fractal Resonance Bar
- Fractal and Alligator level
- Fractals highs and lows etc.

4. Graphically explore Fractals through charts. (Screenshots required)

Like I said above, we can identify the fractals on the chart through different indicators. We can see how Williams Fractal Indicator as well as fractal breakout were used to identify fractals on the chart in the previous question. These indicators are great indicators I Identifying fractals. However, in the question, I am going to go deeper by identifying fractals by using drawing tool on the chart.
How are we going to do this? Remember I explained what fractals are earlier. I defined fractals as the repetitive patterns on the chart whether on the bullish trend or bearish trend. So, what we are going to be doing is comparing the past price pattern to the one that's currently forming. Now, by comparing these patterns either I a bullish leg or bearish leg, we will see if their are similar. The similarities of these patterns is an indication of what's going to happen in the market, majorly, reversal of the trend.
Now, for this task, I'm going to be using the https://www.tradingview.com to explore fractals. The tool I will be using is bar pattern. To use this tool, we are going to navigate to left side of the page. This side the tool panels which contains different tools which can be used in doing technical analysis. In the screenshot below, you will see how I navigate to the panel to pick this pattern.
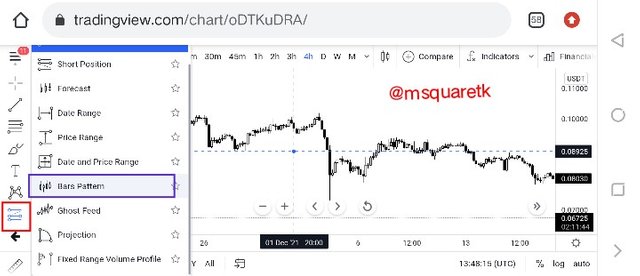
Screenshot From Trading view | SOURCE
I am going to be using the past data on TRXUSDT to explore the fractal. In the screenshot below, you will see the pattern I marked with red circle. I am going to be comparing this bullish run pattern with the one I marked with blue color.
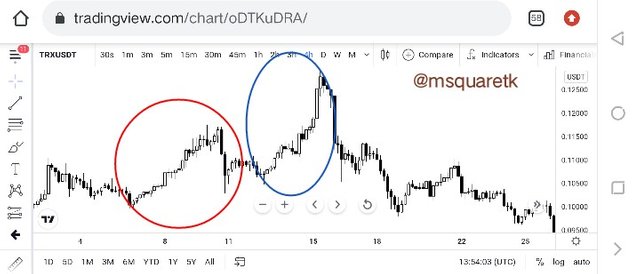
Screenshot From Trading view | SOURCE
Now, after identifying the trend, which is the bullish trend and we have seen a pattern. We go to the tool panels to click the drawing pattern, bar pattern. Upon clicking it, we start the drawing from the start of the bullish run to the end point. See the screenshot below.
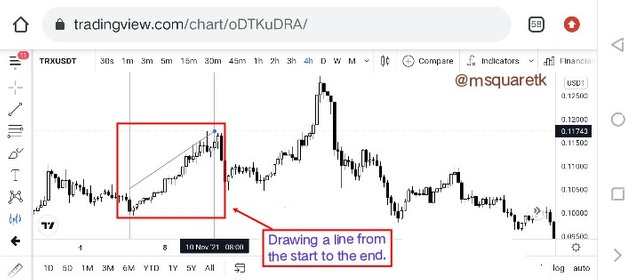
Screenshot From Trading view | SOURCE
Then, once we have drawn from the start to the end. We click on ok by tapping the screenshot and the pattern will be drawn on the chart. See the screenshot below.
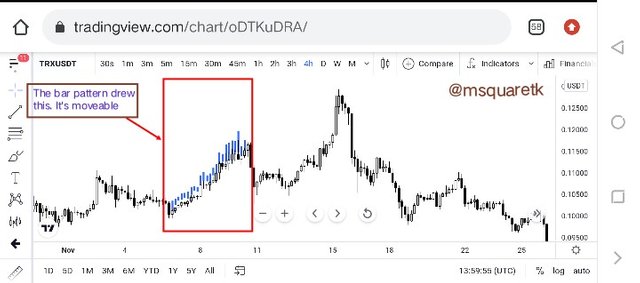
Screenshot From Trading view | SOURCE
Next is to move this pattern to a suitable position. The goal is, we want to use this drawn pattern on another pattern to see the similarities between them. That's we want to know whether the patterns are similar. So, we are going to move the pattern to a suitable position first. See the screenshot below.
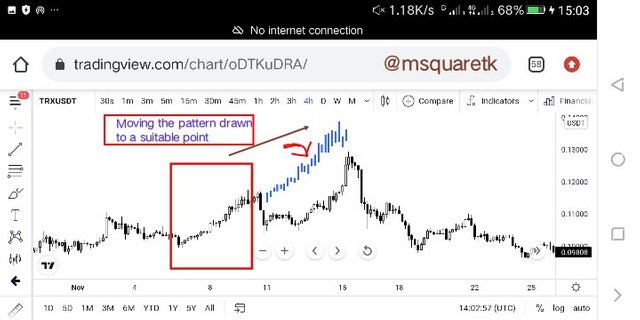
Screenshot From Trading view | SOURCE
Then, next thing is to place this pattern on the one we want to compare it with. In the screenshot below, you will see how I placed this pattern on it. As it will be seen on the screenshot, the pattern almost matched. It's about 95% matched. See the screenshot below.
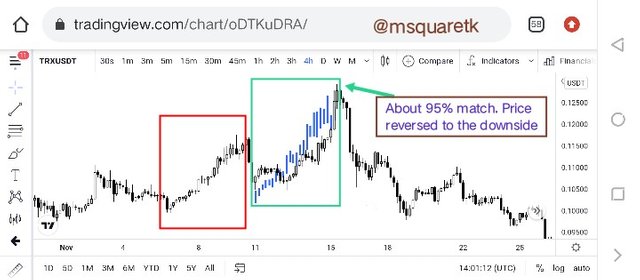
Screenshot From Trading view | SOURCE
In the screenshot above, we saw how the price reversed. This means, fractal can help us determine the reversal of price in the market. We can also use different technical indicators to explore fractals.

5. Do a better Technical Analysis identifying Fractals and make a real purchase of a coin at a suitable entry point. Then sell that purchased coin before the next resistance line. Here you can use any other suitable indicator to find the correct entry point in addition to the fractal. (Usually, You should demonstrate all the relevant details including entry point, exit point, resistance lines, support lines or any other trading pattern)

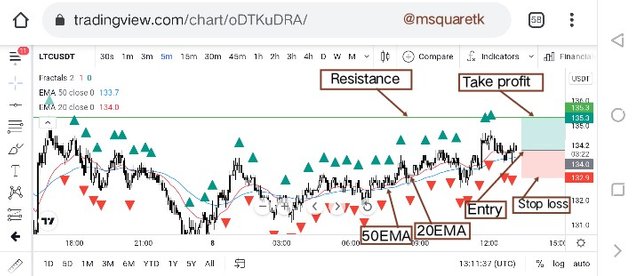
In this part of the question, I am going to be analysing a pair using Williams Fractal Indicator and exponential moving average. I am going to be analysis LTCUSDT. Now, to use the strategy, the first I did is that I added Williams fractal indicator to the chart as well as the exponential moving averages I would use. For this task, I used 20 EMA and 50 EMA.
Now, we are already know that Williams Fractal Indicator shows buy and sell fractals. When the red arrow shows below the price, that signifies a buy fractal and when green arrow shows above the price, that's a sell fractal signal. In addition to that, we use exponential moving averages 20 and 50 to filter the signal. For bullish trades, 20EMA must above the 50 EMA and price will be seen trending up. And for bearish trades, 20EMA should be below 50EMA.
In the screenshot below, you will see that I have a setup for buy. Firstly, I saw on the chart of LTCUSDT that 20 EMA (red line) is above the 50 EMA (blue line). That confirms that the trend is bullish. Also, you will notice that a red arrow pointing towards upside appeared below the price. That's a buy fractal signal. Upon seeing that, I placed a buy entry.
Screenshot From Trading view | SOURCE
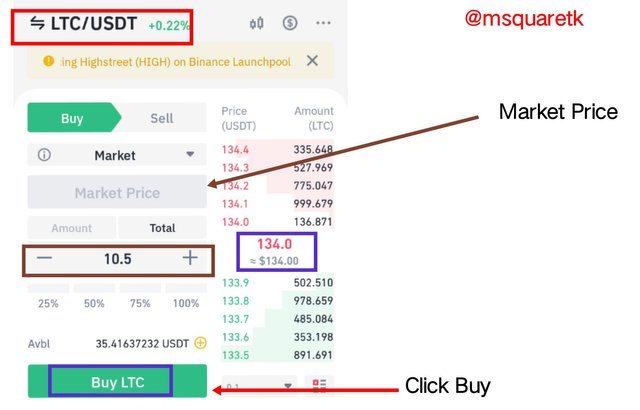
I placed a buy entry using my binance verified account. The entry price is 134.0 and stop loss is 132.9 and take profit is 135.3 which is the nearest resistance level to the place. The screenshot below shows the buy position on binance.
Screenshot from my Binance App
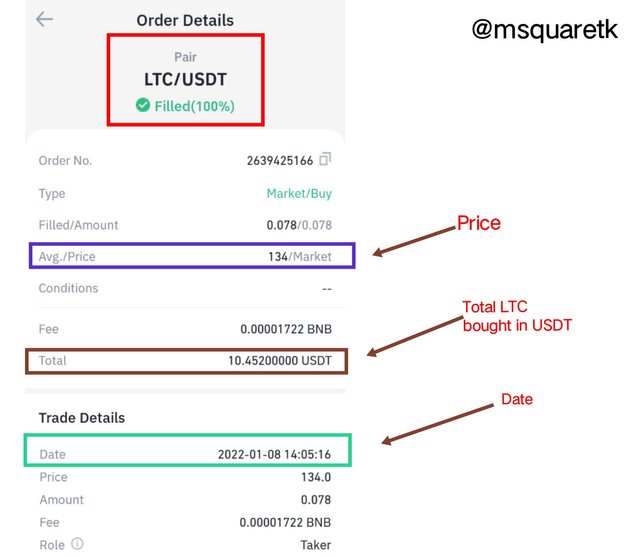
Then, upon placing a buy entry at a market price of 134.0, the order got filled immediately. In the screenshot below, you will see the details of the order. The price at which I bought, the date, the amount of LTC I bought in USDT and many more.
Screenshot from my Binance App
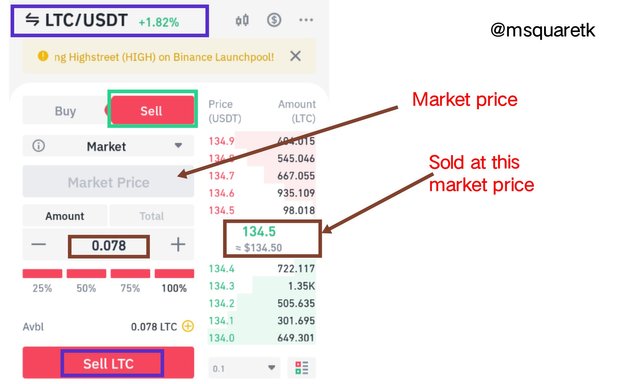
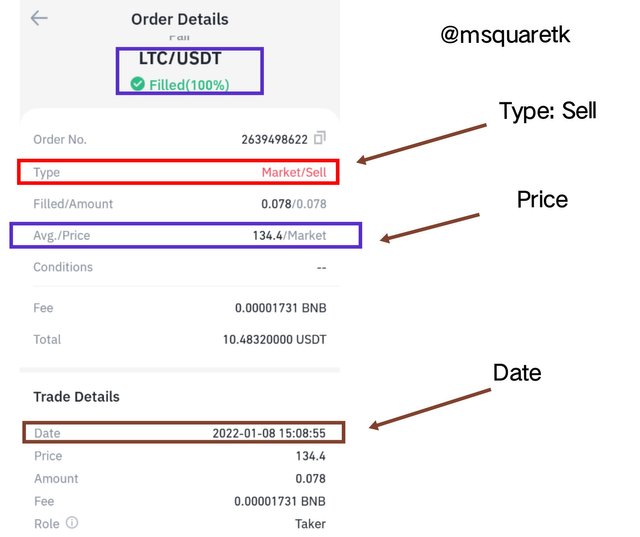
As requested, I'm going to be selling the asset back. We are to sell the asset before the next resistance level. In my case, the resistance I have identified is around the level of 135. Now, the trade has gone in the predicted direction. Hrnce, I will be selling back the asset at 134.5. See the screenshot below.
Screenshot from my Binance App
Then, upon filling every detail, i placed a sell order. Of course I sold at the market price. The screenshot below shows the order details of the season order.
Screenshot from my Binance App

Conclusion

Many important tools and strategy have been used by traders to predict the movement or direction of price. Of course, what we want to know is how price will move so we can position ourselves in line with it to take advantage and be profitable. Fractals ate also good tools which we can use to predict the movement of price. There are many indicators which have been developed or created to identify fractals in the market. The popular one being Williams Fractal Indicator. In this task, i have explained some of these Indicators.
Thanks to Professor @reddileep for this insightful lecture. I have not only learnt theory, but have also praticised what i have learnt. Thank you for your effort in delivery quality content. See you in the next season, but before then, stay safe.

NB: All unsourced screenshots were taken from my Binance App
CC: @reddileep
Written by @msquaretk