
Cover page created by me, @msquaretk | created with Canva app
We are in the sixth week of the season 4 in Steemit Crypto Academy. The past five weeks have been full of experiences and knowledge from Professors. I am glad I am participating in the academy.
This post is written in response to Professor @lenonmc21's assignment. He taught "Basic “Price Action” Strategy EMA + Trend Line Break". He explained the topic very well and how we can trade with the strategy. So, in the next paragraphs, I am going to be answering the questions one after the other. Follow me closely.

THEORY
Question 1
Define and Explain in detail in your own words, what is the EMA Strategy + Breakout of the Trend line?
EMA Strategy + Breakout of the trend line is a basic price action Strategy which comprises of EMA (Exponential Moving averages) of 100 period and the trend line. EMA of 100 periods is placed on the chart to help determine the trend of the market. As we know that moving average is a trend-based indicator. So EMA 100 is used in the strategy to determine the trend. When the price is above the EMA 100, the market is said to be in an uptrend and when the price is below the EMA 100, the market is said to be in a downtrend.
The trend is used to to connect the maximum and minimum point of the price of the retracement leg of the main move. When the price breaks the trend line, it signifies that the retracement leg is over and that the price will continue the impulsive leg. Impulsive move or leg is the movement of price in the main direction. For example, wave 1, 3 and 5 are impulsive move of the Elliot wave and are known as the main trend. While wave 2 and 4 are corrective or retracement leg. Trend line will be used to connect the maximum and minimum points of wave 2 or 4 and when the trend line breaks, then we can place a but or sell depending on the trend we are.
In essence, to use the strategy, EMA of 100 periods will be placed on the chart and when the price is above the EMA, that means the market is bullish and we will look for retracement leg and connect the maximum and minimum points of the price together with a trend line and wait till the trend line breaks to the upside and then place a buy trade to join the main trend. On the other hand, when the price is below EMA, then the market is bearish, the trend line will be used to connect the minimum and maximum points of the retracement leg, and when it breaks, a sell order will be placed to join the main trend.
See the screenshot below.

Fig. 1: Illustration of EMA + Trend line break Strategy in Downtrend | Mt4 Platform
As it can be seen in the screenshot above, 100 period of EMA is placed and the price is below it, that mean the market is bearish, then a trend line is used to connect the maximum and minimum points of price of the retracement leg. The trend line broke and the price continued in the main trend.

Question 2
Explain in detail the role of the 100-period EMA in the EMA + Trendline Breakout Strategy?
In this part of the question, I am going to explain explain the role of 100-period EMA in the EMA+Trendline breakout Strategy.
Now, EMA means, exponential moving average. Exponential moving average is a type of moving average which is more accurate in predicting the trend of an asset. You would have heard a saying that "trend is your friend, don't go against it" . The success of any trade is dependent on trend. If the trend is known, there's high probability that the prediction will be right.
The role of 100-period EMA is for the trend identification or determination. When you first open a chart, the first thing you will want to look at is trend. You will want to find out what trend the market is; is it a bullish trend or a bearish trend. The reason is, if you don't know the prevailing trend, you may end up not predicting right. Traders use just main sight to view which trend the market is by looking at the highs and lows of price. However, there are tools which help determine the trend without stressing ourselves too much. One of the most popular tools for this is moving average. So, In essence, 100-period EMA is basically used to determine the trend the market is.
Now, how do you know which the trend with this indicator? Simple! When the price (represented by candlesticks) is above the 100-period EMA, the market is said to be in an uptrend or bullish trend. And when the price is below the 100-period EMA, the market is said to be in a downtrend or bearish trend. By a way of emphasis,
Price above EMA = Bullish Trend
Price below EMA = Bearish Trend.
See the screenshot below.
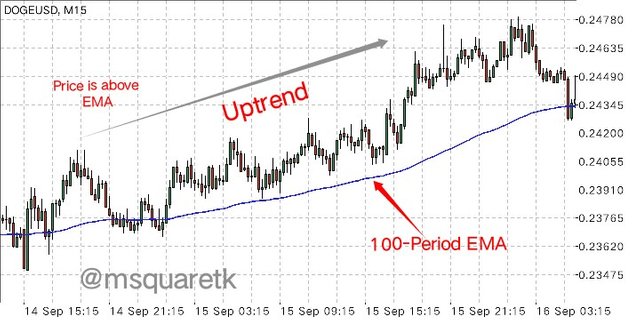
Fig. 2: 100-period EMA in an Uptrend | Mt4 Platform
In the figure above, you can see that the 100-period has been added to the chart and the price, the candlestick is above it. This means that the trend at that time is bullish. So, traders will know that the trend is to the upside when price appear above the EMA.
Let's see the screenshot of a downtrend.
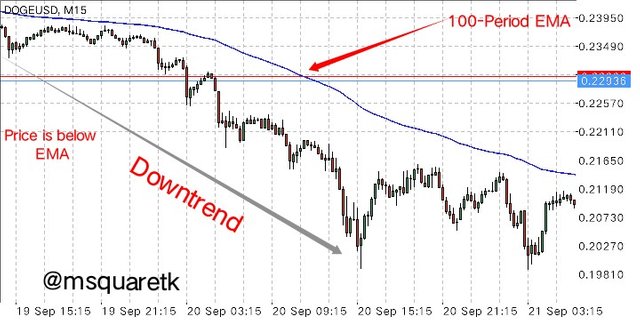
Fig. 3: 100-period EMA in a Downtrend | Mt4 Platform
Also, we can see that the price appear below the EMA and the momentum is to the downside. That means the trend at that time is bearish.
The importance of 100-period EMA cannot be overemphasized is EMA + tree line break strategy as it has the traders to know the trend the market is. And, knowing the trend is very important in using the strategy. The first thing to know when you want to use the strategy is trend because we are going to be trading the prevailing trend, that's the trend which has the great momentum. If this is not known, the success rate is not guaranteed.

Question 3
Explain in detail the role of the "Trend Line" in the EMA + Breakout Strategy Trendline Breakout?
Trend line is one of the things technical tools that is very useful. Traders use trend line to connect the higher lows to show that the trend is bullish and, if the two or more of these higher lows are joined perfectly, that means the trend is an uptrend. And in the case of of bearish, the lower highs are joined together.
Now, the trend line in EMA + Trendline break strategy is used to connect the maximum and minimum points of price together. The purpose of using it is to Know when the retracement leg will be over so as to trade the continuation of the prevailing trend.
In the figure below, I illustrated how the trade line is used to connect the minimum and maximum point of price in the retracement leg.

Fig. 4: Illustration of Trend line to connect minimum and maximum point of the retracement leg | imarkup app
Now, it is important to know that, the trend line is used to so that the short term trend can be known and to know when it will be over.
In a bullish trend, the impulsive move is to the upside and the retracement leg or corrective move is to the downside. Then the lower highs of the that retracement move will be connected together with a trend line. And once the price breaks it to the downside, it's a signal that the retracement is over and the continuation can be traded.
Also, in a bearish trend, the impulsive move is to the downside and the corrective move, the counter trend, is to the upside. Here, it is the higher lows of the retracement move that will be connected with a trend line. Then, we will wait till the price breaks the trend line to the downside and then the continuation of the bearish trend can now be traded.
But for the two scenarios, we know that 100-period email have been added and price must be over EMA for if you want to trade bullish continuation and price must be below EMA if you want to trade bearish continuation.
Let's see the screenshot below.
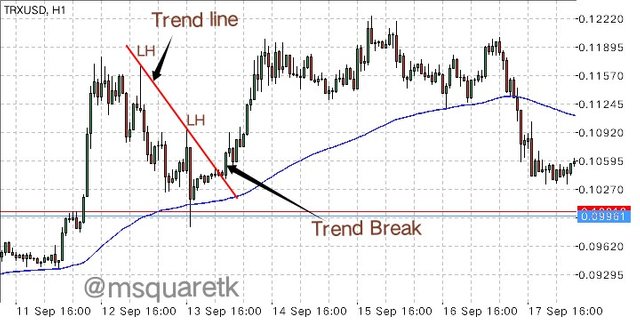
Fig. 5: Trend line connecting minimum and maximum points of price of the retracement leg in an uptrend market | Mt4 Platform
We can see how the trend lime is used in the screenshot above for a market in the bullish trend. See the screenshot below for a bearish market.
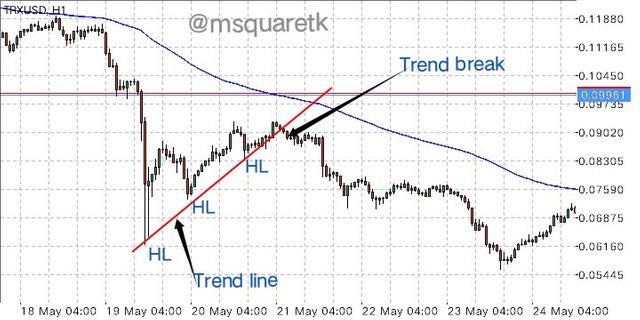
Fig. 6: Trend line connecting minimum and maximum points of price of the retracement leg in a downtrend market | Mt4 Platform

Question 4
Explain the step-by-step of what needs to be taken into account to execute the EMA + Trendline Breakout strategy correctly?
Now, in this part of the question, I am going to explain the step by step of what needs to be taken into account to execute the EMA + Trend line breakout strategy.
Now, before I go into explaining the steps, let me emphasis that the strategy is a combination of 100-periods Exponential moving average and the use of trend line.
In order to use this strategy correctly, the following steps should be properly followed.
Step 1: Add 100-period EMA to the chart.
The first thing you need to do if you want to use this strategy is to add 100-periods email the chart of an asset you want to trade. EMA will help you determine the prevailing trend which the market is. It is important to know this because we will be trading with the trend and not against it.
If the price is above the EMA, the market trend is bullish and the traders should be looking out to join the bullish momentum with the strategy. And also, if the price of an asset is below the EMA, the trend I bearish and the traders is expected to join the bearish momentum, as he will want to trade with the prevailing direction of the market.
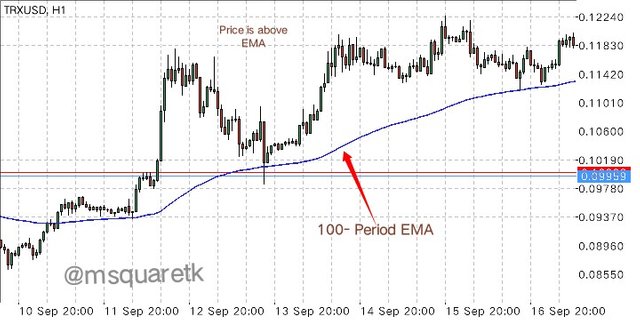
Fig. 7: 100 - Period EMA showing that the trend is bullish | Mt4 Platform
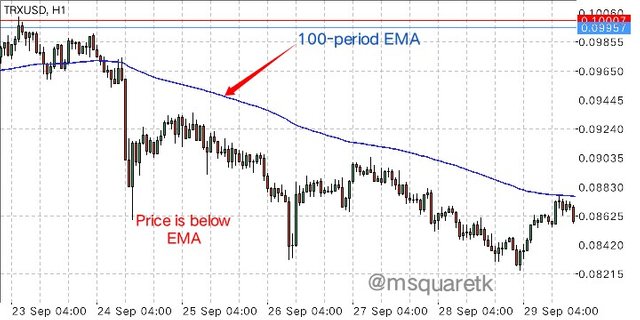
Fig. 8: 100 - Period EMA showing that the trend is bearish | Mt4 Platform
Step 2: Market Structure and Cycle
The next thing to take into consideration is market structure and Cycle. This is important, because, the structure and cycle which the market is must be known. So, if you want to trade this strategy, you need to know the structure and the cycle which the asset is, so as to predict with high level or percentage of accuracy.
We know that in case of an uptrend, the price is above the EMA, then it's expected that the price makes higher highs and higher lows if the price action is healthy. If that is correct, then the market structure and cycle is valid. Also, in a downtrend, if EMA is added and the price is seen below the EMA, we know that the market is bearish. However, if the price action is healthy, it's expected that the price keeps making lower lows and lower highs.
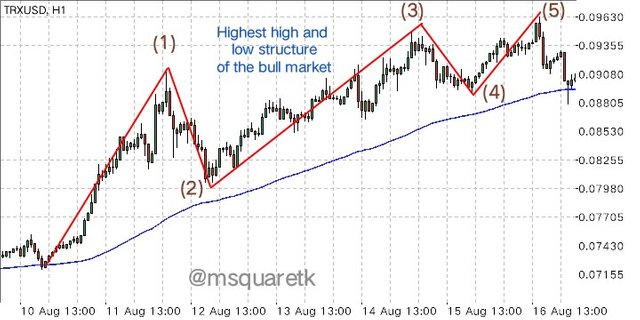
Fig. 9: Illustration of market structure and cycle | Mt4 Platform
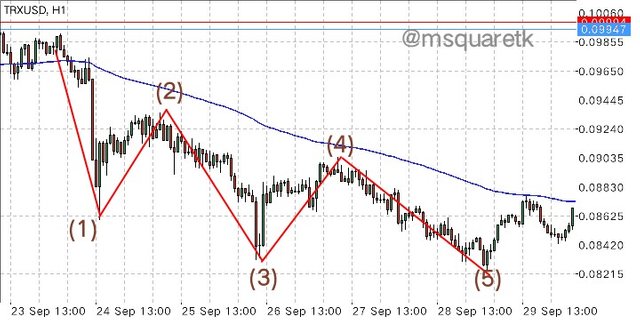
Fig. 10: Illustration of market structure and cycle | Mt4 Platform
Step 3: Drawing Trend lines.
The next thing to do after we have placed the EMA and have checked the market structure and the cycle and they are set in place is to draw trend lines to connect the maximum and minimum points or peak of price in the retracement leg of the trend.
For example if the trend is bullish, that's after being confirmed from the EMA and checked the market structure and cycle, the trend line will be drawn against the bullish trend. Which means the trend line will be drawn pointing at downside and if the trend is bearish, the trend line will be drawn in an upside direction. In essence, if the trend is bullish, the trend line will be drawn connecting the lower highs of the retracement leg together and if the trend is bearish, the trend line will be drawn connecting the higher lows of the retracement leg together.
The purpose of drawing trend line is to catch the continuation of the movement of price to the prevailing direction. Let's see the screenshot below.

Fig. 11: Trend line connecting the higher lows of the retracement leg together | Mt4 Platform
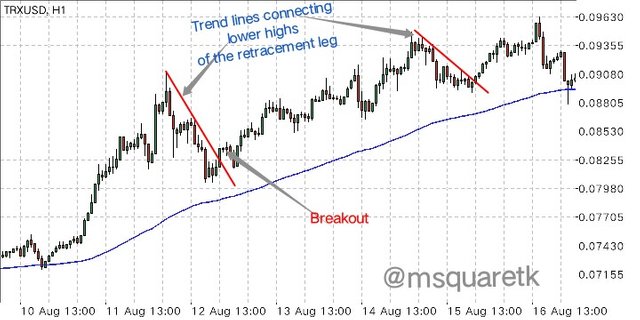
Fig. 12: Trend line connecting the lower highs of the retracement leg together | Mt4 Platform

Question 5
What are the trade entry and exit criteria for the EMA + Trend Line Break strategy?
In this part of the question, I'm going to be explaining the trade entry and exit Criteria.
Trade Entry
Now, to enter any trade with this strategy, 100-period EMA must be placed on the chart.
Look at the chart to determine the trend which the market is with 100-period EMA. If the price is above the EMA, then the market trend is bullish and if the price is below the EMA, the market trend is bearish.
Once you determine the trend of the market, the next thing is to check if the harmony of price is correct in the trend you have seen.
If the harmony is intact, then, the next thing is to draw the trend line connecting the maximum and minimum peak of the price in the retracement leg. If the market is bullish and you are looking to buy in order to join the continuation of the bullish trend, draw the trend line to connect the lower highs of the retracement leg. But if the market is bearish and you are looking for a sell opportunity, draw the trend line to commect the higher lows of the retracement leg.
Now, the next thing is to wait for the trend line to break. Once the trend line is broken, that is the signal to enter. In an uptrend, the trend line will break to the upside, then after the close of the candle that breaks it, place a buy order. In a downtrend, the tree lighting will break to the downside, then after the close of the candle that breaks it, place a sell order.
If one of the conditions is not meant, for example the harmony is not valid, we will discard the setup and wait for another configuration to form.
Trade Exit
Now, after the criteria is meant and all conditions are satisfied, we need to see stop loss and take profit.
Put stop loss below the minimum point that the price left in an up to and above the last maximum point the price left in a downtrend.
Take profit should be placed to have the same distance with the stop loss. That's it should be placed at a level to have risk ratio of 1:1.
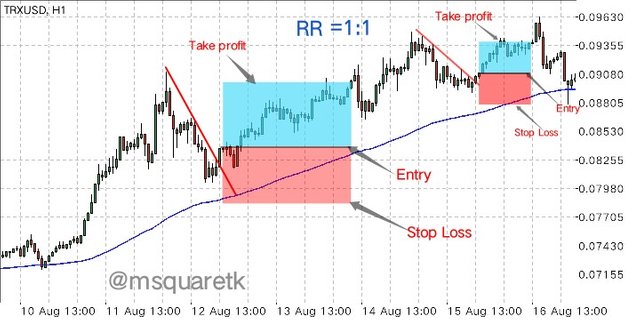
Fig. 12: Illustration of trade entry and exit in an uptrend | Mt4 Platform
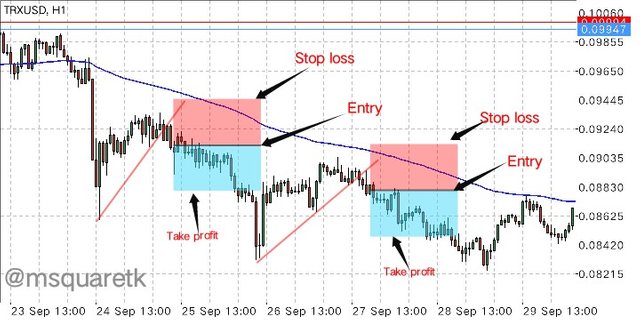
Fig. 13: Illustration of trade entry and exit in a downtrend | Mt4 Platform

PRACTICE
Question 1
Make 2 entries (One Bullish and one Bearish) in any pair of "Cryptocurrencies" using the "EMA Strategy + Trend Line Break" (Use a Demo account, to be able to make your entry in real time at any timeframe of your choice, preferably low temporalities)
In this part of the question, I am going to use the EMA+ Trend line breakout strategy to play two trades, one buy and the the sell order. Let's start with a buy order.
Buy Order Entry
For the buy order, I am going to use DOGEUSD pair.
I added 100-period EMA to the chart. This is the first thing we must add if we want to use this strategy. Looking at the chart, I realized that the price is above the EMA which signifies that the market is bullish.
So, we will look for retracement leg and draw a trend line connecting the maximum and minimum points of price together. I did this and wait for the price to break it.
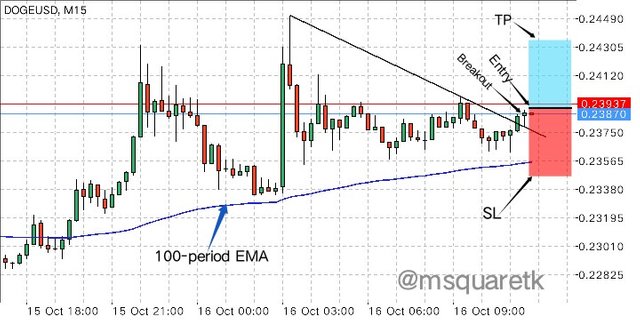
Fig. 14: Buy order on DOGEUSD chart using EMA +Trend line breakout| Mt4 Platform
Immediately the price broke the trend line, I opened an instant buy order with stop loss placed at 0.23567 and take profit at 0.24292
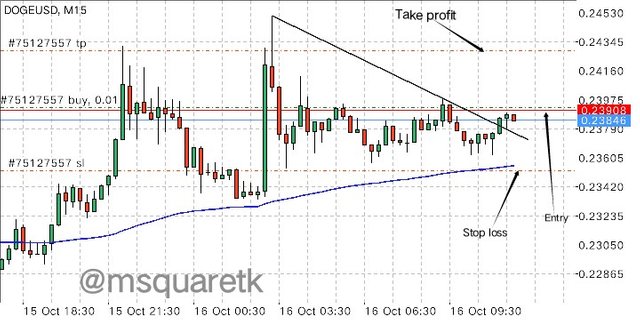
Fig. 15: Buy order of DOGEUSD showing entry, stop loss and take profit | Mt4 Platform
Now, some hours later after the execution of the trade, the trade hit my take profit successfully. In the screenshot below, you will see that I have made 59.11BIT from the buy order of DOGEUSD. You can see that the trade hit TP 15:15 on the 16th of October, 2021, which is today

Fig. 16: Buy order of DOGEUSD Result | Mt4 Platform
Now, let's see the sell order I took with this strategy.
Sell Order Entry
For the sell order, I am going to use ETHBTC cryptocurrency pair. Now, the first thing to do to confirm the trend is to add the 100-period EMA to the chart of ETHBTC. Now I did this. Upon adding the EMA to the chart, I confirmed the trend. The price is below 100-period EMA , which signifies that the trend is bearish. Then, the market structure and cycle must be intact which must be shown that the market is making lower highs and lower lows. Then the trend line must be drawn connecting the minimum and maximum points of the retracement leg. And once the trend line breaks, we will enter the sell order.
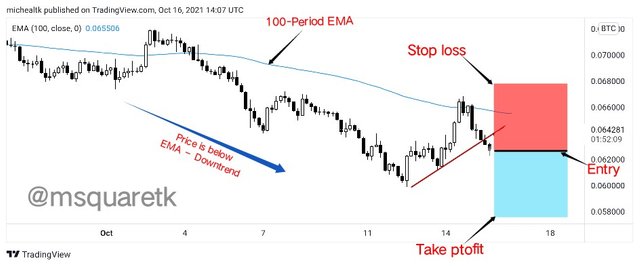
Fig. 17: ETHBTC Sell order using EMA+ Trend line breakout strategy | tradingview.com
Now, as soon as the price breaks the trend line, I entered an instant sell order at the market price of 0.06415 and stop loss was placed above the maximum high the price just left (0.06760) and take profit was placed at an equal distance as stop loss (0.05990) to have received ratio of 1:1.
The screenshot below shows the trade running immediately i placed the instant execution of sell order of ETHBTC will EMA +Trend line breakout strategy.
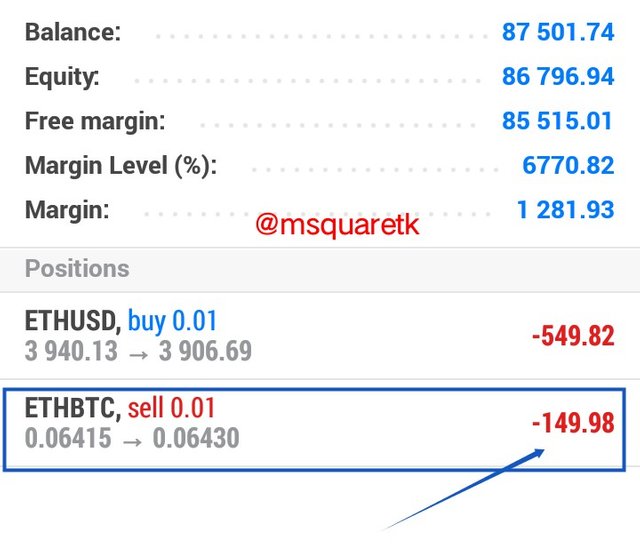
Fig. 18: Running Trade of ETHBTC Sell order Immediately I placed it | Mt4 Platform
Now, an hour after I placed the trade, I went to see how it is doing. It's doing fine already. See the screenshot below.
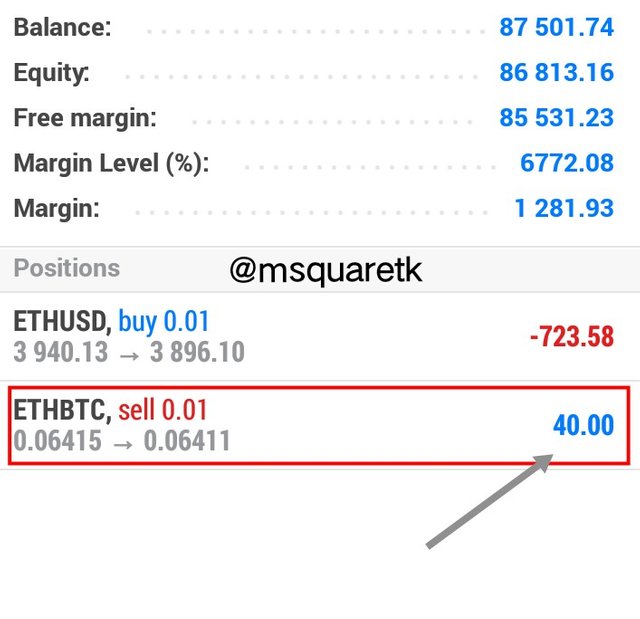
Fig. 19: Running Trade of ETHBTC Sell order after 1 hour | Mt4 Platform
Then, I still checked after 2hours 30 minutes I placed the trade. The sell has dropped compared to after 1hour. See the screenshot below.
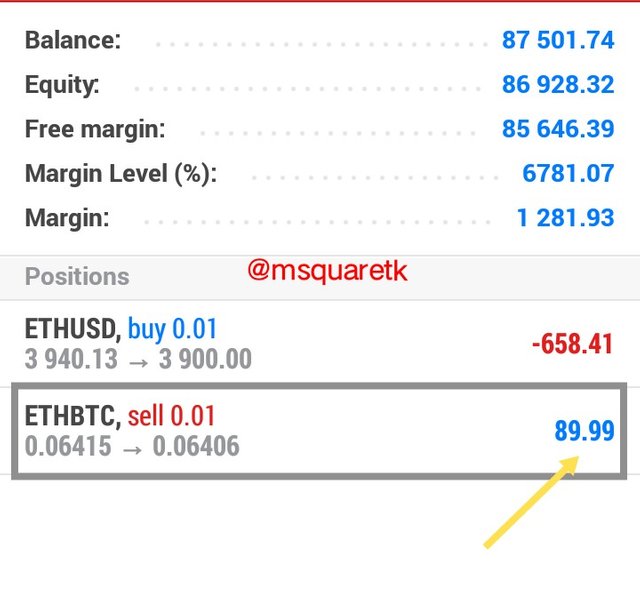
Fig. 20: Running Trade of ETHBTC Sell order after 2 hours 30 minutes | Mt4 Platform
I'm going to keep monitoring this trade to know how it will end.

Conclusion
The use of price action and other technical indicators is more effective way of predicting the direction of price than only using technical indicators. Combining two or more technical tools help trader to be confident in predicting the market as there will be confluence , that's many reasons to enter the trade. So, the use of EMA + trend line breakout strategy is an example of this. The strategy consists of 100- period EMA which is used to determine the trend in the market and trend line which is used to connect the maximum and minimum points of the retracement leg, the counter or short term trend of the prevailing trend.
This strategy is very simple and easy to understand and can help us to catch some pips I the market if it's utilized properly. Thanks to Professor @lenonmc21 for bringing this course up. I have learnt from this course. I look forward to learning more from your classes.

CC : @lenonmc21
Written by @msquaretk