Hello everyone.
It is week 7 in the Crypto Academy. The past six weeks have been full of experience in trading and blockchain. It's my pleasure to be part of the students who commenced the season from the very first week. It's been awesome.
This new week, Prof. @lenonmc21 taught a very important topic, titled "Analysis and Trading with the indicators 'Stochastic Oscillator' + 'Parabolic Sar .' " He taught the course in a very simple way. Thank you, Prof.
At the end of the lecture, Prof. asked nine (9) questions, 6 without image and 3 with images. Below are the questions:
Homework
Theory (No images)
- Define in your own words what is the Stochastic Oscillator.
- Explain and define all components of the Stochastic Oscillator (% k line,% D line + overbought and oversold limits).
- Briefly describe at least 2 ways to use the Stochastic Oscillator in a trade.
- Define in your own words what is Parabolic Sar?
- Explain in detail what the price must do for the Parabolic Sar to change from bullish to bearish direction and vice versa.
- Briefly describe at least 2 ways to use Parabolic Sar in a trade?
Practice (Only Use your own images)
- Shows a step by step on how to add the Stochastic Oscillator to the chart (Indicating the% k Line and the% D Line, the overbought and oversold zone.
- Show step by step how to add Parabolic Sar to the chart and how it looks in an uptrend and in a downtrend.
- Add the two indicators (Stochastic Oscillator + Parabolic Sar) and simulate a trade in the same trading view, on how a trade would be taken.
So, I will be attending to these questions one after the other.

THEORY (NO IMAGES)
QUESTION 1
- Define in your own words what is the Stochastic Oscillator.
Stochastic oscillator is one of the technical indicators used by traders. The indicator was invented by George Lane. He was a financial analyst.
Stochastic oscillator is used to determine the momentum of price. That is, the strength which price is moving can be determined by the use of this indicator.
The term "stochastic" in stochastic oscillator is often referred to the immediate point of price in relation to range which price is over that particular period of time.
The indicator comprises of two Moving averages, in which one is fast and the other is slow. I will talk more on this later in question two. The indicator uses support and resistance as turning point and it does that by predicting turning points of price and comparing the close of price of an asset to the range of price.

QUESTION 2
- Explain and define all components of the Stochastic Oscillator (% k line,% D line + overbought and oversold limits).
Stochastic oscillator is made up of two lines. These lines are moving averages in which one is very fast and the other is slow. The fast moving average is stochastic oscillator is often called % K line while the slow moving average is known as % D line.
% K Line
This is often regarded as the stochastic. It is the fast moving average in stochastic oscillator which equates the highest high and lowest low within a certain period of time in order to define the price range for that period.
% k line is calculated as:
%K = 100[CCP – LL] ÷[HH – LL]
where:
CCP = current closing of the price
LL = Lowest low of price
HH = Highest hig of price
% D line
This is the second line of the stochastic indicator. It is often regarded as the slow moving average.This line is very important in stochastic as it's the line that determines the generation of signal with %k line.
It is calculated as :
%D line = moving average of %k.
Stochastic oscillator has what's I known as oversold region and overbought region since it's an indicator for determining the momentum of price. The indicator is scalled from 0 to 100
Oversold Region:
The oversold region of stochastic oscillator is between 20 and 0. When the two lines of stochastic cross 20 and moves downward, then it has entered oversold. Price enters oversold region when a particular asset been in a bearish trend with a very great momentum. The sellers have have been in the market for a particular period of time. In this case, the price of a particular asset as gone as low as possible. This means that the sellers would soon be exhausted and buyers will take place in order to buy the asset at a discounted price.
Overbought Region
This region is between 80 and 100 in the stochastic scale. When the two lines of stochastic cross to 80, then it has entered overbought region. Price enters overbought region as a result of force of Strength of buyers being greater than that of sellers. The price of an asset has been in an uptrend for a particular period of time with a very great momentum.
The overbought region means that buyers have dragged the price of an asset as high as possible. This often signifies exhaustion of buyers. At this point, sellers will be setting up to enter the market since they can sell at the premium price.

QUESTION 3
- Briefly describe at least 2 ways to use the Stochastic Oscillator in a trade.
Stochastic indicator are used by traders to take trade
Traders often use stochastic indicators to take trades. When the price enters oversold, and the two lines cross in the region. In essence, when the fast line of stochastic (%k line) cross over the % D line and move upward, then traders see it as buy signal.
Also,for a sell signal. When stochastic indicators enter overbought and the %k line crosses the % D line downward, traders see it as a shift in trend and enter a sell.
Stochastic Indicator is used to exit the trade.
Just as stochastic indicators is good for entering a trade, it is also good in exit the trade. When you are in a bullish trend and you see the price of an asset enter the overbought region, it is a signal that the buyers are in exhaustion phase, then traders who are riding the bullish trend often exit the buy trade.
Also, traders who are riding a bearish trend can exit the trade when the stochastic oscillator enters the oversold region. Stochastic oscillator is very good to know when buyers or sellers are exhausted and it's when the indicator enters overbought and oversold region.
Stochastic oscillator are also used as Support and Resistance Level
The points at which the golden cross of stochastic occur in the oversold region is often regarded as a key level in the market. This place is often called support level. Traders use the point as a key level and combine candlestick pattern together with this area to see if the price has found a key area for its turning point in the past.
The point at which the golden cross of stochastic occurs in the overbought region is a key resistance level. This place is regarded as a point of supply. As a result of this, sellers take hold of the market since they have gathered enough momentum to drive the price of the market.
Therefore, stochastic oscillator is used as a resistance and support levels to take trades.
Stochastic Oscillator is used to Refine or Filter Trade Signals
This indicator is often combined with other indicators to refine the signals. It should be noted that no indicator is 100% efficient. So, in order to avoid fake-outs, traders combine indicator. Stochastic indicator as an oscillator indicator that determines the price momentum of an asset can be combined with any other indicator say, trend indicator like moving averages in order refine the signals and avoid fake-outs.

QUESTION 4
- Define in your own words what is Parabolic Sar?
Parabolic SAR simply means parabolic stop and reverse. The indicator was developed by Welles Wilder. Parabolic SAR is an indicator that belongs to trend indicator, that's, it is a trend indicator. I'm essence, it is uses to determine the direction in which price of an asset is moving. This indicator shows comprises of dots placed on the chart as price is moving per time. These dots are placed below and above the candlesticks on the chart depending on the momentum or the bias of the market.
In finance trading, where to enter a trade is as important as where to exit. No one succeeds in trading by knowing where to enter a trade without knowing where to exit. No matter how smart a trader is at entering a trade, if he doesn't know to exit, he will lose all his earnings. That is why the used of technical indicators that predict the change in trend is very important. So, PSAR is an indicator which is used to know points of reversal of price of an asset.
Parabolic SAR shows works like like moving average but that it is very fast then moving averages. It follows the price by showing the dots on the chart as candlesticks are being formed. Though, parabolic SAR is a good indicator that shows or determine trend reversal, but it should be noted that I works best with clear trends. It tends to give force signals when the market is ranging.

QUESTION 5
- Explain in detail what the price must do for the Parabolic Sar to change from bullish to bearish direction and vice versa.
In a bullish trend or market, the parabolic SAR is below the price. These dots often stay below the candlesticks on the chart. Now, the movement of price continues until a reversal wants to occur. The bullish trend changes to bearish when the price crosses the dots of parabolic SAR downward and the dots now appear above the price. In essence, for bullish trend to change to bearish, candlestick must cross over the dots downward with the aim of letting the dots be above the price.
Also, in a bearish trend, the series of dots of the parabolic SAR are position above the price of an asset. As the price falls and move downward, the dots also move toward. This movement of price and dots move simultaneously until the point of reversal in market.
Bearish trend changes to bullish trend when the price of an asset crosses the above the dots and the dots now begin to appear below the price. Immediately a dot or two appear below the candlesticks, that is the sign that the current bearish trend is changing to bullish trend. In essence, for a bearish trend to change to bullish trend, the price must move up leaving the dots must appear below the price.

QUESTION 6
- Briefly describe at least 2 ways to use Parabolic Sar in a trade?
Parabolic SAR is used to exit the trade
One of the uses of parabolic SAR indicator is that it is used to exit the trade. Traders have found it useful especially in taking profit. For example when a trader is on a long that is, buying a particular asset and sees that the dots of parabolic SAR which is usually appear below the the candlestick or price now shifts to the upside and begin to show above the price, he will know that the trend is about to change thereby exit the market or lock his profits.
Parabolic SAR are also good indicator to take trade
Traders who use parabolic SAR to take trade often combine it with other indicators. And it is believed that the area where the dots shift either to downside or upside is a point of reversal which is often regarded as support and resistance level. At these places or levels (support and resistance), when the traders see that the price has used the area for its turning points in the past, they position themselves and take trade based on their analysis which they have done. So, parabolic SAR is a good indicator to take trade for traders who have learnt how it should be used.
Parabolic SAR is used as a complement to other indicators.
Traders often use parabolic SAR to complement other indicators in oder to filter the trades so as to avoid fake signals or fake out. Some of the best indicators which are often combined with parabolic SAR are stochastic oscillator, relative strength index, moving averages etc.

THEORY (ONLY USE YOUR IMAGES)
QUESTION 1
Show a step by step on how to add the Stochastic Oscillator to the chart (Indicating the% k Line and the% D Line, the overbought and oversold zone.
To add stochastic indicator to the chart, go to trading view.com. You can use any platform, but I'm going to use trading view. Click on the drop down menu in the homepage. A pop features will appear, click on the the chart.

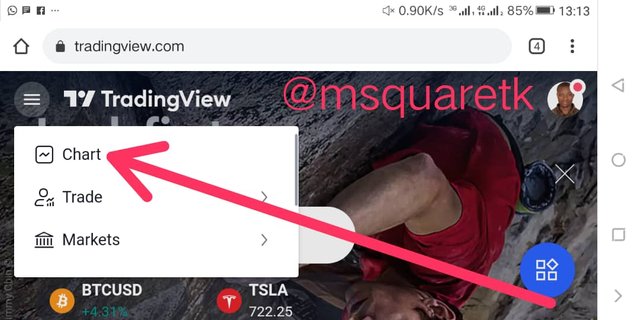
- Upon clicking on the chart, a page will load where you will see the chart open for you. Navigate to the top of the chart and look for "fx Indicators." Click on it. On the search box, type "stochastic" and click on the first result once.
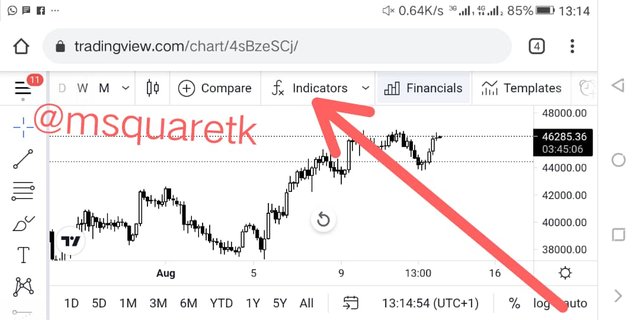
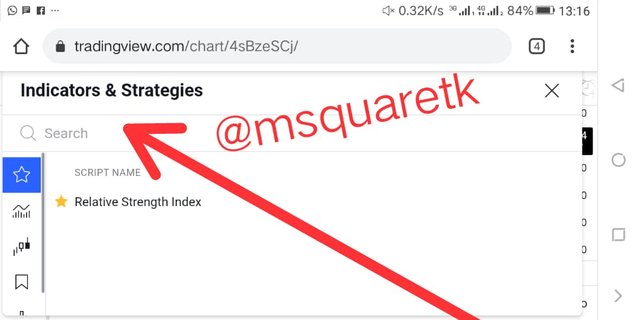
- Then stochastic indicator would have added to the chart. Let's go back to the chart if to see the indicator. Tadal! The indicator has been added. See the screenshot below.
The bottom of the chart shows stochastic indicator on the chart.
You can also edit the Indicator by clicking on it. Then you click the "gear-like-icon", the setting and do the editing
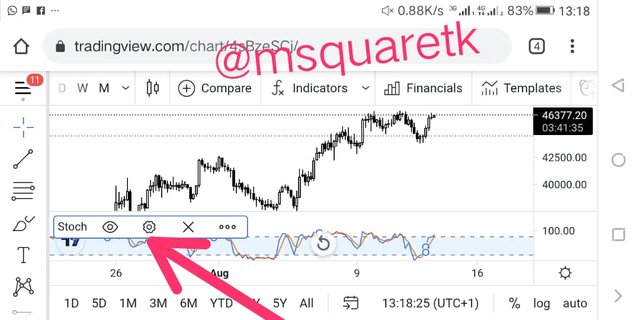
Fig. 3: Stochastic indicator on the Chart
- Once you click on the setting, you will see three features which can be edited, the input, style and the visibility. But for me, I'm leaving everything as default
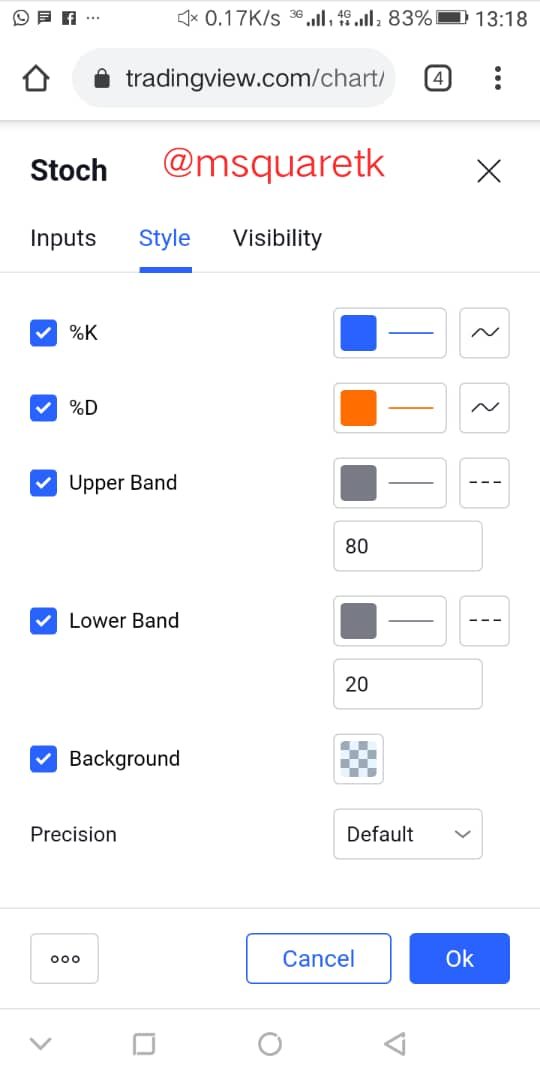
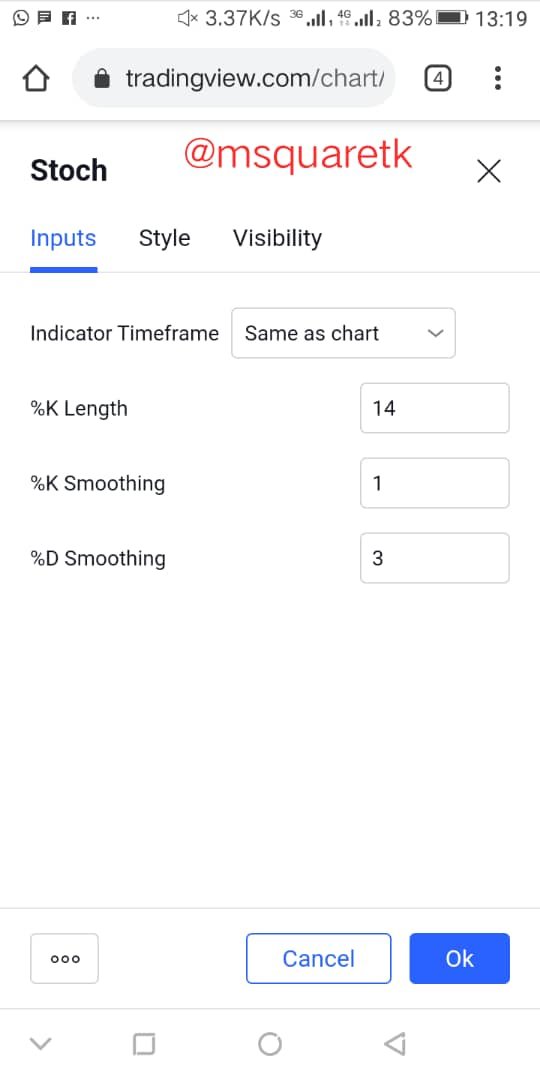
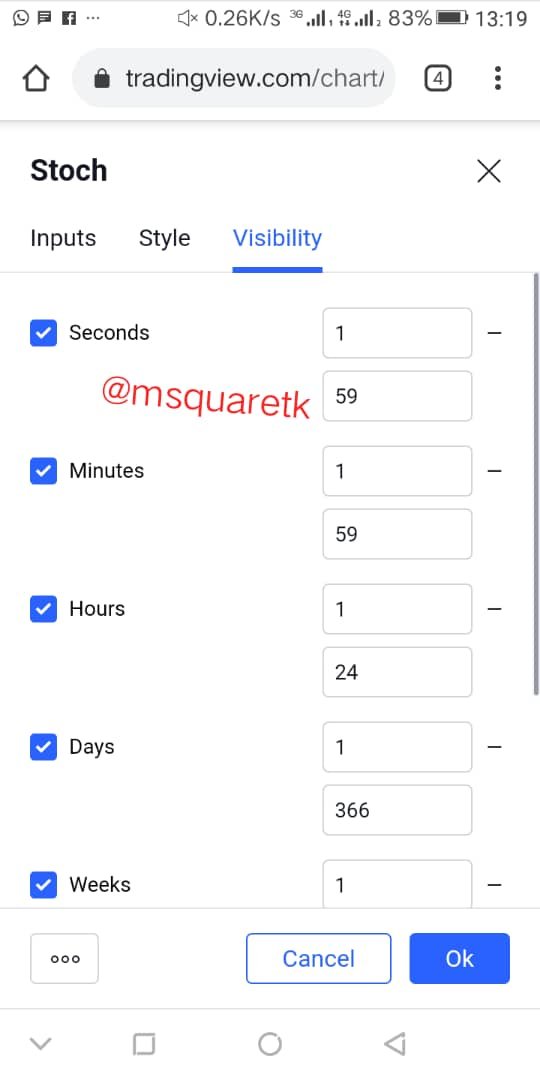
Fig. 4: Input, Style and Visibility Setting
That being said, Let's now proceed.
- In the screenshot below, I have indicated oversold and overbought region, %K and % D line of the stochastic. Let see the image below.
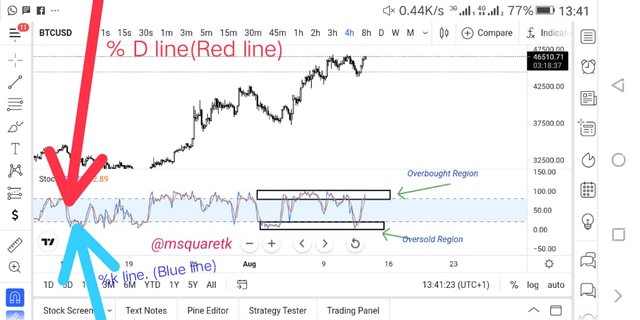
Fig. 5: Stochastic Indicator showing, Oversold, Overbought, % K and % D line

QUESTION 2
Show step by step how to add Parabolic Sar to the chart and how it looks in an uptrend and in a downtrend.
To add parabolic SAR to the chart, click on "fx Indicators" at the top of the chart just as we did for Stochastic. Now this time around, you will search for parabolic SAR in the search box. Click on the "Parabolic SAR" once.
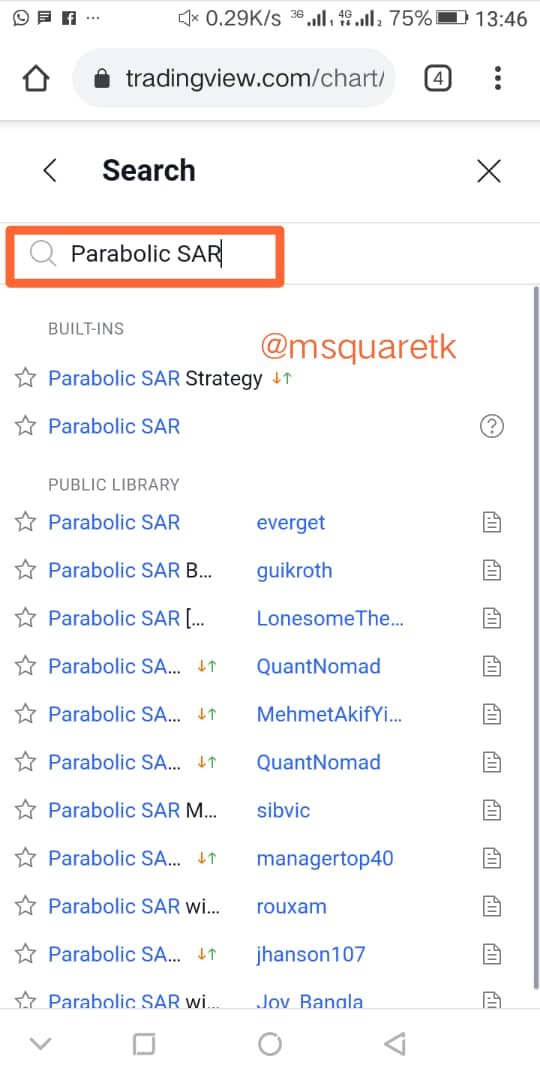
Fig. 6: Searching for Parabolic SAR
- Once you click on it, it will be added to the chart. Let's see this indicator on the chart.
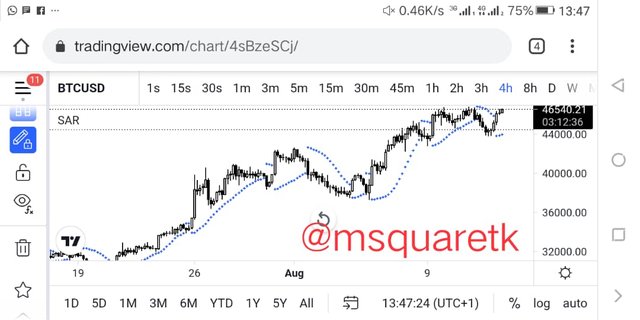
Fig. 7: Parabolic SAR on the Chart
- This indicator can also be edited. You can do this by clicking on the "dots"in the chart or "SAR" at the top left side of the chart. Once you click on it, a pop features will show with three icons. The "gear-like-icon" is the setting. Click on it.
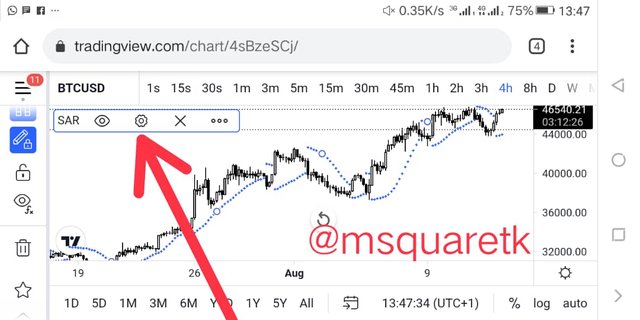
Fig. 8: Paraolic SAR setting icon
- Upon clicking on the setting, you will see three features, input, style and visibility. You can edit it to fit your trading strategy. But I'm leaving all as "default"
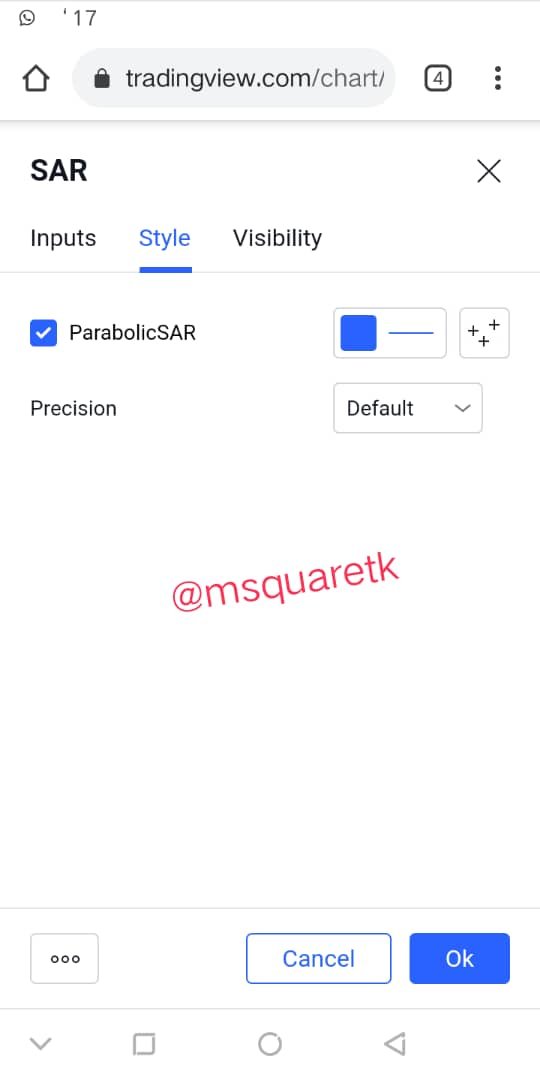
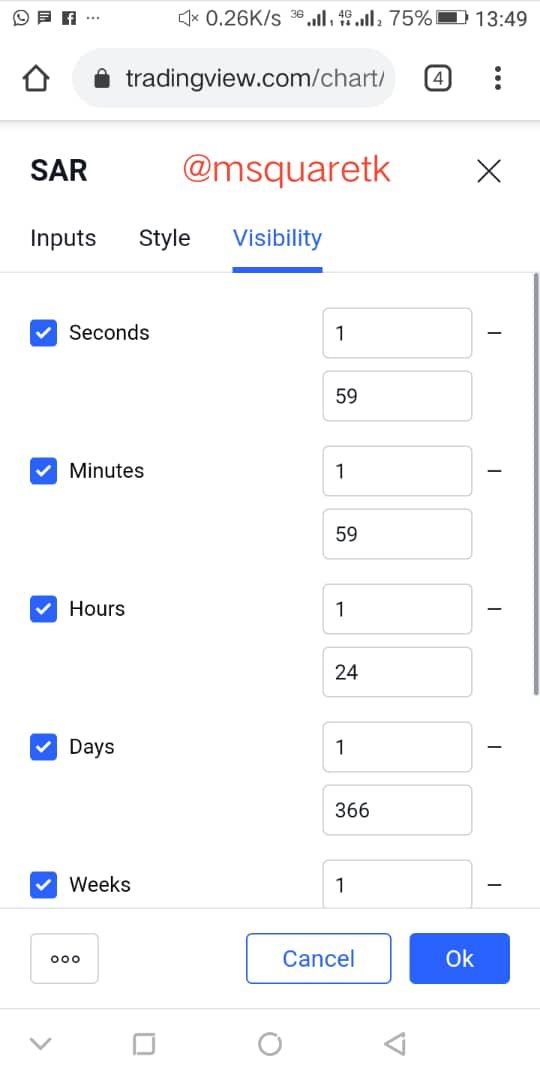
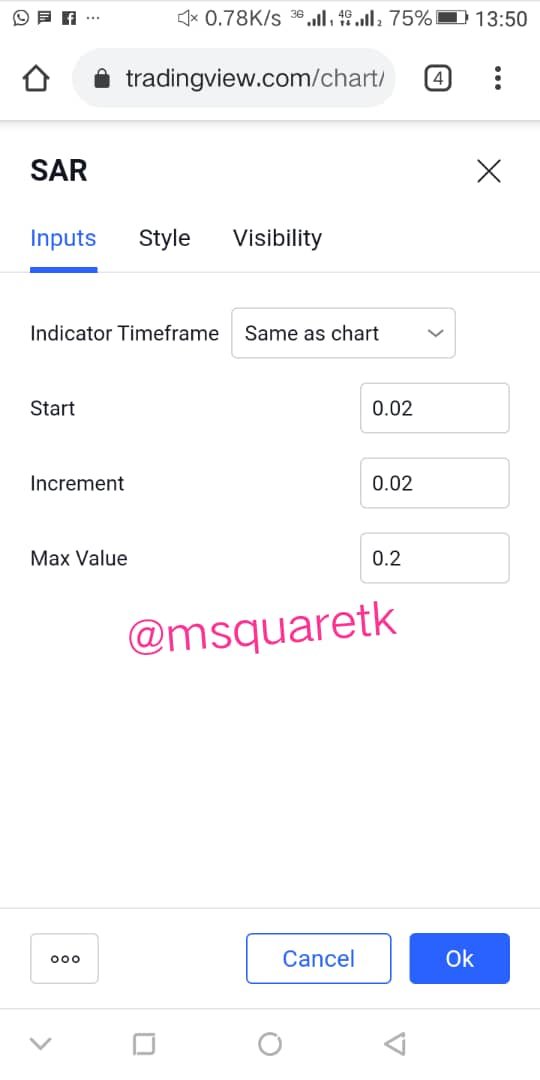
Fig. 9: Parabolic SAR Input, Style and Visibility Setting
That being said.
Let's see the Parabolic SAR in uptrend market and Downtrend Market.
The image below shows the parabolic SAR in an uptrend market.
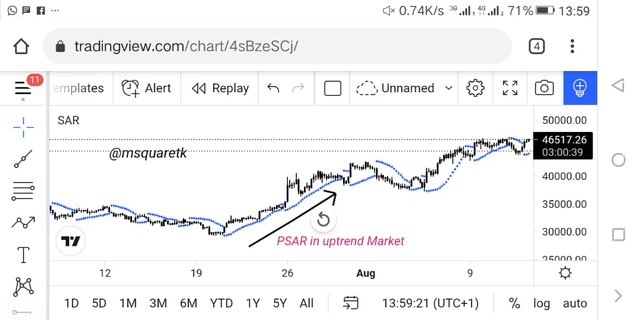
Fig. 10: Paraolic SAR in an Uptrend
As it can be seen in fig. 10, the parabolic said dots are below the candlesticks. This means the price is above the the parabolic SAR.
Let's see parabolic SAR in a downtrend. Below is the image showing Parabolic SAR in a downtrend market.
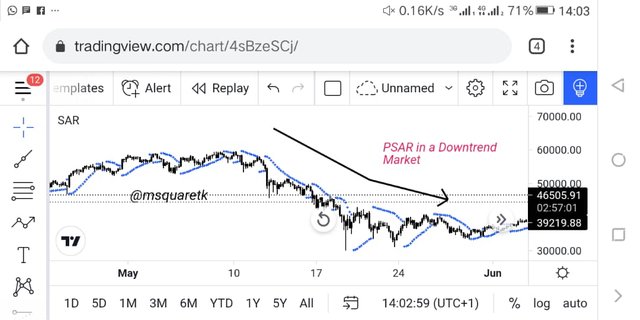
Fig. 11: Paraolic SAR in a Downtrend
As seen in fig. 11 above, the dots of PSAR are above the price. This means, in a downtrend, the dots are positioned above the price.

QUESTION 3
- Add the two indicators (Stochastic Oscillator + Parabolic Sar) and simulate a trade in the same trading view, on how a trade would be taken.
Since I have discussed above on how to add the indicator to the chart, this will be very simple. But someone will say, how do we add two indicators. Simple! You do it the same way we discussed above. Parabolic SAR will appear on candlesticks chart and the stochastic oscillator will appear below the candlestick chart.
Let's see the image below. This image shows the two indicators added to the chart and the trade simulation.
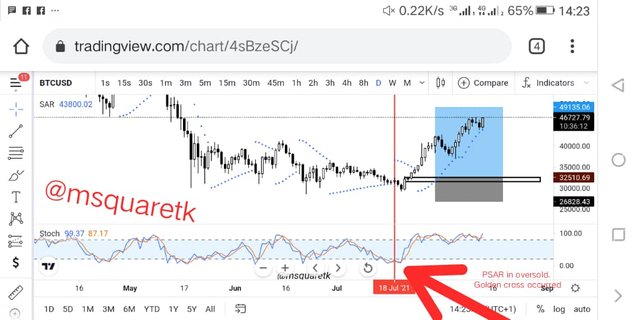
Fig. 12: PSAR and Stochastic oscillator on the Chart
In the fig. 12 above, we can see that the market has been in a downtrend with series of lower lows and lower highs. At a point, Stochastic oscillator, enter oversold region, and after sometimes in this region, golden cross of the %k line and % D line occurred. This is showing that the sellers are exhausted and that the buyers are stepping in the market.
Also, immediately, after the stochastic oscillator lines crossed, parabolic SAR above gave its own signal. The dots of PSAR appeared below the candlesticks. And we know that "PSAR below the price" indicates that the the trend is uptrend.
So, as soon as two dots of Parabolic SAR appeared below the price, one can enter a buy. In the fig. above, I did a simulation of buy trade after the dots appeared below the price and put the stop loss immediately below the current low and One can manage the trade until PSAR appear above the the price.

CONCLUSION
Indicators are technical tools which traders use to predict the movement of price. They are various types of these indicators. There are those which work with trend and those who are used for momentum.
Stochastic oscillator I one of the most popular indicator because of its uniqueness. It is a trend indicator which traders often use to predict the start of a trend and the end of a trend. Parabolic SAR is a type of technical indicator which is used to determine the point of reversal of an asset.
When indicator are combined, they are even more accurate because fake outs can be easily detected. Thanks to Professor @lenonmc21 , for the teaching. I have learnt one or two things from this course.

CC: @lenonmc21
Written by @msquaretk