
Hello everyone.
Welcome again to Week 8 in the Crypto Academy. My name is Taiwo Micheal with username @msquaretk. This post is a homework post for Professor @asaj having attended his class. This week, he taught "Crypto Assets and the Random Index (KDJ)." It was well detailed and taught a very simple way. Thank you, Prof.
That being said. At the end of the lecture, Prof. gave five questions. The questions are:
- In your own words define the random index and explain how it is calculated
- Is the random index reliable? Explain
- How is the random index added to a chart and what are the recommended parameters? (Screenshot required)
- Differences between KDJ, ADX, and ATR
- Use the signals of the random index to buy and sell any two cryptocurrencies. (Screenshot required)
So, I will be attending to the questions one after the other. Let's get started right away.

Question 1
In your own words define the random index and explain how it is calculated
Detailed Definition of Random Index
Random index is a type of technical indicator which determines the trend of an asset and gives an entry and exit points. Random Index is also known as KDJ Indicator.
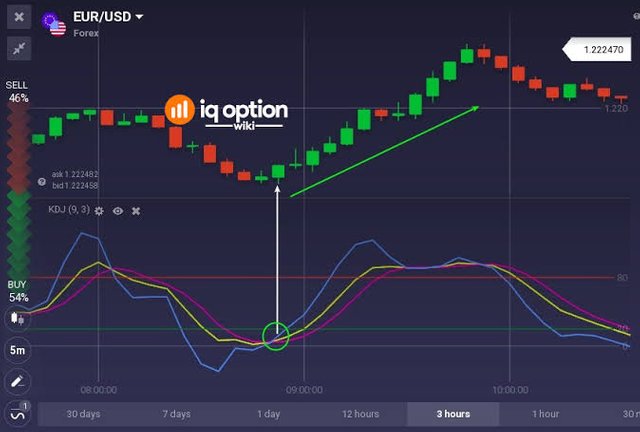
Fig. 1: Random index Indicator
SOURCE
The indicator comprises of %K line, %D line and %j line. The two lines called %k line and %D line are lines of stochastic indicator. So, it is only %j line that differentiates KDJ Indicator from stochastic. It actually gives the prediction of the trend through the shape its lines' curve.
Random Index indicator works by choosing a certain period say, 9 and documents the highest high, lowest low and closing price of an asset within that specific period. It is this result that it uses to plot the curves of the three lines, k-line, d-line and j-line.
Just as Stochastic oscillator and RSI, Random Index also has oversold and overbought region. So with this, we can say that random index Indicator shows when an asset is overpriced, very high in price or valuable and when the price is at a discounted price. The overbought of the indicator is between 80 and 100 and oversold is between 20 and 0. However, some traders use between 70 and 100 for overbought and between 30 and 0 for oversold.
Like all other indicators, this indicator is not effective when the market is ranging, doesn't have a clear trend. It works well when the market has definite trend. KDJ indicator gives market signal fast when the trend is clear.
Random indicator gives the best trading signals when the price of an asset is oversold or overbought.
How Random Index is Calculated
The calculation is based on the principle that, at a specific period, random indicator uses the highest price, lowest price and the closing price of an asset to calculate the value of k-line, d-line and j-line.
In calculating KDJ, there are about four values which must be calculated. These are: K value, D value, J value and RSV value.
RSV means immature random index value.
The formula for calculating Rsv is:
N-day RSV = (CN LN) / (HN LN) × 100
Source
Where
CN = Closing price in nth day
HN = Highest price in nth day
LN = Lowest price in nth day
K value, D value and J value can be calculated using the formula listed below
K value of the day = 2 / 3 × K value of the previous day + 1 / 3 × RSV of the day
D value of the day = 2 / 3 × D value of the previous day + 1 / 3 × K value of the day
J value = 3 * k value of the day - 2 * D value of the day
Source
In the formula of K and D value above, you notice we have previous K value of the previous day and D value of the previous day. It is often recommended to use 50 in case the values are not known.

Question 2
Is the random index reliable? Explain
To say an indicator is reliable or not depends on the individual's trading strategy. Indicators are invented to predict to some degree of accuracy the movement of price. One of the major factors that proofs reliability of an indicator is how it is being used by traders.
As the technology advances, analysts often device ways in order to predict the movement of price more accurately by trying to add new things to the existing tools and also create new ones. Now, the indicator, random Index also known as KDJ Indicator was invented due to the shortcomings of stochastic indicators. The stochastic oscillator's lines, %k line and %d line doesn't not accurately show the signal points on its scale. It's on this shortcoming that KDJ indicator was invented.
The reason for modifying stochastic indicators is to be able to give more trading points and clearly shows where the trend is. So it means, KDJ indicator has had edge compared to stochastic. It should be able to predict more accurately than stochastic. On the other hand, it should however be noted that since KDJ or random index is a posterity of stochastic oscillator, it would have some of its shortcomings. Although may be minimal.
In a real sense, no indicator gives 100% accuracy. So, KDJ Indicator is also not expected to predict the trend and give market signals accurately with 100%. When a traders has learnt how to use an indicator, he will always find it reliable. For random index Indicator to be effective and reliable, a trader needs to first learn how to use it, how it works properly.
It should be noted that higher time frames is always one of the recommendations for indicators, KDJ is not excluded. When an indicator is used on higher time frames, it tends to give more valid signals than when it is used on lower time frames. Also, KDJ just like all indicators, when it is used on a ranging or flat market, it is not effective but when it used for an asset with a clear trend, it is very accurate and reliable.
Further, reliability of KDJ indicator may due to how traders have learnt to manage risk. As I have explained above, KDJ indicator gives or properly say, it determines the trend of an asset. It also gives market signals or trading points. Now, let's take for instance that KDJ gives 5 signals and 3 out of 5 turns out to be valid signals and the remaining 2 invalid. if the trader takes all the five trades with proper risk management, then the traders will still be profitable.

Question 3
How is the random index added to a chart and what are the recommended parameters? (Screenshot required)
To add random index or KDJ to the chart, I'm going to use trading view platform.
- Visit tradingview.com. Upon entering the official website on your browser, a page will be loaded right in your front.

Fig. 2: Trading view Home page / tradingview.com
- The next thing is to click on the drop down menu at the left hand side page. Once you click on it, a Pop features will appear. Click on the "chart" and wait for a page to load.
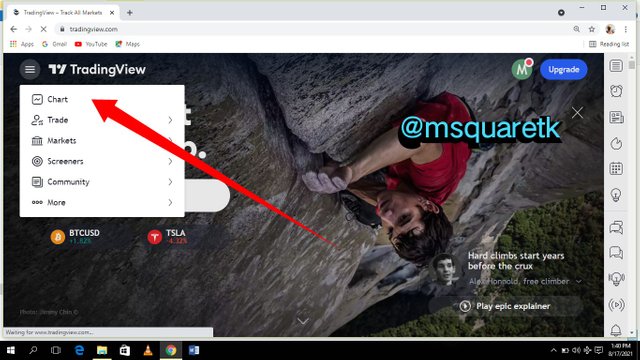
Fig. 3: Trading view Features / tradingview.com
- Then once the chart is loaded, navigate to the top of the chart and look for "fx" icon. Click on it.
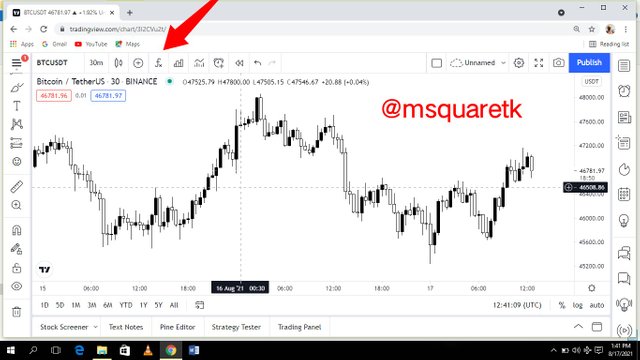
Fig. 4: Plain Chart / tradingview.com
- Then a page where you will search for the indicator you want to add to the chart will appear. In the search box, type "KDJ" indicator. Click on the first result with 1121LAMBOS21. and number 674. The user 1121LAMBOS21 is a pro trader who joined the trading view community four years ago. He's regarded as an experienced trader who is skilled in the use of KDJ indicator.
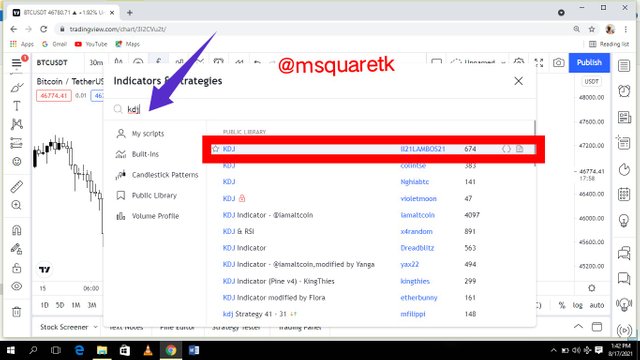
Fig. 5: Indicator Box/ tradingview.com
- Upon clicking on this indicator, it would be added to the chart. Let's go back to the chart if it has been added.
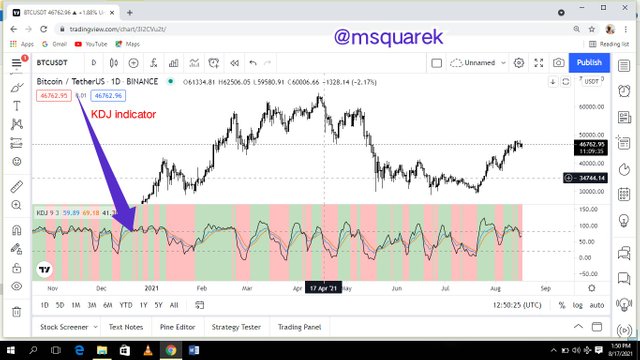
Fig. 6: KDJ Indicator on the Chart / tradingview.com
KDJ Recommended Parameters
The recommended parameter according to Prof. @asaj, is a modified KDJ indicator by the user 1121LAMBOS21 on trading view platform. He recommended his modified KDJ indicator because the trader is pro user and skilled in the use of KDJ indicator.
His modified KDJ indicator has a period of 9 and signal of 3.
For overbought region, extreme point between 80 and 100 is recommended, while between 20 and 0 for oversold.
Blue color is recommended for k-line, red for d-line, and black fo j-line.
It is also recommended that the KDJ indicator not be used on a ranging market or flat market. When it is used on a ranging market, it gives more invalid or false signals.
Also, KDJ indicator is recommended for higher time frames. It tends to give wrong signal and not reliable when it is used on lower time frames.

Question 4
Differences between KDJ, ADX, and ATR
KDJ
It is an indicator which measures the trend of an asset. It gives market signals or trading points. It comprises of three lines, k-line, d-line and j-line. KDJ is a modified version if stochastic oscillator. The k and d line in KDJ indicator is exactly the same as that of stochastic oscillator.
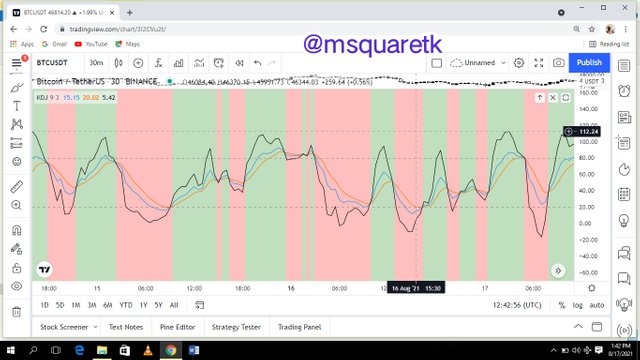
Fig. 7: KDJ Indicator / tradingview.com
The k - line is color blue , d-line color red and j-line is color black. This indicator shows when the trend wants to change phase and also gives market signals.
This indicator gives buy signal when the j-line crosses the k and d -line and rally above them, especially in the oversold zone. On the other hand, the sell signal is seen when the j-line crosses the k and d line and rally below them , especially in the overbought region.
ADX
ADX is an acronmy of Average Directional Index. It is a technical indicator which measures the strength of the immediate or current trend. This indicator is popular because of its usefulness. ADX determines how strong a current trend is.
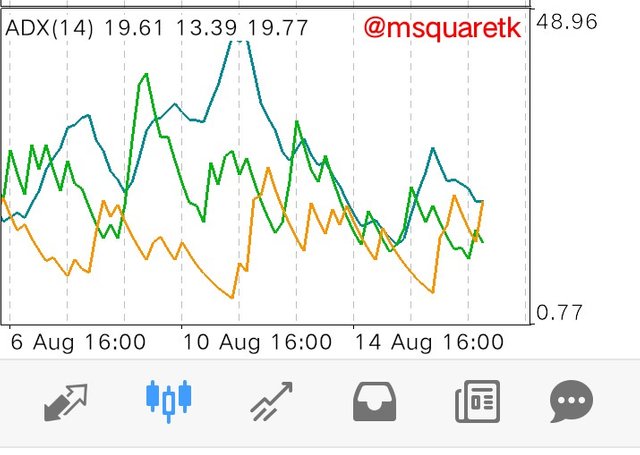
Fig. 8: ADX Indicator / MT4
When the traders see the series of higher highs and higher lows, they believe the market is in uptrend, likewise the series of lower highs and lower lows signify that the trend is bearish. But it is not enough to know whether the market is in an uptrend or a downtrend. The strength of that trend is quite important. You may enter a market in an uptrend and may just reverse and go against you if the trend is weak.
So, ADX indicator shows how strong the trend is. Like KDJ and Stochastic oscillator, ADX is also scaled from 0 to 100. But unlike KDJ indicator, ADX doesn't show if an asset is overbought or oversold. However, its level above 50 shows that the trend is strong and its level below 20 indicates that the current trend is weak.
Furthermore, when KDJ is above 70 or 80, the trend is upward but when the ADX is above 50, it means the trend is strong in respective of either it is upward or downward.
ATR
ATR means Average True Range. It is a technical indicator invented by Welles Wilder. ATR is an indicator that measures the volatility of an asset over a specific period. In essence, ATR shows how an asset moves on average for a given period of time. This indicator gives us idea of how the price of asset has been moving in relation to time.
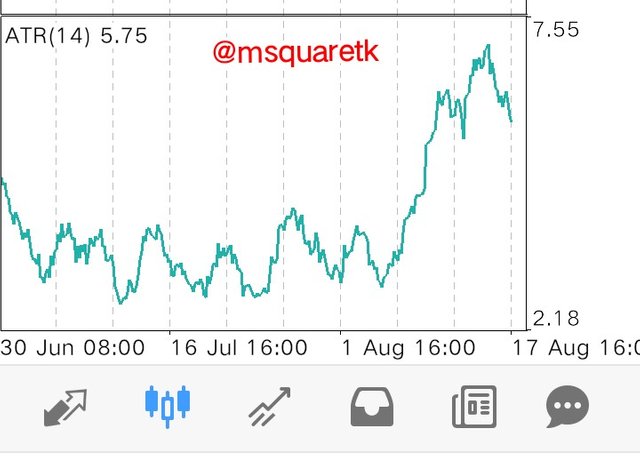
Fig. 9: ATR Indicator / MT4
This indicator is popular because traders use it to know how an asset normally moves per day. So if a trader is an intra day trader and trading a particular asset, he should know how much the asset can move in a day. That's why ATR is so useful. It will clearly shows the range which asset moves over a particular period of time.
ATR is also used to by traders to set stop loss. After traders have carefully analysed an asset and he's interested in trading it. For example, let's say a trader wants to buy a pair, he will look on the value of ATR and multiply it by 2. It's recommended that the traders multiply the ATR value by 2 and use it as stop loss.

Question 5
Use the signals of the random index to buy and sell any two cryptocurrencies. (Screenshot required)
For this task, I'm going to first use BTCUSD.
Selling BTCUSD using KDJ Strategy
Looking at the chart of BTC/USD, on a daily timeframe, the price has been in an uptrend for some times. Intra day time frames show the series of higher highs and higher lows.
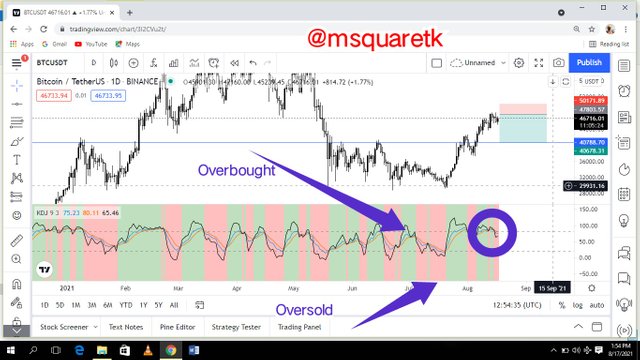
Fig. 10:Using KDJ Strategy to Sell BTCUSD / tradingview.com
As it can be seen in fig. 10 above, on a Daily TF, the KDJ indicator has entered overbought which signifies that the asset BTCUSD is overpriced, the buyers are exhausted and the sellers may take over. So, not long after it entered this region, the golden cross of KDJ indicator occurred. J-line, that black line crossed the k and d line and started going down.
Knowing that what happened is a buy signal, I placed an instant execution order for sell and put my stop loss just above the current high and take profit at the closest support zone. Let's see the screenshot below.
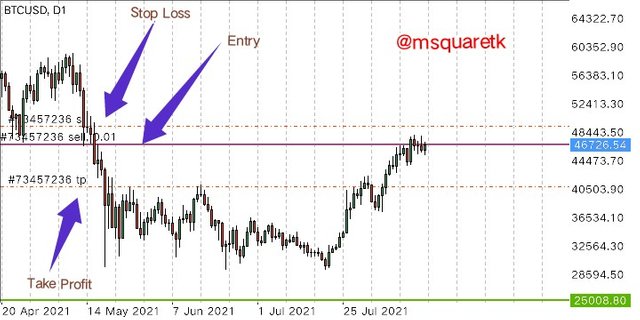
Fig. 11:Using KDJ Strategy to Sell BTCUSD / MT4
I am going to update you on how this trade goes later.
Buying LTCUSD Using KDJ Indicator Strategy
The chart of LTCUSD shows that the asset is in a bullish trend for intra day perspective. Then as it can be seen in fig. 12 below, the KDJ indicator entered oversold region and then immediately it entered, golden cross occurred.
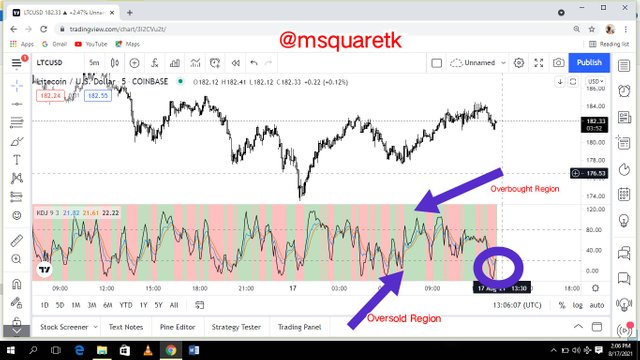
Fig. 12:Using KDJ Strategy to Buy LTCUSD / tradingview.com
Then knowing that what has happened is a buy signal, I opened a buy order on mt4 platform and set my stop loss at the current low and put take profit at a visible resistance level.
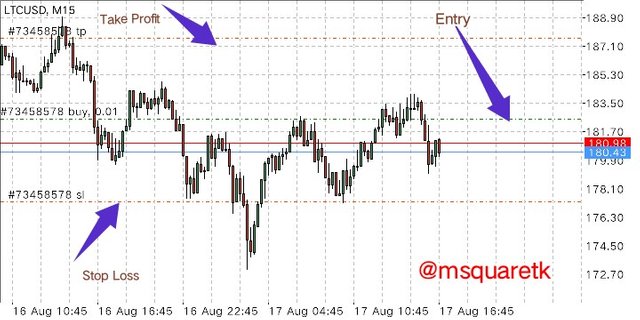
Fig. 13:Using KDJ Strategy to Buy LTCUSD / MT4
For this exercise too, I am going to update you on how the trade goes. Let's see one more example of a trade placed using KDJ Indicator strategy.
Selling ETHUSD Using KDJ Indicator Strategy
On the chart of ETHUSD, the asset has been in an uptrend for some times. It's seen clearly on intra day time frames. Then, looking at a daily time frame, KDJ Indicator entered overbought and not long ago after entering this region, the black line which is j-line crossed the k and d line and started going down. See the fig. 14 below.
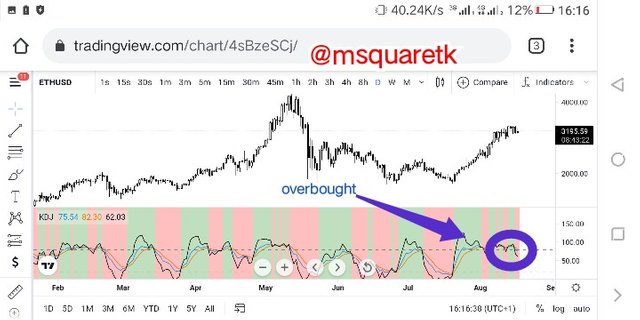
Fig. 14:Using KDJ Strategy to Sell ETHUSD / tradingview.com
As it can be seen in fig. 14 above, the KDJ indicator has given a trading signal. I can now sell the asset since I has confirmed the sell signal when the golden cross occurred. So, I opened my MT4 demo account and placed an instant execution of sell order. Stop loss was placed above the current high and take profit at the nearest support level.
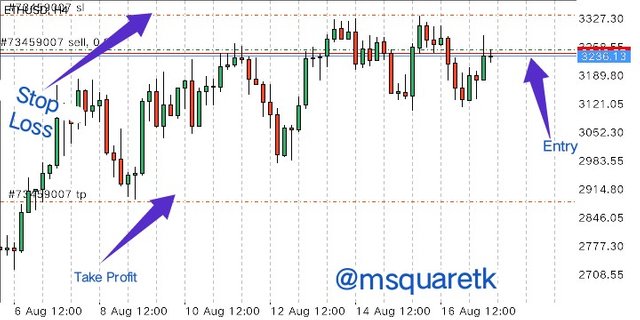
Fig. 15:Using KDJ Strategy to Sell ETHUSD / MT4
Now, some minutes after the execution of these trades, I checked my MT4 to see how the trades have been doing. In fig. 16 below, the first image from your left hand side is a trade of BTCUSD, I checked it after first minutes of execution and the middle are the three trades, BTCUSD, LTCUSD, and ETHUSD those were checked after 30 minutes of execution and the last image, that one was after 58 minutes of Execution.
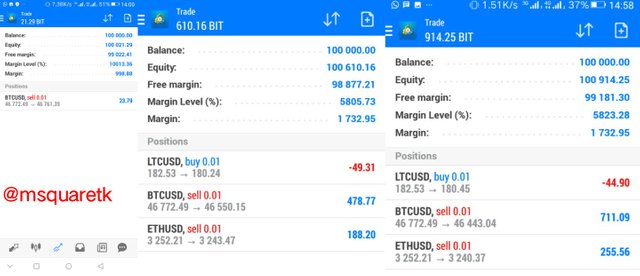
Fig. 16 : The Running Trades after 5minute, 30 minutes and 58minutes of Execution / MT4
After about 2hrs 13 minutes I executed the trades, I checked back, BTCUSD and ETHUSD have been doing well but LTCUSD has not, although it has not hit my stop loss. I still decided to be monitoring it. See the figure 17 below.
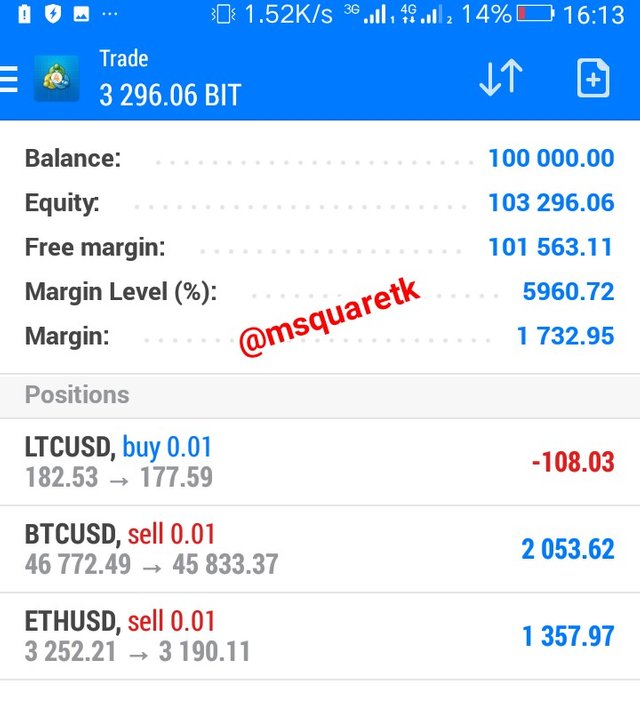
Fig. 17 : The Running Trades after 2 hrs 13 minutes of Execution / MT4
Now, going further at 7:18pm (WAT) 5hrs after the execution of the trades I checked back to see how my trades are doing. I noticed that LTCUSD has hit stop loss, but ETHUSD and BTCUSD are doing fine. Although LTCUSD signal was taken on the lower time frames.
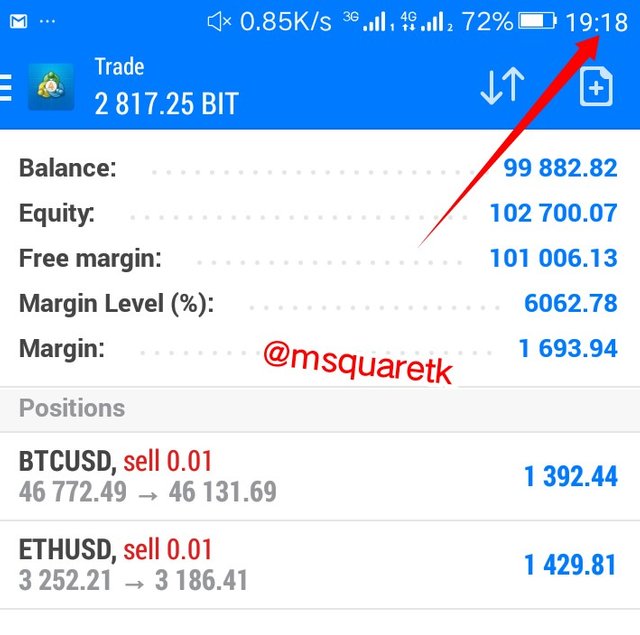
Fig. 18 : The Running Trades after 5hrs 18 minutes of Execution / MT4

Conclusion
Technical indicator is one of the things used by traders to predict the movement of price. There are many indicators used by traders to analyse financial assets. KDJ indicator also known as random index is one of the newest indicators developed to predict or measure the trend, and to give trading points or signals.
The reliability of technical indicators depends on how well the trader have learnt to use it. It is also important to follow the recommended parameters such as sticking to time frames recommended for the indicator (Higer time frames is always recommended), not picking the trading signals during ranging or flat market etc.
Thanks to Professor @asaj, I have learnt one or two things about KDJ indicator. I first heard the indicator, KDJ in his class. I have learnt how to take trading signals using KDJ indicator strategy. Thank you, Prof.

CC : @asaj
Written by @msquaretk
Superb performance @msquaretk!
Thanks for performing the above task in the eighth week of Steemit Crypto Academy Season 3. The time and effort put into this work is appreciated. Hence, you have scored 10 out of 10. Here are the details:
Remarks
You have displayed a good understanding of the topic Taiwo Micheal. You have completed the assigned task. Your have performed the tasks in a commendable fashion.
Downvoting a post can decrease pending rewards and make it less visible. Common reasons:
Submit
Thank you so much Professor @asaj for the review. I'm glad I Participated in your class. It added a whole lot to me.
Downvoting a post can decrease pending rewards and make it less visible. Common reasons:
Submit