Cover Page created by me, @msquaretk | Created with imarkup app
It is a great week in the Steemit Crypto Academy. The past four weeks were awesome. Thanks to all our Professors and the entire management of the Academy. This post is written in response to Professor @sapwood 's assignment after his lecture on "Onchain Metrics- Part 3". He taught the course very well. And at the end of his lecture, he gave us questions as assignment. I will be answering the questions one after the other. So, follow me closely.

1. What do you mean by Global In/Out of the Money? How is a cluster formed? Explain ITM, ATM OTM, etc with examples?

In this first task, I am going to be explaining the Global in / out of the money (GIOM), how a cluster is formed and some terms such as ITM, OTM, and ATM.
Global In/Out of the Money (GIOM)
We all know that the world of financial assets is dynamic in nature. That's there's always movement of funds in the market and price follows direction every single time and as such, investors or traders buy and sell crypto assets every single second, minutes and every day.
Beyond the price action on the charts, there are a lot of things that determine or influence the price action of an asset. One of these things is holders of the asset. There are lot holders of the coins or cryptocurrency in which if we use on chain metrics we can determine whether the price will follow a certain direction before a shifting will occur.
Global in/out of the money (GIOM) is a phenomenon where by the different prices at which a crypto asset is bought by different people and the addresses to which it's held to is collected as on chain data. Then, these data form what's known as cluster so as to have simplified price range. The process of this simplification considers the price ranges, the volume and the addresses to which the coins are held.
The goal of using GIOM and how it is being classified is to help us determine whether the addresses to which coins are purchased to are losing money or making money. If we can Know this, the volume of money that's being lost or gained or to which side is the odds favor, then we can position ourselves to take advantage of the direction of price of an asset.
There are many website we can use for on chain metrics. But, we will be using In to the block for this task. Some other on-chain sites are : Coinmetrics, Glassnode, Look into Bitcoin etc. Those sites are very good at doing on chain analaysis.
How cluster is formed
Like I said above, that the on chain data of each price and address to which coins are bought are collected. The arrangement of these things is what is called cluster. Each cluster contains price range, total volume, address and average price. In the screenshot below, you will see the circles in green color, red color and grey. Those circles are called cluster.
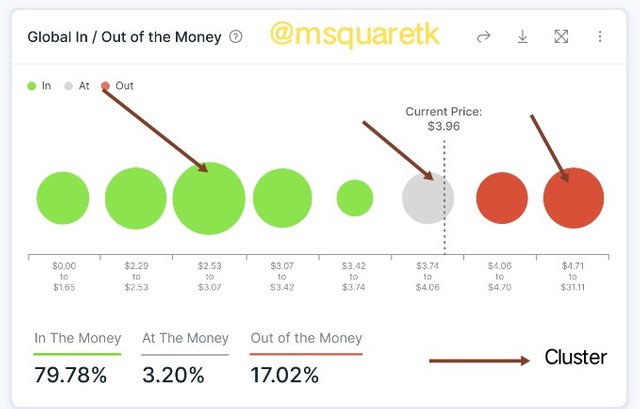
SOURCE
Based on the amount of money losing or gaining in the address, the cluster can be classified as ITM, OTM and ATM. We will discuss these terms later. Now, having explained GIOM and how cluster is formed, let's see some terminologies.
ITM
ITM means In the Money. It is a term used when the current price of an asset is greater than a cluster's higher range. ITM can serve as the support level for the asset, but it's dependent on the volume or size. If the size is great, that means the support will be strong.
OTM
OTM is an acronmy of out of money. An asset is said to be out of money if its current price is lower than the cluster 's lower range. OTM can be used as resistance. Just as the size of a cluster influences ITM, it influences OTM too. If the size of the cluster is large, that means the impact of resistance will be great, strong resistance.
ATM
An asset is said to be ATM, at the money, if its price is equal to the cluster's average price. It can also be at ATM if the price falls within a cluster' range.
SOURCE
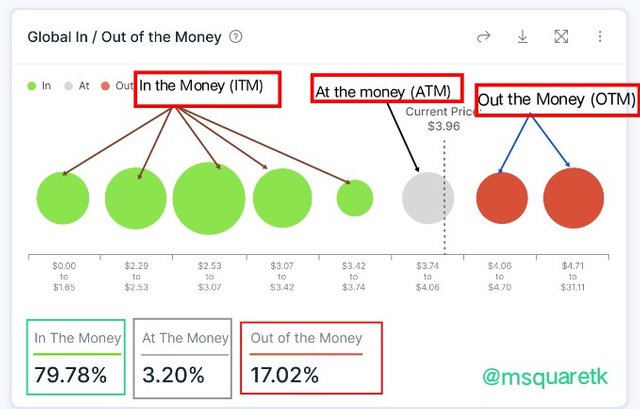
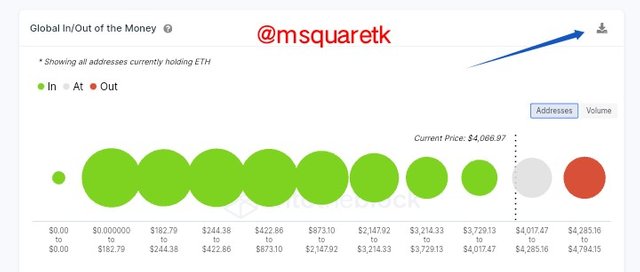
In the screenshot above, the green circles are the "In out money" (ITM), the grey circle represents "at the money" (ATM) and the red circle is "out of money" (OTM). As we can see in that screenshot, The percentage of ITM I greater than the remaining two. IOT carries 79.78%, ATM carries 3.20%, and OTM carries 17.02%. We can see that ITM is larger, then I should have great impact and as such support level will be strong.

2. Explain about Large Transaction Volume indicator with examples? What is the difference between Total and Adjusted Large Transaction Volume?Examples

Large Transaction volume indicator
Large transaction volume indicator is a type of on chain Indicator which is used for monitoring all transactions that are very large –larger than $100k. It is believed that the transactions that are very larger than $100k will influence the market and as such, the people that can be behind this kind of transactions are large institution and whales.
Large Transaction volume indicator works by adding up all transactions that are more than or greater than $100k. It then plots on its graph inform of line contour either the total or adjusted. Although, the adjusted one is more preferable and accurate because the total is not always due to the fact that someone may use one address to transfer funds to another and later transfer the fund back to the original addresses. So in essence, one address may be used for multiple transfers and that may have impact on the result and leading to inaccurate result.
Now how do we read this indicator? It's very simple, when whales and large institutions have interest in accumulating or distributing the assets, the indicator will show a kind of spike in its contour. This will signify that, they have a kind of interest in the purchase or distribution of a particular asset at that particular time. On the other hand, when the contour is seen decreasing, that may mean that Whales and large institutions don't show interest.
SOURCE
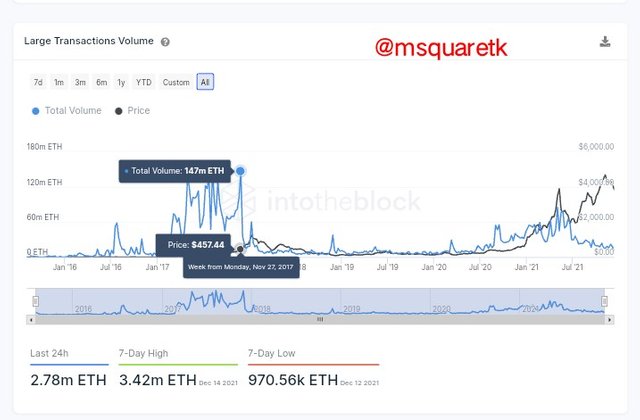
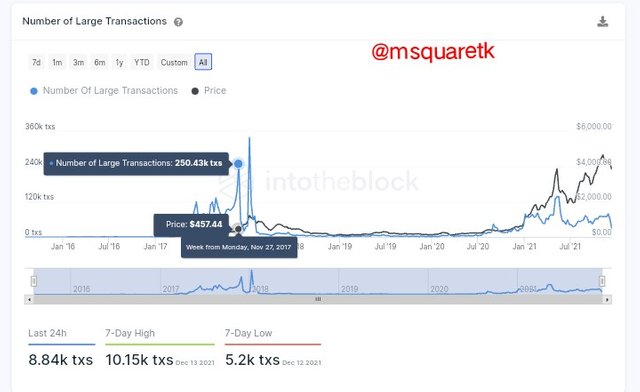
In the screenshot above, the chart you are seeing is known as Large Transaction volume indicator. Remember I said, a spike in the contour signifies interested of whales and large institutions and decrease in contour shows that there's no interest.
If you look at that screenshot below, on the 27th November 2017, there was a huge spike up, and at that time, the price of Ethereum was about $457. Shortly after that, the price of Ethereum rose significantly to the upside and we can see that within Nov. 2017 wnd July 2018 the price of Ethereum has experienced more than 400% increase... At the end of July, the ETH was trading at about $2000. We can see how the spike on the Indicator can help us determine when the whales and institution show interest.
Difference Between Total and Adjusted Large Transaction Volume.
Like I said above, the indicator tracks every transaction that are above $100k and add them up and plots them in contour. The difference between total and adjusted large transaction is that, in total transaction, there may be multiple accounts or addresses which are used to transfer funds at multiple times. Whereas, in adjusted, there's a filter for that. This is to ensure accuracy.
In order words, the total large transactions are recorded and have its line plotted without considering the fact that an individual may use just one address for multiple transactions. While the adjusted large transactions volume takes that into consideration before it records or add them up and have its line plotted. Thus, adjusted large transaction volume is more accurate and effective in predicting the interest of whales and large institutions.
Source
So, by using adjusted large transactions volume, the numbers of addresses, it will filter out multiple transactions. So, adjusted is considered most accurate when using the large transactions volume indicator.

3. Analyze a crypto asset(other than BTC) using on-chain metric: GIOM, and Adjusted Large Transaction Volume? Ascertain whether it supports a Bullish or Bearish bias or Neutral? How do you find the support and resistance using GIOM? How do you ascertain the upside/downside momentum using GIOM? Use InTotheBlock app or any suitable app? (Examples/Screenshots)?

In this task, I am going to be analysing Ethereum crypto asset using into the block website. You can visit the website by clicking this link into the block
Then, on getting to the website, we click on where arrow is pointing at in the screenshot below to download the raw data.
Source
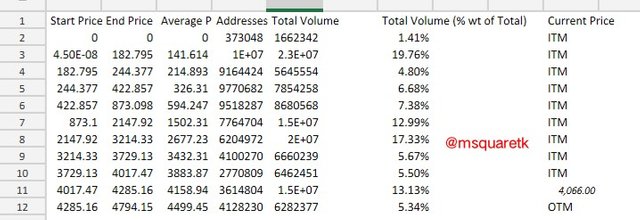
The GIOM raw data of the ethereum is shown in the screenshot below.
Screenshot from Excell
From the screenshot above, the current price of Ethereum is $4066 and the percentage of ITM is 94.66% and and that of OTM is 5.34%
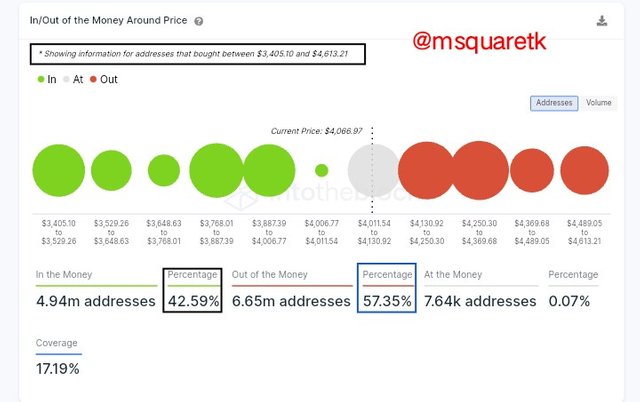
Short Term (Range 3,405 to 4, 613)
Source
The percentage of ITM is 42.59%, and that of OTM is 57.35% and the ATM carries 0.07%. And as we can see, the current price of Ethereum is $4, 066. If we compared the ratio of ITM and OTM, we realize that they are nearly at the same ratio. Hence, neither bulls or bears are currently gaining strength, although OTM is higher.
From the data, the support and resistance for the short term is in the screenshot below.
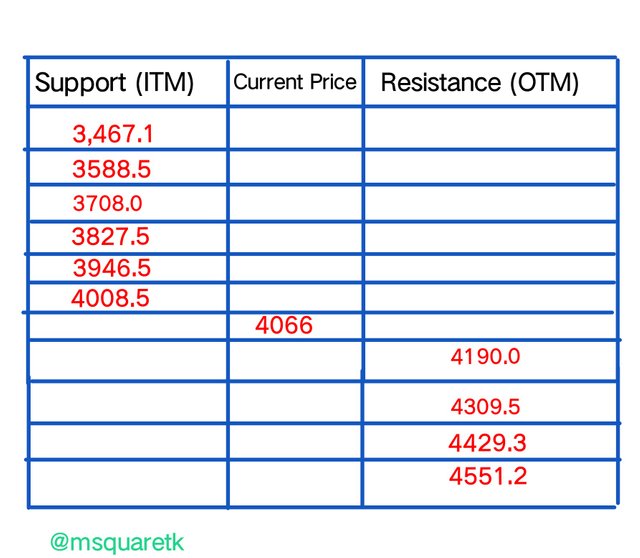
Screenshot from imarkup app
Long Term ( Historical price data )
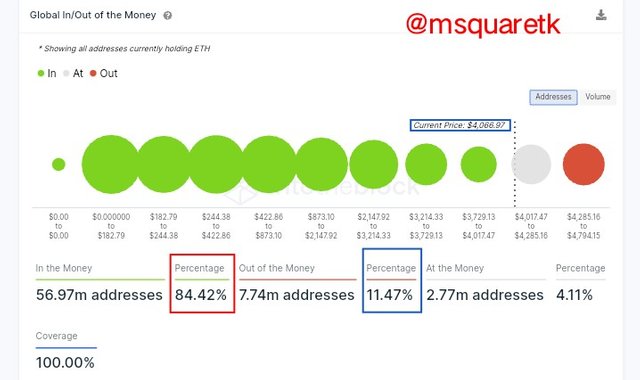
Source
The percentage of ITM 84.42%, and OTM has a percentage of 11.47% and ATM has 4.11%. As we can see the percentage of ITM is far greater than that of OTM. And hence for this long term, Ethereum asset is considered bullish.
From the day, the support and resistance for the long term (Historical price data) is written in the screenshot below.
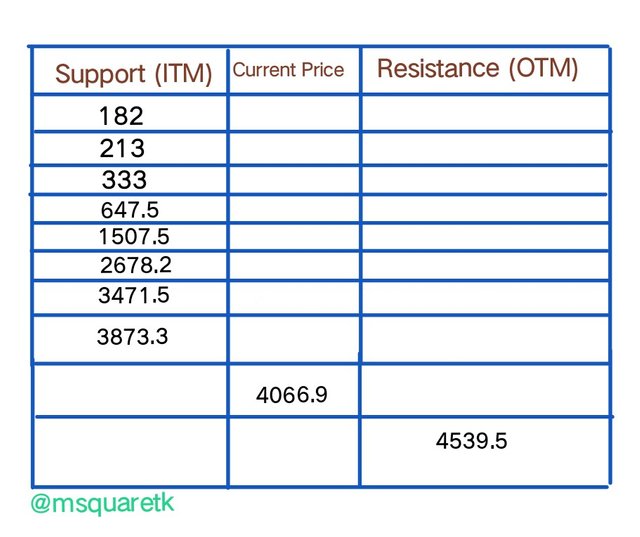
Screenshot from imarkup app
Momentum Based on GIOM
What determines the momentum either to the upside or downside has to do with the difference between the ITM and OTM based on the number of addresses for a given price range.
Now, let's analyse for example, within four months 8th August 2021 and 14th December 2021, and see what where the momentum favors.
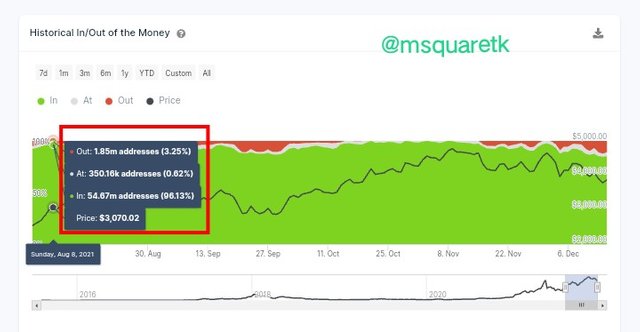
Source
According to the screenshot above, Ethereum has these details on the 8th of August, 2021:
*Price:– $3, 070
ITM :– 54.67m addresses (96.13%)
OTM :– 1.85 m addresses (3.25%)
Now, let's see what it is on the 14th of December 2021.
Source
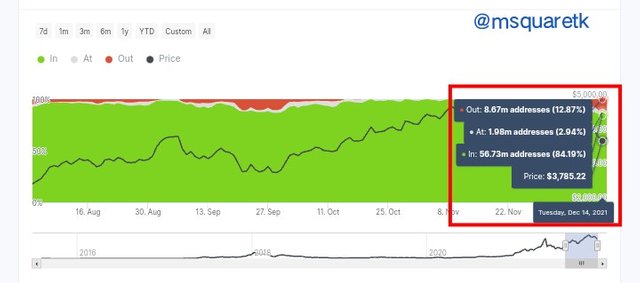
According to that screenshot, the chart shows that Ethereum on the 14th of December contain:
Price:– $3, 785
ITM :– 56.73m addresses (84.19%)
OTM :– 8.67 m addresses (12.87%)
As we can see, from August 8th to Dec. 14th, there was an increase of addresses in ITM (from 54.6m to 56.73m). And a significant rise in the number addresses in the OTM was seen as there was an increase from 1.85m to 8.67 which give rise to 12.87% of OTM. This shows that the the momentum is towards the bearish side as there are more addresses that turn to OTM within this price range than those that turn to ITM.
Now, let's further look at the adjusted large transaction.
Adjusted Large Transaction Volume
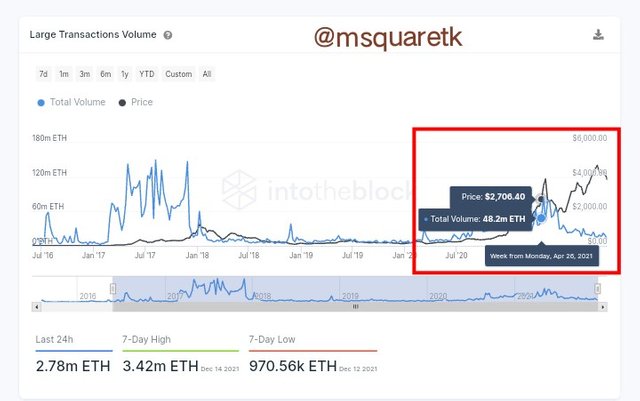
If we look at the chart of adjusted large transaction indicator for ethereum, we will realize that this year, there's has only be about one spike up and that spike leads to a bearish ride on the ethereum since then. See the screenshot below
Source
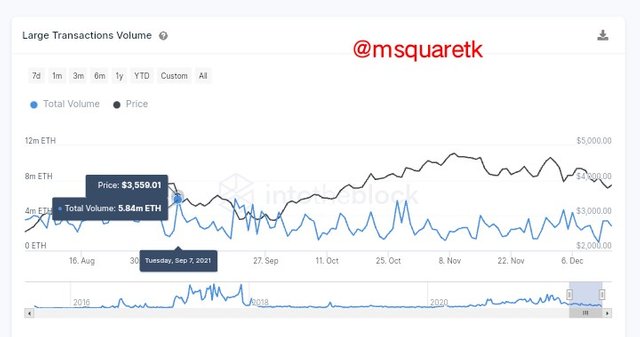
Although, if we look at the smaller time range, we will will see small-small spikes which leads to rise and sometimes fall in the price of Ethereum. But overall, it's has been in a bearish momentum since a quick spike occurred that time.
Source
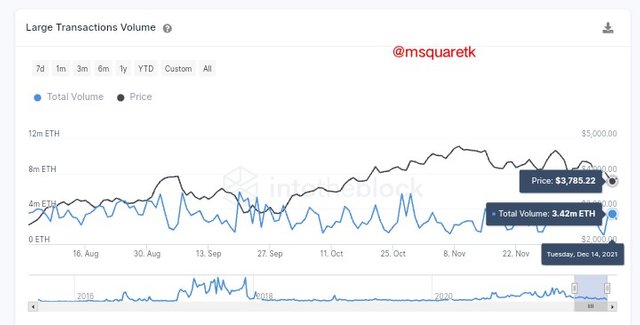
On September 7, there's a volume of 5.84EH, but on Dec. 14th, the volume has reduced to 3.4ETH. we see how volume greatly reduced within 3 months.
Source

Conclusion

On chain metrics analysis can provide investors or traders what they need to judge or predict the movement/direction of price of an asset. Global in/out of money (GIOM) is one of the on-chain Indicators which are very useful. The indicator adds up the addresses and volume of crypto assets purchased and then turn them into cluster in form of circle on the indicator which are then supposed to achieve as supports and resistances. Another on chain Indicator is large transaction volume indicator. This indicator is used to track the activities of whales and large institutions as it records every transaction greater than $100k. By this, investors will know when whales are showing interest on a particular asset.
In this task, I have demonstrated my understanding in the assignment given by Prof. @sapwood. Thank you for bringing up this course. I have learnt one or two things.

CC: @sapwood
Written by @msquaretk