
Cover Page Created by me, @msquaretk | Made on imarkup app
In this post, I'm going to be answering the questions Professor @pelon53 gave as assignment after his lecture on Fibonacci Tools. He explained that topic very well and taught how to use the tools to take trading decision in the market. So, follow me closely.

1.Explain in your own words what Fibonacci retracement mean. Show an example with screenshot.

In this first task, I'm going to be explaining what Fibonacci retracement mean based on my own understanding. In finance trading, there are many technical tools to predict the direction of price in the market. Different tools have been created by the Analyst to help measure the inflow and outflow of money. Technical indicators , chart patterns, candlestick pattern, fibonacci retracement etc are some of the tools traders use I technical analysis.
Fibonacci retracement is a popular tool used in technical analysis. It's a tool which is used to identify support and resistance levels on the price chart. This tool has to to do with the sequence number. Fibonacci numbers was developed by Fibonacci Pisa, a great mathematician. When people realized how useful the fibonacci numbers are in the real word, they taught that the fibonacci numbers should have application on finance, too. The fibonacci retracement tool is designed to have a significant fibonacci ratios which are capable to reverse the price whenever the price touches the levels.
Fibonacci retracement is used in a trending market. That's when there's a clear trend to the upside or downside. It's drawn by starting from extreme point area to a high area in an Uptrend market and from a high area to a low area in a downtrend market. The fibonacci levels are 23.6%, 38.2%, 61.8%, and 78.6%. But traders have included 50% because it's a mid point and of course we know how significant a mid point of number is. That's why 50% was included.
We know that when there's trend, price will moves in the direction of the prevailing trend, and then pull back to correct the impulsive move of that prevailing trend. The pull back is called the retracement. The end of the retracement is a key level which price will continue its move. These key levels, support and resistance are where traders wait to join the trend. Fibonacci retracement helps to identify these levels.
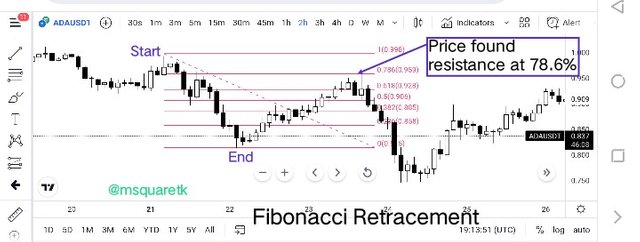
An example of Fibonacci retracement which help to find a resistance level is attached below.
Screenshot from trading view | SOURCE
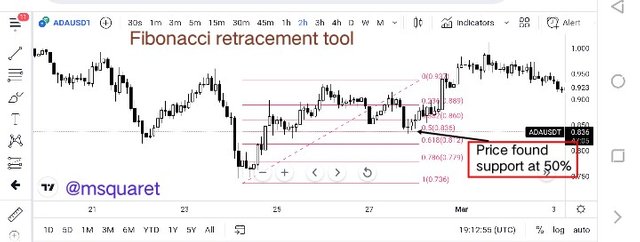
As you can see in the screenshot above, price found resistance at 78.6% fibonacci level. These fibonacci levels are significant levels in the market. Also, let's see how it's used in an uptrend market. It's drawn from the start of an impulsive wave to its end. That's from the low of that impulse to where it ends.
Screenshot from trading view | SOURCE
See how price found a new support at a fibonacci level. And we can see how price continued its prevailing leg to the upside.

2. Explain in your own words what you mean by Fibonacci extension. Show an example with screenshot

We have discussed fibonacci retracement in the previous question, here, I'm going to be discussing the fibonacci extensions. Fibonacci extension is a tool which is used to set target. In essence, fibonacci extension predict how far a new wave in the direction of the prevailing leg could reach before another retracement or reversal happens in the market.
The idea of using fibonacci extension on the chart is to accurately predict how far the new wave which is about to form can move before the price turns or reverses. There are significant numbers which are used as extensions levels. The extensions numbers are : 61.8%, 100%, 161.8%, 200%, and 261.8%. When price gets to this number, it's likely going to reverse. So traders use these levels to set their take profit knowing that they are significant levels where price could turn back.
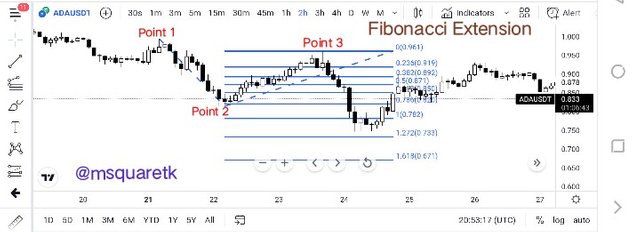
Fibonacci extension is simple to use and it doesn't involve any calculation. It contains of horizontal lines plotted on the price chart when it's applied or drawn on the chart. It's drawn by taking three points. To draw it on the chart, begin from the start of an impulsive move (point 1) and move to the end of that impulsive move (point 2) and finally to the end of the retracement leg to that impulsive move (point 3). Then, you will see series of horizontal lines plotted on the chart. They are fibonacci extension levels.
Let's see an example of how fibonacci extension was used on the chart.
Screenshot from trading view | SOURCE
In the screenshot above, we can see how I added the tool to the chart. I started drawing from point 1 which is the same of the impulsive move and then drag the tool to point 2, the end of the impulsive move and finally to point 3, the end of he retracement leg to the impulsive move. Then we saw that the price turns at 1.272 . That means the price found that support in that area.
Let's see how it's used on a bullish market. We will see that it's the same principle. The drawing is very easy and simple. See the screenshot below.
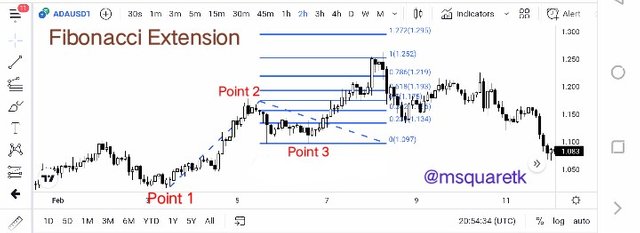
Screenshot from trading view | SOURCE
Having seen that, let's move to the next question.

3. Perform the calculation of the Fibonacci retracement, for the levels of: 0.618 and 0.236. Pick a crypto pair of your choice. Show a screenshot and explain the calculation you made.

In this task, I'm going to be performing the the calculation of the fibonacci retracement for the levels of 0.618 and 0.236 . Let's start with level 0.618
Calculation of Fibonacci level 0.618
For the calculation of fibonacci level 0.618, I'm going to be using the chart of ADAUSDT.
The formula for calculating the fibonacci retracement is given below
Rn = X + [(1 - % Retracen/100) * (Y – X)]
Rn = Retracement level under consideration
X = Value of an asset where at the start of fibonacci retracement tool
Y = Value of an asset at the end of the retracement tool.
Let's look at the percentage retracement for each level:
% Retrace 1 = 23.6%
% Retrace 2 = 38.2%
% Retrace 3 = 50%
% Retrace 4 = 61.8%
% Retrace 5 = 78.6%
Now, I have been asked to calculate R4 which is 61.8%.
Let's see the screenshot below to get the value of X and Y.
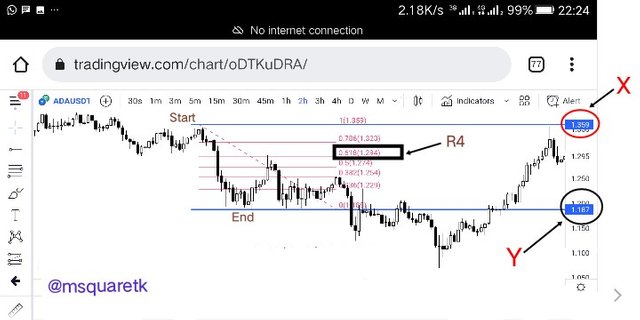
Screenshot from trading view | SOURCE
According to the chart above,
X = $1.359
Y = $1.187
Now,
R4 = X + [(1 - % Retrace4/100) × (Y – X)]
R4 = 1.359 + [(1 - 0.618) × (1.187 – 1.359)]
R4 = 1.359 + [(0.382)×(-0.172)]
R4 = 1.359 +(-0.065704)
R4 = 1.359 - 0.065704
R4 = $1.293296
Calculation of Fibonacci level 0.236
For the calculation of level 0.236, I'm going to be using the chart of DOGEUSDT. Let's see the screenshot below to get the value of X and Y from the price chart.
We know that:
Rn = X + [(1 - % Retracen/100) * (Y – X)]
Here, we are going to be calculating R1. Let's see the chart below.
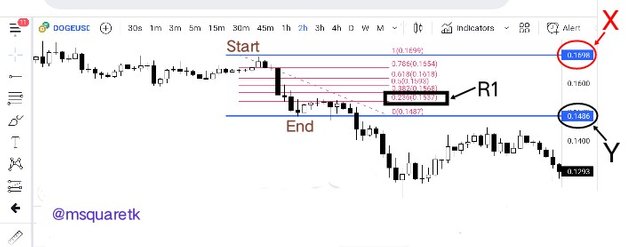
Screenshot from trading view | SOURCE
From the screenshot above, we can see the x and y on the graph.
X = $0.1698
Y = $0.1486
Now, let's calculate R1
R1 = X + [(1 - % Retrace1/100) × (Y – X)]
R1 = 0.1698 + [(1 - 0.236) × (0.1486 – 0.1698)]
R1 = 0.1698 + [(0.764)×(-0.0212)]
R1 = 0.1698 +(-0.0161968)
R1 = 0.1698 - 0.0161968
R1 = $0.1536032

4. On a Live account, trade using the Fibonacci retracement, screenshots are required.

In this post, I'm going to be placing a real trade on my live account. I'm going to do the analysis on he trading view platform and take a margin trade on my binance exchange app. The trade will be taken using the fibonacci retracement strategy. Let's see the analysis first.
On the chart of ALGOUSDT, 15 minutes timeframe, price was seen in an uptrend. Before I move further, it's important that fibonacci is used in a trending market. So, the first thing to do is to identify the trend in the market. Because without knowing the trend, you won't know how to use the tool correctly. So, the price was making higher highs and higher lows which is an identification for an uptrend.
When I saw that the price is in it's retracement leg to correct the last high created, I drew my fibonacci from the start of the last impulsive move to the end. The price has already found the support on 0.786 or 78.6% fibonacci level which is one of the strongest level. See the screenshot below.
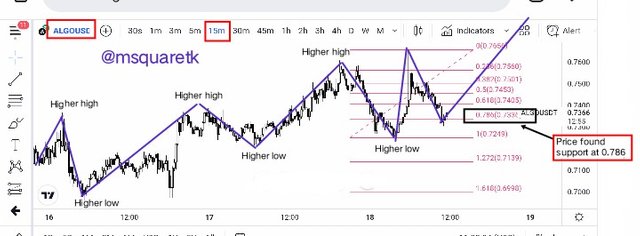
Screenshot from trading view | SOURCE
Then, having seen that, I marked my buy entry at $0.7362 and stop loss was placed below the support level (fibonacci level 78.6%) at $0.7232 and take profit was placed at the last him created to be on a safer side. See the screenshot below.
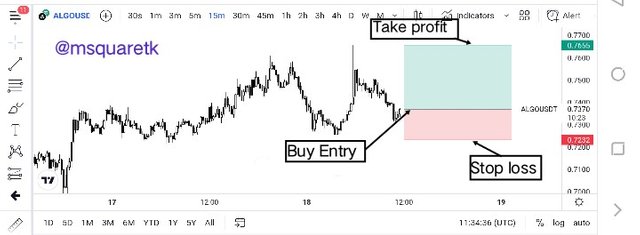
Screenshot from trading view | SOURCE
Having the entry and exit price levels, I opened a real trade on binance using margin trading option. Everything was set appropriately. See the screenshot below.
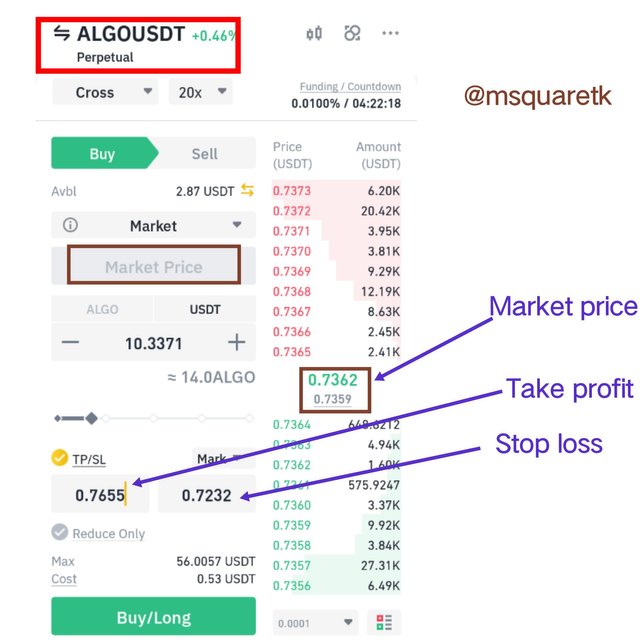
Screenshot from my Binance App
Then this screenshot was taken after executing the trade. It shows buy entry of ALGOUSDT running. See it below.
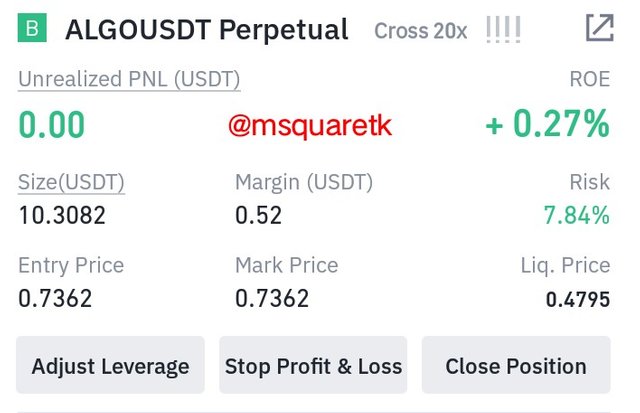
Screenshot from my Binance App
I will be monitoring the trade and see how it's going to end. If it goes and hit my stop loss, that would mean that the step up is invalid.

5. On a Demo account, make a trade operation using the Fibonacci extension. Screenshots are required.

Here, I'm going to be trading using fibonacci extension and I will be doing the analysis on the trading view and use Mt4 app to place the demo trade. Let's see the analysis on the trading view platform.
Now, fibonacci extension is used for target in the market. So, to use fibonacci extension correctly, you may need to consider first, fibonacci retracement to be able to know when the new wave will commence. So, on the chart of xrpusd, the price was seen I an uptrend with a series of Higher highs and higher lows. Then, I used the fibonacci retracement to know where the price is reacting to. The price has four support on 0.618 fib. level. Let's see the screenshot below.
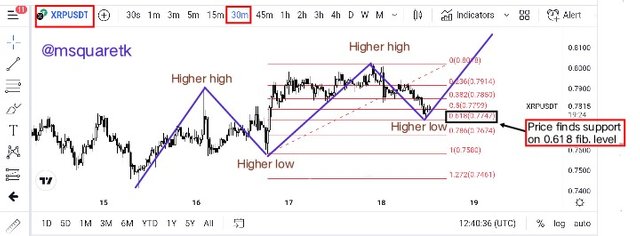
Screenshot from trading view | SOURCE
Now, having seen where the price has rejected, the next to draw fibonacci extension tool to determine how far the price can go. In the screenshot below, I drew fibonacci extension on the chart of XRPUSDT. I started the drawing from the start of the last impulsive wave to its end and to the end of retracement leg. See the screenshot attached here.
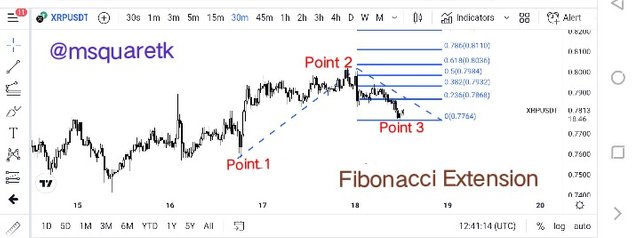
Screenshot from trading view | SOURCE
Then, I used fibonacci extension to determine the target. The entry was taken at $0.7816 , stop loss was placed below the fib. level 0.618 at the price $0.7692. Then, fibonacci extension was used for profit target. Fibonacci extension of 0.786 was used as my first target. See the screenshot below.
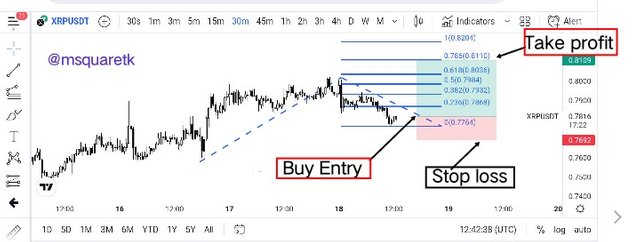
Screenshot from trading view | SOURCE
Having the entry and exit price level, I opened an instant buy execution on Mt4 with everything set appropriately. See the screenshot below.
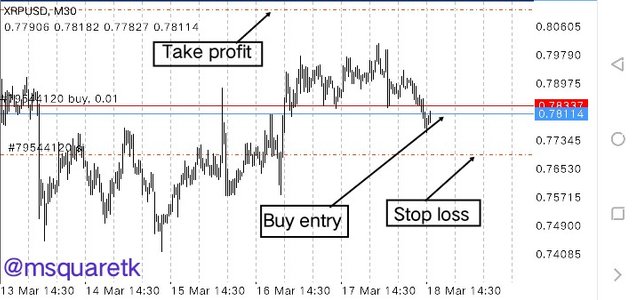
Screenshot from my MT4 App
Then, the screenshot below shows the trade of XRPUSD running. I will monitor this trip and see how it's going to end.
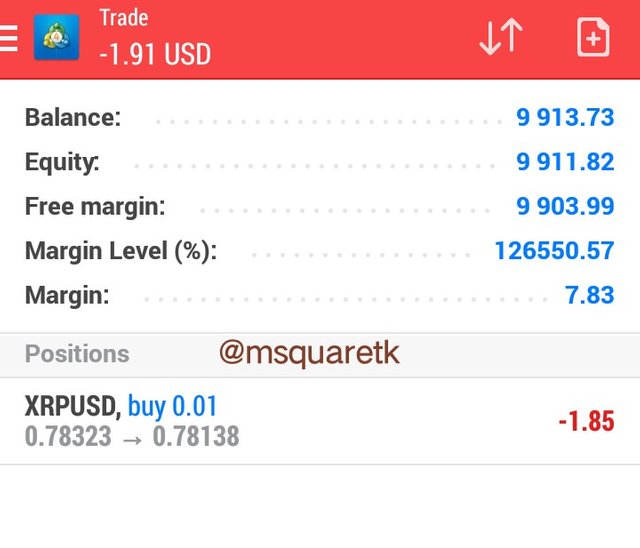
Screenshot from my MT4 App

Conclusion

Fibonacci retracement is a technical tool for predicting or determining the area of support and resistance levels in the market. It's used on a trending market to determine when the price is likely going to resume or continue its impulsive move. Fibonacci extension is also a technical tool which is mostly used for profit target. By drawing it on the chart, traders look at the horizontal lines plotted on the chart and set their profit target on the significant level where price is likely going to reverse.
Fibonacci retracement and extension are very easy to draw on the chart. It's also very simple to read and understand. Although, they are good technical tools, but it's advisable not to use any of them alone. When use fibonacci retracement, you can combine one more technical Indicators to increase it's efficiency or success rate.
Thanks to Prof. @pelon53 for this insightful and educative lecture of fibonacci tools.

Written by @msquaretk