
Cover Page Designed By me, @msquaretk | Canva App
It's a new week in the Crypto Academy of the season 4. This post is written in response to the assignment or homework task given by Professor @allbert. Prof. taught "Trading with Contractile Diagonals" and he explained in detail the said topic. In the next paragraphs, I'm going to be attending the questions one after the other. Therefore, follow me closely as we journey together.

Question 1
Define in your own words what a contractile diagonal is and why it is important to study it. Explain what happens in the market for this chart pattern to occur. (screenshot required / Bitcoin not allowed)
Contractile diagonal is one of the patterns that form on the price chart in finance or cryptographic trading which often signifies exhaustion in the power of buyers (when forms in an uptrend) or sellers (when forms in a downtrend). Contractile diagonal is also known as wedge.
Wedge or contractile diagonal often shows candles on the chart being contracted towards the end of the trend. This means that price finds it difficult to rally up or down with a very great momentum. Hence, contractile diagonal is a reversal pattern. It is referred to a bearish reversal pattern when formed in an uptrend and and this pattern in an uptrend is often called rising wedge. bullish reversal pattern is formed in a downtrend and it is often called falling wedge. It's pertinent to know that this pattern may be a continuation of the trend depending on where or how you see it. When the pattern forms on smaller time frame, it may be a reversal but when it is viewed on higher time frames, it may mean continuation.
The pattern often forms in form of five waves, 1, 2, 3, 4, and 5. It's very similar to that of Elliot wave formation. Wave 1, 3 and 5 which are the impulsive move are connected together with a trend line and wave 2 and 4, the counter move or retracement are also joined with a trend line. When the two trend lines that join the highs and lows of price are drawn, it should tend to meet in future. In essence, the trend line should be seen converging on the chart.
Let's see the screenshot below to better understand the pattern on the chart.
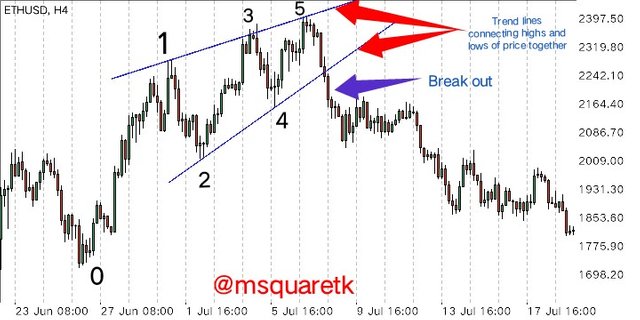
Fig 1: Graphical Illustration of Contractile Diagonal on the Chart of ETHUSD | MT4 Platform
As it can be seen from the figure 1 above, the pattern has five waves. 1, 3 and 5 are impulse and 2 and 4 are retracement or correction. The price begins to contract and it gets to a point (Often, after completion of wave five) where the price breaks out the rising wedge.
In the screenshot below, you will see an example of a contractile diagonal which signifies a continuation of a downtrend bases on the timeframe where it formed. This means, the pattern can be reversal or continuation pattern.
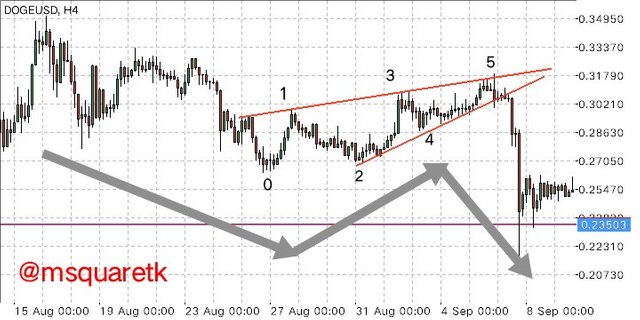
Fig 2: Contractile Diagonal on the Chart of DOGEUSD which as a Continuation Pattern | MT4 Platform
Why do we need to study this pattern?
Contractile pattern is one of the patterns which every trader must study and learn. Hence, it is very important and its importance can never be overemphasized. One of the things that traders want to know upon entering the market is to know how to join the trend and when the current trend will change. So, when they know when the current trend will change, they will position themselves to trade the reversal.
Wedge or contractile diagonal is very important because it shows the exhaustion of the current trend and therefore must be studied. In essence, the pattern often signifies a change in trend. And once a change in trend is spotted by the traders, then they maximize the opportunity to trade it.
What Happens in the Market for Contractile Diagonal to Form?
Contractile diagonal forms in the market as a result of exhaustion. What do I mean by this? When the price of an asset has been in a direction for a long period of time, it will come to a time when the magnitude of the movement of the price to that direction will be weakened, then the price begins to contract (candles that represents price contracts) and then the buyers or sellers depending on the direction of price are exhausted.
For example, in an uptrend, wave 1, 3 and 5 which I the impulsive move in the direction of that trend shows that buyers are trying to move the price of the market up, but it's not with great volume and momentum because the asset is over priced. The break of the diagonal line of wave 2 and 4 often shows that the sellers have taken over.
Wedge often occurs when the price of an asset is overbought (in the case of uptrend) and oversold (in the case of downtrend).

Question 2
Give an example of a Contractile Diagonal that meets the criteria of operability and an example of a Contractile Diagonal that does NOT meet the criteria. (screenshot required / Bitcoin not allowed)
In this section of the question, we are going to look at an example of a contractile diagonal that meets the criteria of operability and an example of one that doesn't meet the criteria. Let's get started.
An example of a Contractile Diagonal that meets the criteria of operability.
Now, let's begin with an example of Contractile that meets the criteria of operability.
The screenshot below shows an example of one.
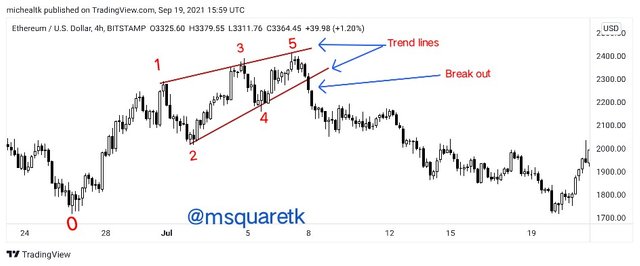
Fig 3: Graphical Illustration of Contractile Diagonal that meets criteria of operability | tradingview.com
Now, we know that for contractile pattern to form, five waves, 1, 2, 3, 4, and five must form. In the screenshot above, the five waves have been labelled. However, these waves must meet some requirements.
The requirements are:
- Wave 1 must be longer than wave 3
- Wave 3 must be larger than wave 5
- Wave 2 must not be shorter than wave 4
- The trend line must join points 1, 3 and 5 together. But in some cases, point 5 may not be in match together with point 1 and 3.
- Then the other trend should join point 1 and 2 together.
- The two diagonal must be converging. That is, they should have tendency to meet in the at a certain place.
Now, I have shown you the contractile diagonal on the chart. How do we know if this contractile diagonal follows or one the rules mentioned above. Because if doesn't follow, then it doesn't meet the criteria of operability.
I used the price range to measure the leg of each wave. See the screenshot below.
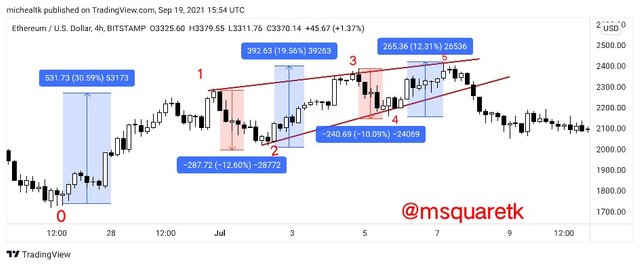
Fig 4: Measuring the Leg of each Wave of Contractile Diagonal that meets criteria of operability | tradingview.com
In the figure above, we can see that wave 1 (30.59%) is greater than wave 3 (19.56%) which is one of the criteria. Also, wave 3 is larger than wave 5 (Wave 5 is 12.3%. Then wave 2 which must be greater than wave 4 is 12.6% and it's greater than wave 4 (10.9%). Then we can also see that the two diagonal lines are converging. So, the pattern meets all criteria. Hence, the criteria of operability is met.
An example of a Contractile Diagonal that does NOT meet the criteria of operability.
Having looked at an example of a contractile diagonal that meets the criteria of operability, let's look at the one that doesn't.
In the screenshot below, waves 1, 2, 3, 4 and 5 formed which is known as the contractile diagonal pattern.
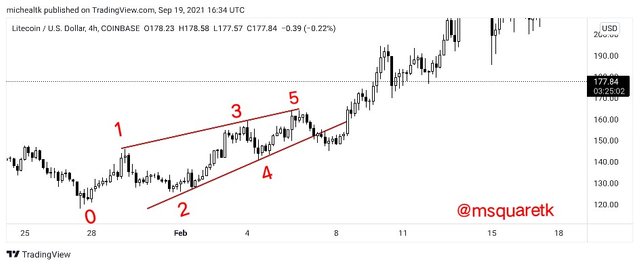
Fig 5: Graphical Illustration of Contractile Diagonal that does not meet criteria of operability | tradingview.com
Although the figure above shows that we have wave 1 to 5 formed with the diagonal line converging. But then, instead of having sellers take over after the completion of wave 5, the price of the market rallied up. This is because the pattern doesn't meet the criteria of operability. Now, let's check it.
The screenshot below shows that the pattern violates the rule that says wave 1 should be longer or greater than wave 3.
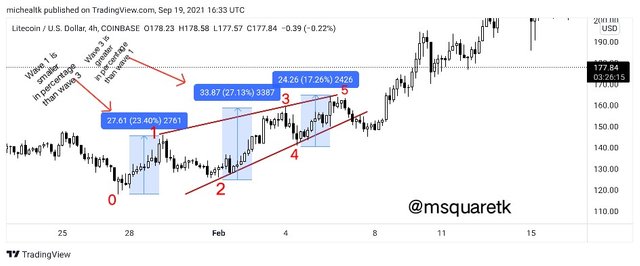
Fig 6: Measuring the Leg of each Wave of Contractile Diagonal that does not meet criteria of operability | tradingview.com
In the screenshot above, we can see that wave 1 is 23.4% and wave 3 is 21.73%. Wave 3 is greater than wave 1 and we know that the rule is, wave 1 must be greater than wave 3. This has violated the rule, hence this contractile diagonal doesn't meet criteria of operability.

Question 3
Through your Verified exchange account, perform one REAL buy operation (15 USD minimum), through the Contractile Diagonal method. Explain the process and demonstrate the results and graphical analysis through screenshots. Your purchase data must match your analysis data: such as cryptocurrency and entry price.
Here, I'm going to perform a real buy operation with my verified exchange platform, binance using contractile diagonal.
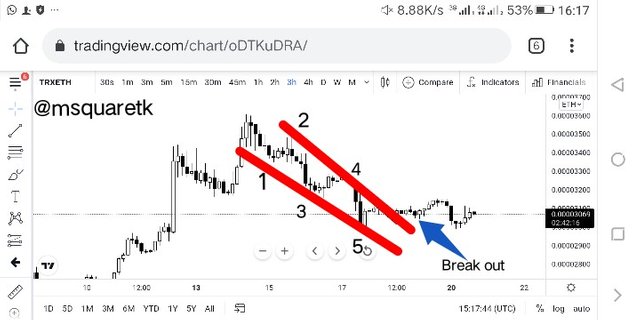
Fig 7: Contractile diagonal on the chart ofTRXETH | tradingview.com
The screenshot above shows that the five wave have been formed. I met the market after the break out. Immediately I spotted the pattern, I will straight away to my verified exchange platform to buy TRX. Let's see the procedure for buying the crypto on binance.
Firstly, I log in to the binance app. Then on getting to the homepage of the app, I click the trade. But before I continue, let me show that my account is verified. The screenshot below shows that my binance account is verified.
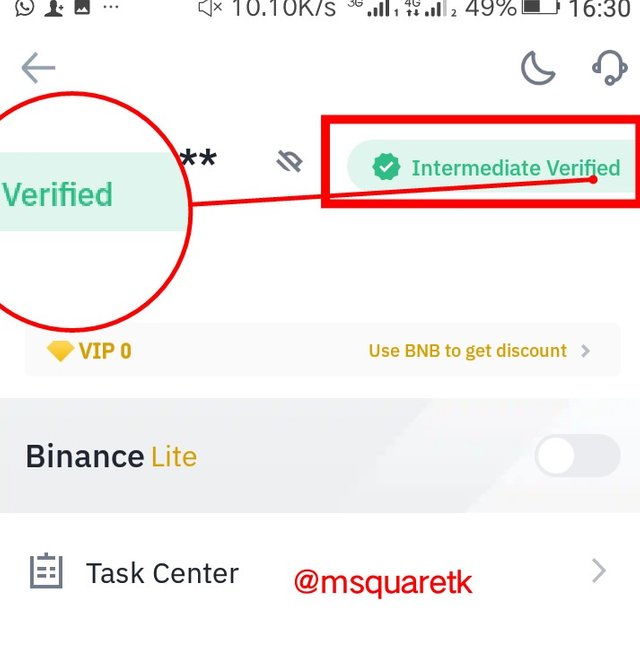
Fig 8: My verified Binance Account | Binance App
So, having shown that, let's continue. Now, on the homepage, you can click trade to buy or sell any crypto you want to. Now, I this case, I want to buy TRX with ETH. **In my wallet, I have ETH worth of $17. See the screenshot below.
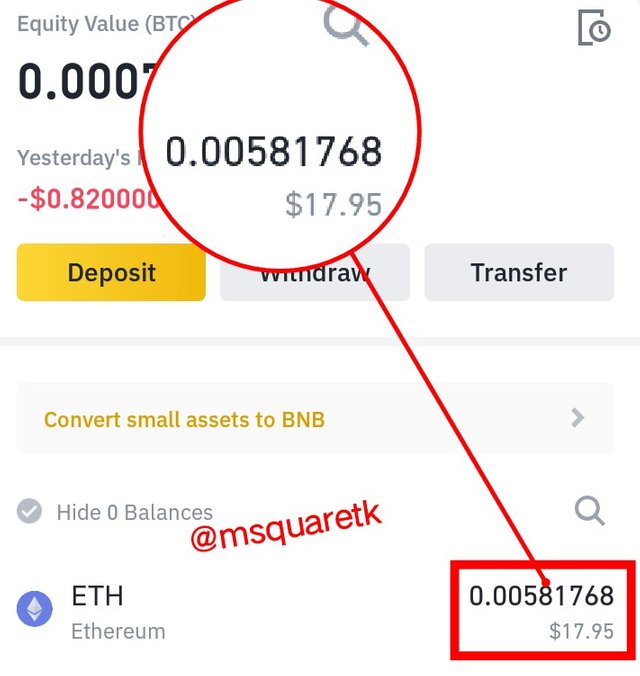
Fig 9: My ETH worth $17 | Binance App
Now, upon clicking on the "trade" on the homepage, you will be taken to where you can buy. Now, as I clicked on it, a page appeared for me. In the page, we can search the cryptocurrency we want to buy or sell. Make sure it is on the spot. Now, I click on the BTCUSD at the top of the page to search for TRXETH. See the screenshot below.
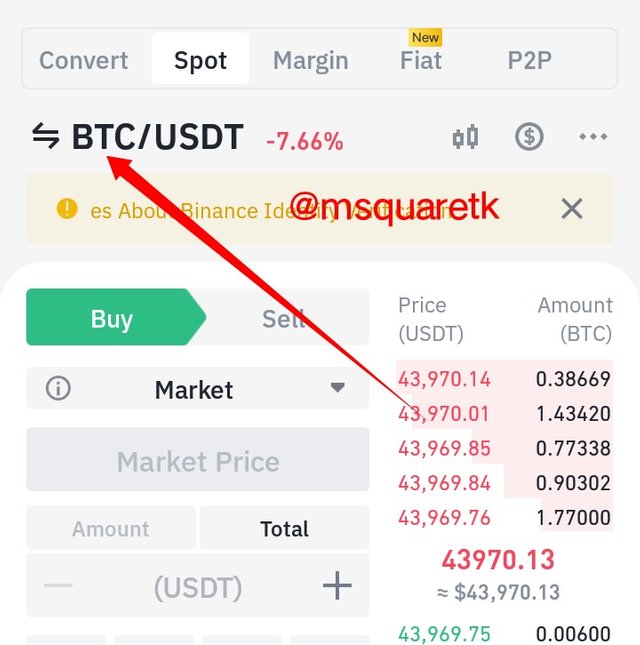
Fig 10: Trade page | Binance App
Upon clicking on the "BTCUSD", a search box will appear. We can type "TRXETH" which is the cryptocurrency we are interested in buying. I searched for this pair. See the screenshot below.
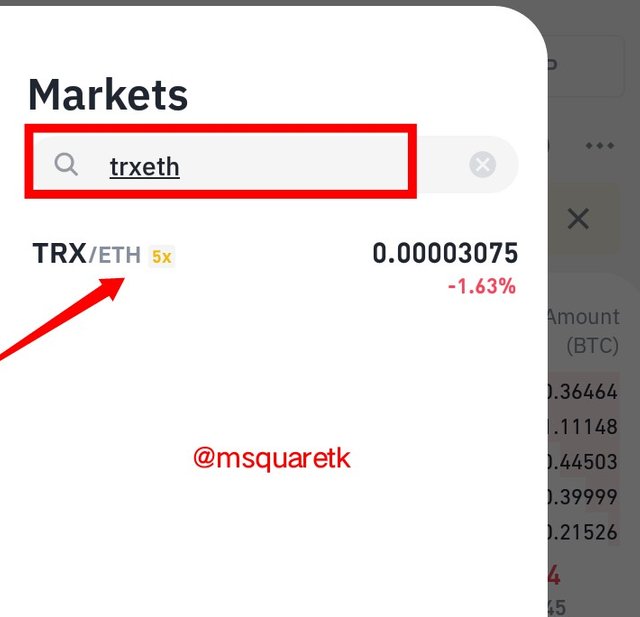
Fig 11: Searching for TRXETH | Binance App
Then once it appears, you click on it. So clicking on it, it shows the page where we can buy TRX.
On the page, I'm going to buy TRX with my 17$ ETH I have. I'm going to buy TRX at the current prive and then I have selected "market price" and selected all my ETH worth $17. See the screenshot below.
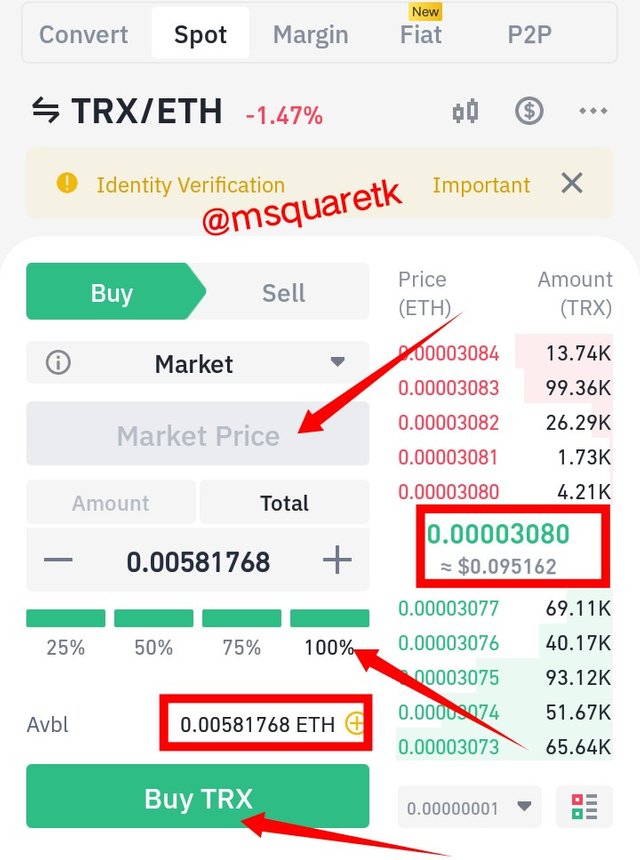
Fig 12: Buying TRX with ETH | Binance App
Now, the current market price I bought the asset is 0.00003080, as it can be seen in the screenshot above.
Let's quickly see this market price on the chart using trading view.
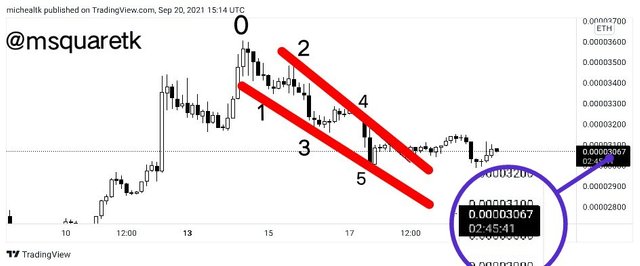
Fig 13: Current Market price of TRXETH | tradingview.com
As it seen in the screenshot above, the current market price is 0.00003067. This shows that, before I place the trade on binance, it has increased from 0.00003067 to 0.00003080.
Let's see the result or history of the trade I placed on binance in the screenshot below.
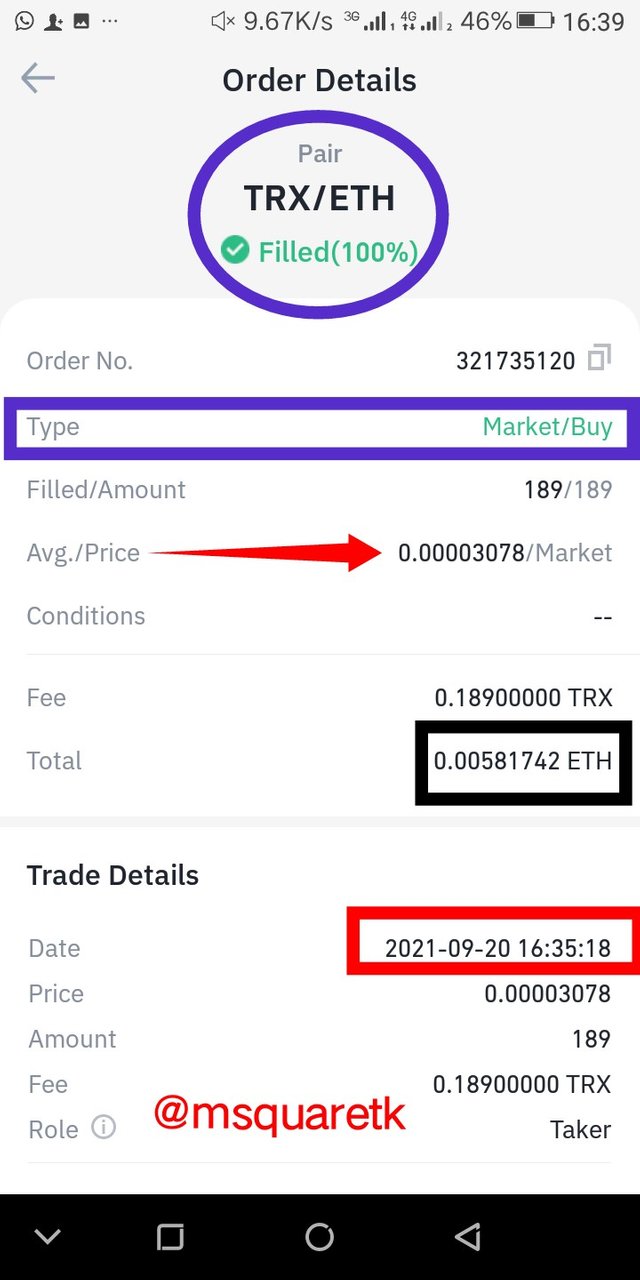
Fig 14: History of the Buy Order, TRXETH | Binance App
As it seen in the screenshot above, the order is 100% filled. The market type is buy. Time and date of the purchase is in the screenshot also. I have bought 189TRX with my ETH worth $17.

Question 4
Through a DEMO account, perform one sell operation, through the Contractile Diagonal method. Explain the process and demonstrate the results and graphical analysis through screenshots. Bitcoin is not allowed.
In this section of the question, I'm going to be performing sell operation through a demo account with the contractile diagonal method.
On the chart of XPRUSD, the market has been in a downtrend, and it's spotted that the market was under retracement up. The candlesticks have been contracted and wave 1 to 5 have already been formed. Let's see the chart in the screenshot below.
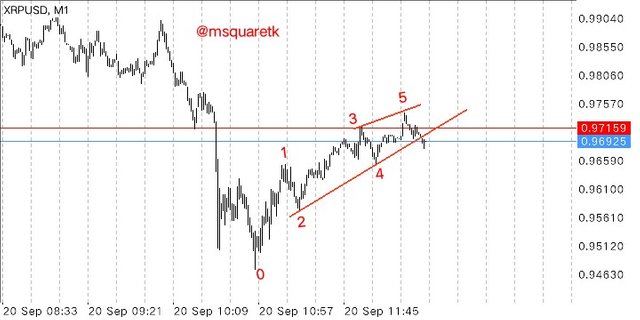
Fig 15: Chart of XPRUSD formed contractile diagonal | tradingview.com
The screenshot below shows the waves formed very clearly.
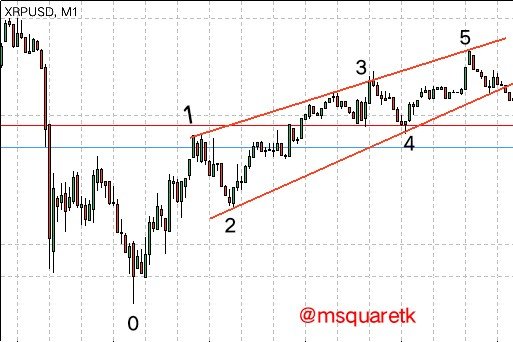
Fig 16 : Clearer Picture of Contractile Diagonal on the Chart of XPRUSD | MT4 Platform
Now, the pattern has completed its five wave and the candle has broken out the diagonal line of wave 2 and 4 which is is the signal for a short (sell).
But, before we enter the trade, there's need to confirm if the waves that formed follow the rule, that is, if they meet the criteria of operability.
Although, viewing it from the chart with my eyes, I already knew that all criteria are met. But, to make it more practical, I have decided to measure the leg of each wave to be very sure that the way criteria was met. The screenshot you about to see below shows how I'm going to measure the leg and it was taken after I performed the trade and hit my TP.
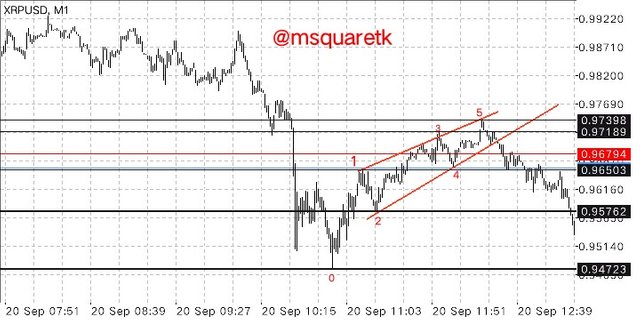
Fig 17 : Measuring the wave's leg on the Chart of XPRUSD | MT4 Platform
We must remember that wave 1 must be greater than wave 3, wave 5 must be shorter than wave 3. Also, wave 2 must be longer than wave 4. Then, wave 1, 3 and 5 must be joined together with a trend line and wave 2 and 4 should also be joined together. Below is the calculation of the movement of each wave according to the screenshot above. Black horizontal lines were used to mark the start and end of the waves, respectively.
Wave 1 = 0.96503 – 0.94723 = 0.0178
Wave 2 = 0.96503 – 0.95762 = 0.0074
Wave 3 = 0.97189 – 0.95762 = 0.0143
Wave 4 = 0.97189 – 0.96503 = 0.0069
Wave 5 = 0.97389 – 0.96503 = 0.0089
So, according the calculation, we can see that wave 1 (which moved with 0.0178) is greater than wave 3 (which moved for 0.143).
Then wave 5 (0.0089) is shorter than wave 3 (0.143).
Wave 2 (0.0074) is longer than wave 4 (0.0069).
We can now proceed to taking the trade since all criteria of operability have been met.
To open a sell order, the break out must have occurred. And this has happened on the pair. As soon as I saw the breakout, I opened an instant execution of a sell order. So, entry was immediately after the breakout, Stop loss was placed a little bit above the wave 5, and take profit was placed at wave 4 level. This gives a risk reward ratio of about 1:1.
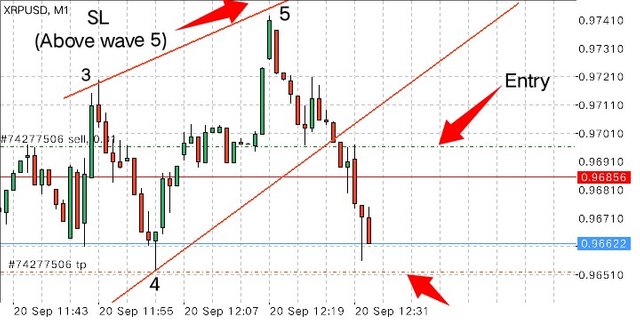
Fig 18 : Chart of XPRUSD showing SL, TP and Entry | MT4 Platform
Now, not long after the execution of the trade, the trade hit my take profit. See the screenshot below. Although, in the screenshot, you will see two entries, the second one was placed after the breakout occurred and retraced back a little bit. And I increased the lot size for the second one. But, I already placed a zoom tool to the one I took immediately the break out occurred which is the chart I shared above.
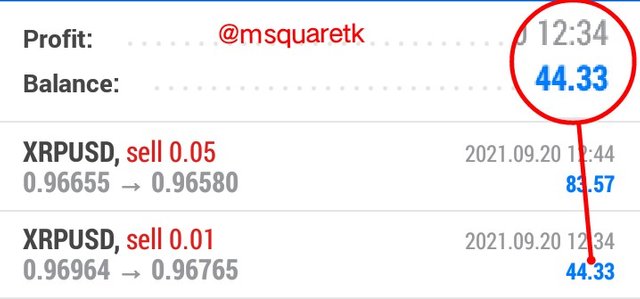
Fig 19 : The Trade Result | MT4 Platform
Let's check the chart to see how the price has moved.
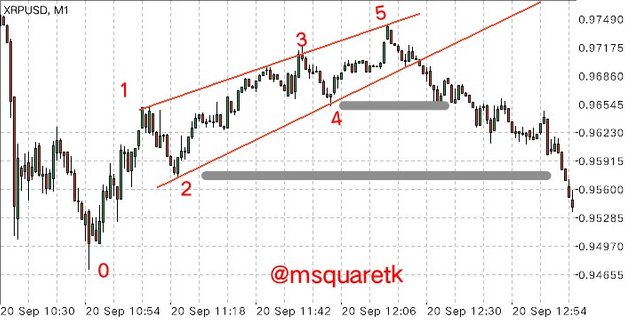
Fig 20 : The chart of XRPUSD showing how the price has moved from the breakout | MT4 Platform
As it can be seen,the price has moved significantly to the downside. Wave 4, and wave 2 can be used as take profits level since they are turning point in the market. And as we can see, it reached even to wave 4 level.

Question 5
Explain and develop why not all contractile diagonals are operative from a practical point of view. (screenshot required / Bitcoin not allowed)
This question is very important and all traders should know that no strategy is 100% accurate. The same is, for contractile diagonals. There are times when you will see this pattern formed on the chart, and you will want to trade it a direction but instead of going in your direction, reverse would be the case. It is important to know why this sometimes happen.
Firstly, when contractile diagonal doesn't meet the operability criteria, it may not be operative.
Now, for example, the chart of LTCUSD below doesn't meet operability criteria. Wave 3 which is supposed to be shorter than wave 1 is very longer. We can see in the screenshot that after the completion of wave 5, instead of the price to rally down, it just reacted a bit and later broke the diagonal of wave 1, 3, and 5 up.
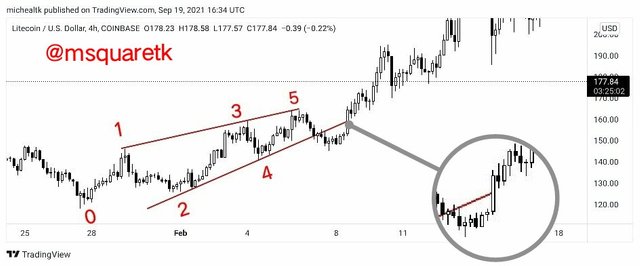
Fig 21 : An Example of Contractile Diagonal that doesn't meet operability criteria | tradingview.com
The screenshot below shows that the wave length 3 is actually longer than wave leg 1 which makes the pattern not to be operative.
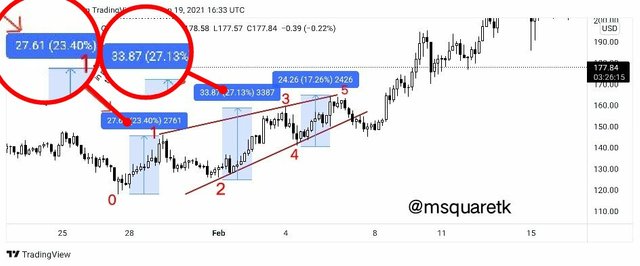
Fig 22 : LTCUSD Chart –Measuring Contractile Diagonal that doesn't meet operability criteria | tradingview.com
In the screenshot above, we can see that wave 3 is 27.13% and wave 1 is 24.3%. This shows that the pattern has violated the rule that says, wave 1 must be greater than wave 3.
Another reason why not all contractile diagonals are operative is because of the forces of supply or demand. Sometimes, forces of the demand may be greater than forces supply, so instead of the price to rally down when price contracts in an uptrend, it would rally up.
Even when the operability criteria is met, forces of supply or demand can still influence the direction of price. The screenshot below shows an example of contractile diagonal that met all the criteria, yet the the price didn't obey the pattern, instead it went up.
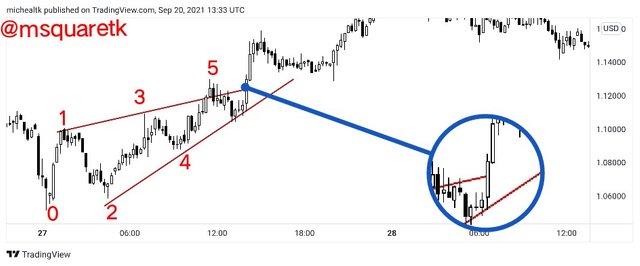
Fig 23 : Contractile diagonal that's not operative | tradingview.com
In the screenshot above, you will notice that ideally the price ought to break the diagonal line of wave 2 and 4 and price should rally down, but I didn't happen because at the completion of wave 5, the force of demand was greater than that of supply.
Before I move on, let me show you a screenshot to know that each of the wave meets the criteria.
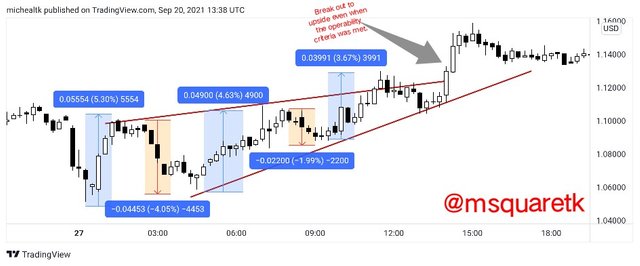
Fig 24 : Measuring the wave leg of the contractile diagonal that's not operative | tradingview.com
We can clearly see that the screenshot measures the leg of each wave. I have used price range to measure it. Each wave obeys the rule. But what we can see is that, the price didn't rally down after the completion of wave 5.
At the point of breaking upward, it's seen that the momentum or volume greatly increased. See that the candlestick that formed gave high volume. It is an evidence that the buyers or force of demand overpowered that of sellers or force of supply. It is pertinent to know that, it may not be because buyers are more than sellers, it may be because of the higher lot size pumped to purchase the asset at that particular time. And those who have capacity to drive the price of an asset at the time is called Whales. Whales may come in to the market and initiates maximum lot size to purchase the asset.

Conclusion
Contractile diagonal is one of the patterns that traders look out for on the chart because they know its importance. Contractile diagonal is a reversal pattern and can also be a continuation pattern depending on where it is formed.
This pattern is very effective when the waves leg meet the criteria of operability. The beauty of this pattern is that it can be traded on any time frame, once it meets the operability criteria.
Thanks to Professor @allbert for bringing the topic at a time like this. I have used the pattern, contractile pattern to place a demo trade and also uses the pattern to invest 17$ on TRX by analysis the chart.

CC: @allbert
Written by @msquaretk