Cover Page Created by me, @msquaretk | created on imarkup app
This is the second day in the second week of the trading competition. I have already joined the team of "fredquantum-kouba01 Traders". So, in this post, I will be giving the full details of the trade I took today, Teusday 01/03/2022. This post will show the project background of the token as well as the technical analysis done on the trading view before a margin trading is executed on binance exchange. So, follow me closely as I will be analysing the asset.

The name and introduction of the project token, and which exchange it can be traded on, project/team/technical background

Firstly, before we look into the analysis, we will look at the project background. That's the team behind the coin I am trading, the background of the token and the growth so far etc. The name of the token is ZEC. And I am going to be trading the pair ZECUSDT. I will be doing the analysis on the trading view and placing the real trade on binance exchange.
ZEC is a native token of ZEC fungible cryptocurrency. It's created by Zcash Company in the year 2016. The leader of the developers of the token is Zooko Wilcox-O’Hearn. The team comprised of the experienced engineers who have knowledge of blockchain.
ZEC runs on the principle of decentralization and the developer created the token with the aim that it's going to be used as a digital payment which make transaction as hidden. By the use of cryptographic tools, the transaction can be kept secret. ZEC is a Fungible token and that makes it difficult to track the payment because tokens are all the same and there is no transaction history.
One of the aims of creating ZEC is to offer an alternative coin to monero. Monero is also a fungible token but just that it makes transaction very difficult to understand. So ZEC aimed at giving a better feature in which the transaction would be made simple as possible. Whenever Zcash or ZEC was created, the first private key was splitted into 6 shards and these were destroyed together with the computers that processed them.
In the year 2017, Zcash foundation was launched to oversee the development of Zcash network. And in 2018, that was an upgrade which was done to improve the effectiveness and efficiency of Zcash network. At the launch of the Zcash, the way a great spike in the price die to a lot of demand which was placed on the token. But shortly, the price later came back to $100 from the highest spike level of $400.
Zcash has many uniqueness. Users can do transaction in about three ways depending on which they want to use. There's option to send transaction privately in which no single details of theirs will be seen. There's also a public option just like how payment is sent on Bitcoin and Ethereum. Shield option could also be utilized. This option protects personal information.
There's a high level of privacy in ZEC. It uses what's known as zero proof of knowledge which is a Technologist which hide some information, and this makes some things to be kept secret. ZEC uses the proof of work consensus protocol, the same protocol that Bitcoin uses. Also, the mining reward is the same as that of Bitcoin and it's halved every 4 years.
According to Coinmarketcap, ZEC (Zcash) is ranked #61 and currently trading at $116.74.
It has a market capitalization of $1, 616, 864, 818;
Volume of $240, 634, 256;
Circulating supply of 13, 849, 762 ZEC;
Maximum Supply of 21, 000, 000; and
Total supply of 13, 850, 338.
The screenshot below shows all these details according to Coinmarketcap.
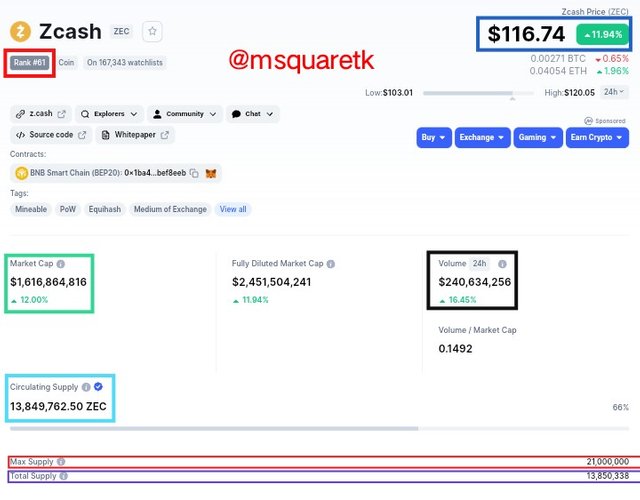
Screenshot from CoinMarket Cap| SOURCE
Exchange It can be Traded
ZEC can be traded on many exchanges. And it's been paired with different coins or tokens. Some of the Exchanges where ZEC can be traded are: Binance, Gate.io, Huobi Global, Kraken, Kucoin etc.
The screenshot below shows some of these exchanges according to Coinmarketcap.
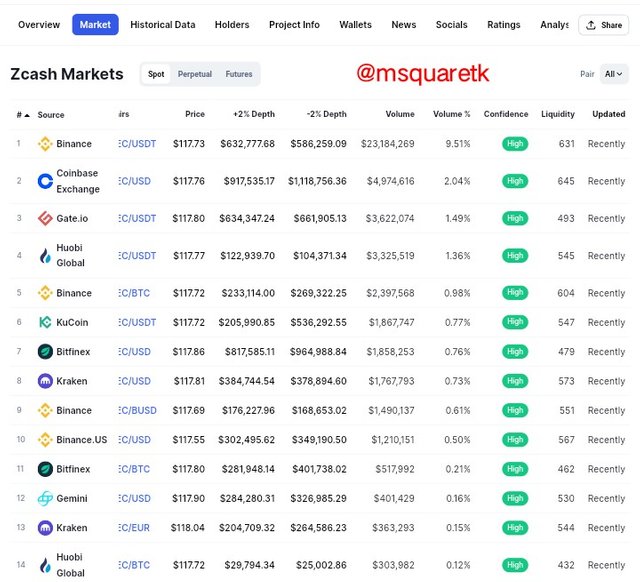
Screenshot from CoinMarket Cap| SOURCE

Why are you optimistic about this token today, and how long do you think it can rise?

I'm optimistic about this token because it's at a very key resistance level which could reverse the price to the downside. For some times, the price of the token has been in a bull run and now, it seems it encounters a big obstacles called resistance which can resist the price and turn the trend to a bearish trend.
So, in essence, I'm willing to sell the token because of the analysis i have done and noticed that the price may turn ti the downside and i can take advantage of that.
Now, having seen the project background of the token, the founder (s) , the growth so far and the exchanges it can be traded, let's move to technical analysis.

Technical Analysis of the Token, ZECUSDT

In this part of the task, I am going to be giving a detailed technical analysis of the trade I took on the trading view. The analysis will comprise of the strategy I employed to take the trade and also show the real trade on binance exchange. The pair I'm going to be trading is ZECUSDT
The long term bias of ZECUSDT is towards the bearish trend as it's seen on the chart. But for some times, the has been retracement to the upside on a H4 timeframe. Looking at the chart below, you will see that the price rallies to the upside after a considerable fall in price.
Then, right now, the retracement seems to be coming to a close as the price is on a very key resistance level. If you look at he zone marked with green rectangular box, you will notice it has been a very key area which supported and resisted the price for many times. In addition, price is at the upper bollinger band. When price gets to the upper band, there's a high tendency that the price will turn to the downside because upper band of bollinger serves as a resistance.
Also, looking at the Stochastic oscillator, the price has entered the overbought region and the lines of stochastic have just been crossed. When that happens, price may experience a tutor in the market and the crossing of the lines is usually a sell signal which traders look for in the market.
See the screenshot below.
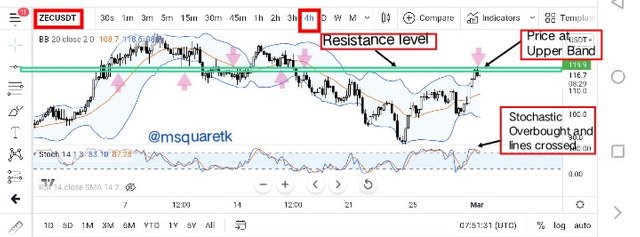
Screenshot from Trading View | SOURCE
Now, looking at H1 timeframe, I could see that the price has also touched the upper band and it has already resisted the price. Stochastic oscillator also shows that the price is overbought and we can see the lines of stochastic cross at the overbought region.
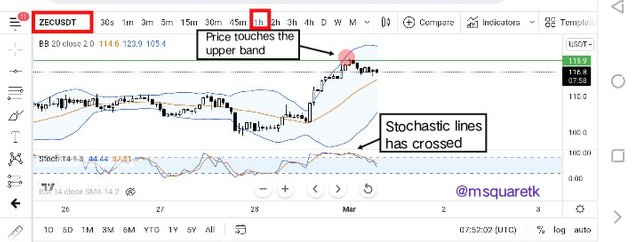
Screenshot from Trading View | SOURCE
On M15 timeframe, it can be seen that price follows an uptrend to the peak of that trend. And during the time we saw price moving between the middle band and upper band which is a confirmation that the trend is bullish. But, at the peak of the trend, the formation changed. The price crossed down the middle band which is a signal for reversal.
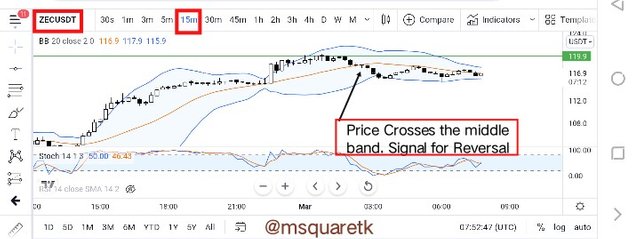
Screenshot from Trading View | SOURCE
Then M5 timeframe shows that triple top formed on the key resistance level identified on H4 timeframe. Triple top is a chart pattern which forms at the peak of an uptrend. It's a reversal pattern which traders look for to take trade decisions. It's usually formed as a result of in ability of the buyers to push price above the last high created. So there's always a kind of argument between sellers and buyers which always favor the sellers in the long run because buyers are always exhausted.
Then, we can see that the a trend has been forming. The price has started making lower lows and lower highs. See the screenshot below.
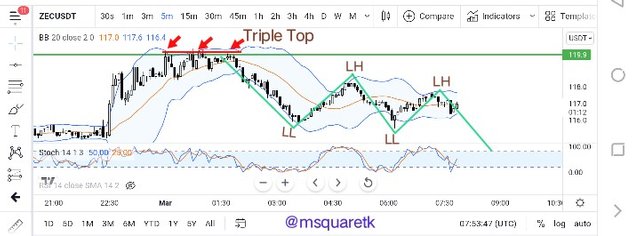
Screenshot from Trading View | SOURCE
Upon having confluence , many reasons to take the trade, I opened a sell order at the entry price of $117.1, which is the current market price. The stop loss was placed above the triple top created at $122.9. If the price should go up and hit the level, that would be that the set-up is invalid. The take profit was placed at a nearest support level at $105.2. See the screenshot below.
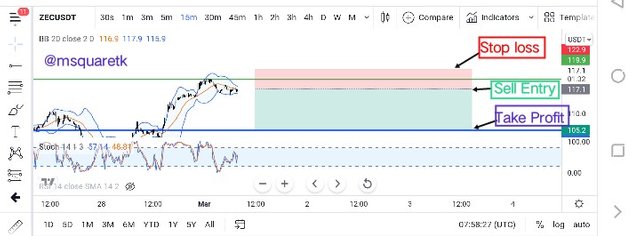
Screenshot from Trading View | SOURCE
Then upon having the exit and entry price level on trading view, I placed an instant execution using margin trading on Binance exchange. The screenshot below shows when I was placing the trade.
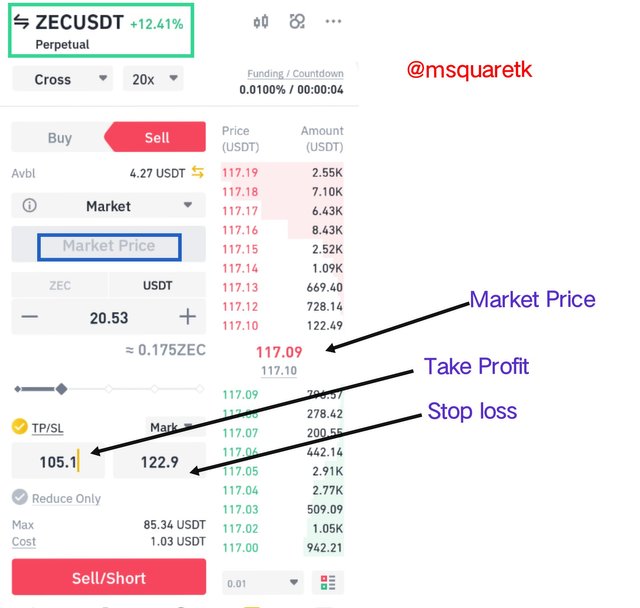
Screenshot from My Binance App
Also, the screenshot below shows the trade, ZECUSDT running. It's was taken immediately after the execution.
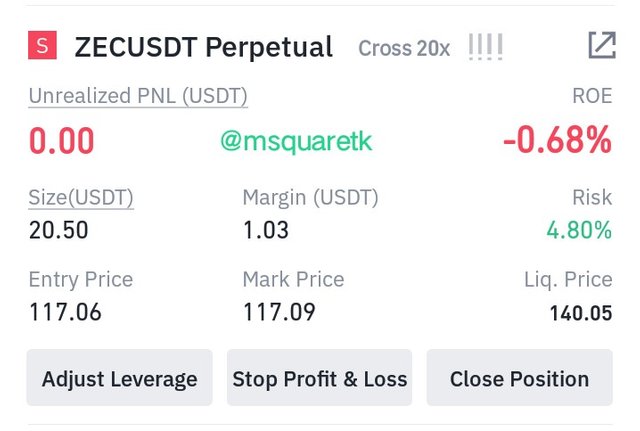
Screenshot from My Binance App
The trade may take a while before it hits my exit. I will update the result once it does that and also will upload all the results of each day on Google form on Saturday.

Your plan to hold it for a long time or when to sell?

I do not plan on holding the asset for long. The reason is, I just wanted to take advantage of the price movement and also it's not an anlaysis that will take long time before I will hit the exit. And also, I'm not in possession of the asset because I did margin trading and not spot trading. So, once the price hits my exit (either take profit or stop loss) , I will be out of the market and that will be the end if the trade.

Do you recommend everyone to buy? and the reasons for recommending/not recommending

The asset I traded is ZECUSDT and I took sell order and not buy. However, if I would recommend people to sell the asset, then it would be when I sold it. And my recommendation would be based on my analysis. I have many reasons to take the sell trade at the time as many tools confirm the bearish trend if the asset. Hence, my recommendation would be that they sell at the time and manage their risk very well because cryptocurrencies are very volatile.

Conclusion

In this second post for the second day of the week 2 of the trading competition, I have been able to show the project background of the token traded, the founder,and the exchange the token can be traded. I have also used the strategy I have learnt to do a technical analysis on the trading view platform, and then proceeded to take a real sell order using margin trading on my Binance exchange app.
Thanks to the Admins and my team leaders @fredquantum and @kouba01. I am glad I am participating in the second week of this competition. I will upload the results of each trade to Google form and take a short video of the results.

Consulted Article 1 source
Consulted Article 2 Source
CC: @fredquantum
@kouba01
Written by @msquaretk