

Introduction

Hello Crypto Lovers,
It is another wonderful week again at the Crypto academy. I hope you have been enjoying this week so far. I am Kehinde Micheal and my username is @msquaretwins here on this platform. I have studied the lecture presented by Prof. @lenonmc21 on Basic “Price Action” Strategy EMA + Trend Line Break in the dynamic beginners course. Therefore, in this post, I will be answering the questions posted in the in the homework section based on my understanding. Happy reading!
THEORY

1. Define and Explain in detail in your own words, what is the EMA Strategy + Breakout of the Trend line?

The EMA Strategy + Breakout of the trend line is one of the strategies that used for trading financial assets. This strategy consist of two things, Exponential Moving Average(EMA) and Break out of trend line.
Exponential Moving Average(EMA) is a line that is drawn on the chart of an asset which is used to determine the direction of an asset by calculating the average data for the specified period. It takes into account the immediate data in market while the price is running. The exponential moving average used for this strategy is 100 period EMA. This period is used to determine the overall bias or general bias (general trend) of an asset. It helps to determine the trend in the sense that when the price of an asset is trading above the EMA line, the asset is said to be in a bullish trend and when the price of an asset is seen below the EMA, the asset is said to be in a bearish or downward trend.
Then after the confirmation of trend direction from EMA and determination of market cycle and harmony, a trend line would then been drawn. A trend line is a line that join the maximum and minimum point that the price made within a period to give clear dominant trend at that period. This trend line is drawn against the dominant trend. For example, if an asset is in bullish phase as confirm by EMA, the trend line would be drawn targeting the maximum and minimum point of the retracement of the bullish trend. The break out of the Trend line would be monitored such that the trend goes back to bullish trend and traders take advantage of it.
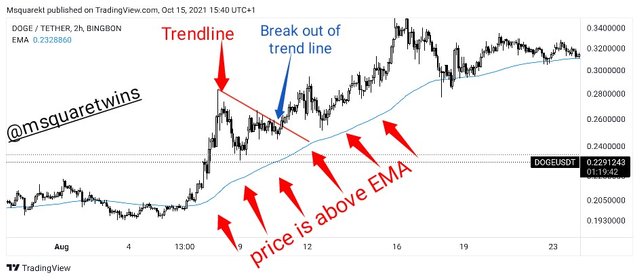
The screenshot above give more explanation of EMA + Break out of Trend line strategy. The chart above is a chart of DOGE/USDT. As seen from the screenshot, the EMA is below the price, thus means that the price is trading above the EMA which signify bullish trend. Then at a retracement of the trend, a trend line is drawn from the maximum point of retracement to the next minimum point as indicated by a red trend line in the picture above. Then the break out of trend line occur which is indicated by a blue arrow in the screenshot. Traders who use this strategy often take a buy order immediately at the break out of the trend line to ride the continuation of the bullish trend.

2. Explain in detail the role of the 100-period EMA in the EMA + Trendline Breakout Strategy?

As mentioned earlier the EMA is a technical indicator that help traders to determine the trend of an asset. There are different period of EMA used by traders to determine the trend of an asset in market. Base on the type of traders or the strategy each trader used, EMA can be set to different period.
Short periods of EMA like 10, 15 and 20 are used to determine the immediate bias of an asset. But for this strategy 100 period EMA is used. The role of this 100-period EMA is to determine the general trend or general bias of an asset. The general bias of an asset is determined when the price is trading above or below the EMA depending on the market that is under consideration. To confirm that an asset is bullish, the price must be trading above the 100 Period EMA. And for an asset to be in a bearish trend, the price must be trading below the 100-period EMA.
Let's see example of this in a chart below.
The screenshot below is a chart of DOGE/USDT. The price of DOGE/USDT is above the 100-period EMA, that means the price is trading above the EMA and that confirm the bullish trend at this period.
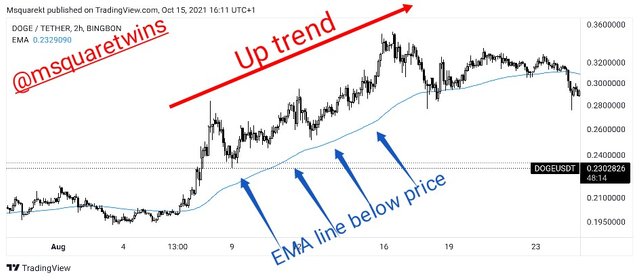
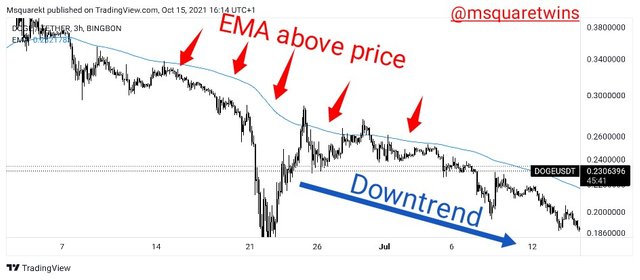
The screenshot below shows 100-EMA above the price of DOGE/USDT. That means the price is trading below the 100-period EMA. In this case, the asset is bearish as indicated in the scrwenshot below.

3. Explain in detail the role of the "Trend Line" in the EMA + Breakout Strategy Trendline Breakout?

Trend line is one of the great technical tools that is mostly used by traders. It forms the basic tool for pattern drawing which is used to determine direction. Trend line is also used to represent dynamic support and resistance level. It is used to show price movement over a period of time.
Trend line in EMA + breakout strategy is simply used for trade signal. How does that work? Now, we know that the trend is bullish if price is trading above the EMA. Which means, a buy order is always on the look out for. And we also know that even in a bullish trend, there is always retracement of each bullish leg. Then, how do we know when exactly to enter a buy order. Is it at the middle of a bullish leg? Is it at a retracement? This is where trend line used in EMA + breakout strategy comes in.
Trend line is drawn from a maximum to a minimum point against the dominant trend which means the trend line would be at the retracement of any dominant trend under consideration. Then when the price break out the trend line, the order would be taken.
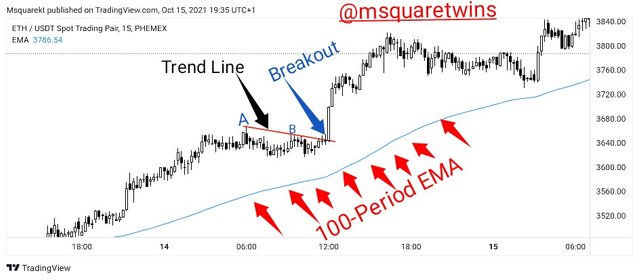
The screenshot above is a chart of TRX/USDT. As seen in the screenshot, the price is trading above the 100- Period EMA which then indicate bullish trend. Now, the trend line is drawn from point A which is the maximum point to point B which is the minimum point against the dominant trend, i.e the current bullish trend. Then after a while, there was a break out of the trend line as indicated in the screenshot by a blue arrow and the price continue in the bullish trend afterward. Immediately at the breakout, traders often take an order in line with the dominant trend. In short, The trend line in the EMA +break out strategy helps to determine the entry point.

4. Explain the step-by-step of what needs to be taken into account to execute the EMA + Trendline Breakout strategy correctly?

There are three major steps that need to be taken into account to have a great execution of EMA+Trend line break strategy. I will explain them with the help of screenshot below.
Step 1: Adding EMA -100 to the Chart
The first step is to add 100-Period EMA to the crypto pair under consideration. When this is done, we know check what the price is doing at that time in regards to the 100-EMA indicator that has been added. Of the price of the asset is trading above the 100-Period EMA indicator, it means the trend of the asset is bullish at that period. But if the price of the crypto asset is trading below the EMA indicator, the trend at that period is said to be bearish.
Below is the screenshots of the TRX/USD asset and the EMA indicator depicting the bullish and bearish trend.
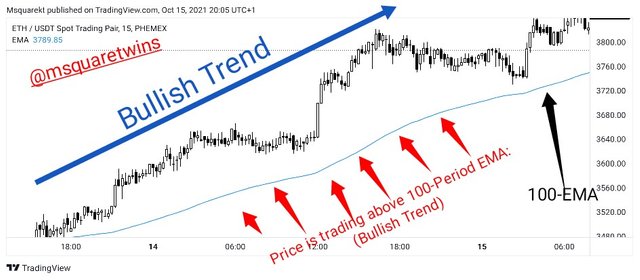
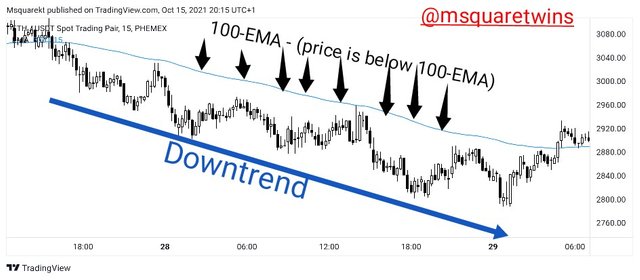
Step 2: Recognition of Market Structure and Cycle
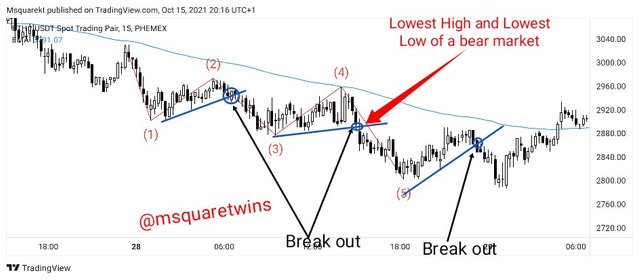
The next thing after placing 100 EMA and identifying the trend the asset is the recognition of market structure and cycle. Price direction must be harmonious with market structure and cycle. The proof that this strategy will work means that there should be degree of harmony between price direction and market structure. For instance, if after placing the EMA indicator, the asset is confirmed bullish. Then the market cycle must be inform of higher high and higher low. And that the next high must be higher than the previous high and the next low must be higher than the previous low. Otherwise, it is considered invalid.
The two screenshot below show harmony between the market structure and EMA im both bullish and bearish trend.

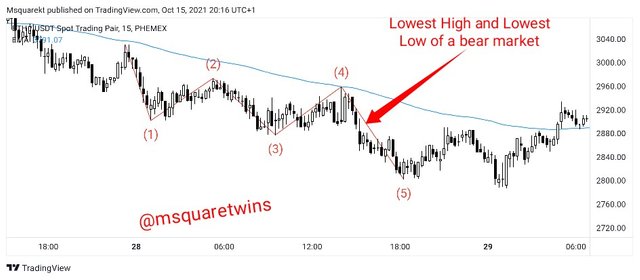
Step 3: Drawing the Trend Line
After the harmonious agreement of market structure/cycle and the price movement, the next step is to draw trend line. The trend line is drawn against the dominant trend. For instance, if the dominant trend is a bearish trend, the trend line is drawn to connect the high and low of a retracement leg. I.e the Trend line would be bullish. In this case the downward break of the trend line drawn is always on the look out for so that an order to trade lower in the direction of the dominant trend is taken.
When the trend is in the uptrend, the trend line drawn will be bearish. That means the upward break of the trend line would be the target to take an order in the upside direction to take advantage of the dominant trend.
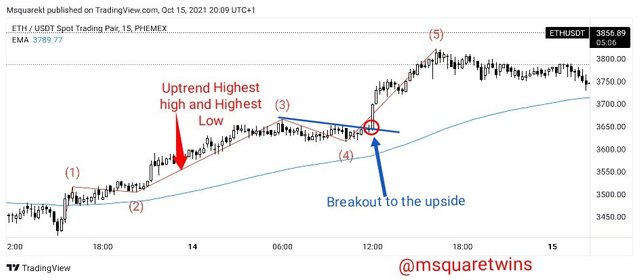

5. What are the trade entry and exit criteria for the EMA + Trend Line Break strategy?

The entry criteria goes thus;
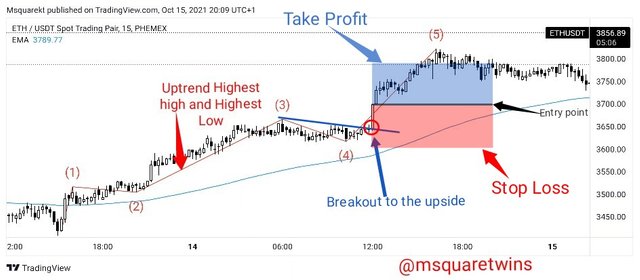
• Once we have determined the trend of an asset by placing 100-Period EMA on the chart, the next thing is to determine the harmony between the trend of the asset and the market structure and cycle by taking note that the agree. For instance, for bullish trend, the price should be making series of higher highs and higher lows and for bearish trend, lower highs and lower lows should be made by price.
• Then the bearish or bullish trend line is drawn and then wait for a candle to break the bearish or bullish trend line upward or downward and that the candle must close above or below. This will then give trade signal.
• But if the price movement of an asset and the market structure do not agree together or the price is seen not to agree with market cycle, then it will be discarded and look for another opportunity that best suit the trading strategy.
• Now, once we have a break of trend line, we then enter the market placing the stop loss at the most recent high or low depending on the market direction under consideration. Then once this is put in place, take profit is set to the same percentage with the stop los making it 1 ratio 1 order.

PRACTICE

1. Make 2 entries (One Bullish and one Bearish) in any pair of "Cryptocurrencies" using the "EMA Strategy + Trend Line Break" (Use a Demo account, to be able to make your entry in real time at any timeframe of your choice, preferably low temporalities)

For this question, I will be using ETHUSD to perform the buy operation and I will be using DASHBTC for Sell entry.
Buy Entry
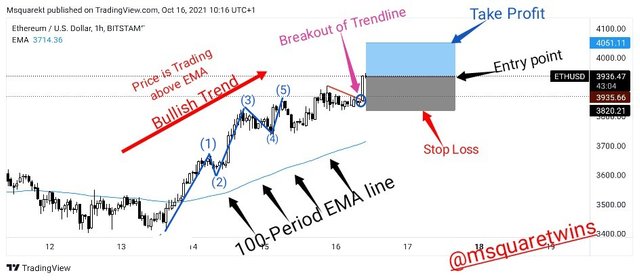
•The picture below shows the chart of ETH/USD. As seen in the picture, The 100-Period EMA is below the price of ETH/USD. This means that the price is trading above the EMA and this confirms that the trend is bullish.
• Then there is harmony between the price and the market structure as confirmed by the wave described in the screenshot. The market cycle keeps giving highs and low with the next high being higher than the previous one and the next low higher than the previous one as seen in the screenshot below.
• Then a trend line is drawn against the dominant trend and a break out happened and a buy order was taken with;
Entry price = $3,935.66
Stop loss = $3,820.21
Take Profit = $4,051.11
• The screenshot below shows the buy entry on MT4 Trading App. The entry point is indicated by a black arrow in the screenshot. The stop loss is indicated by a red arrow and the take profit by a blue arrow.
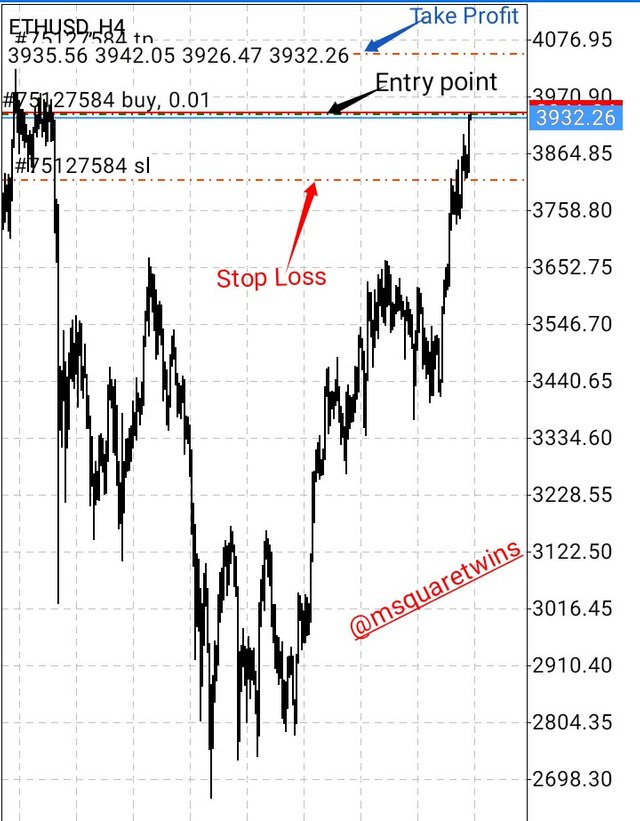
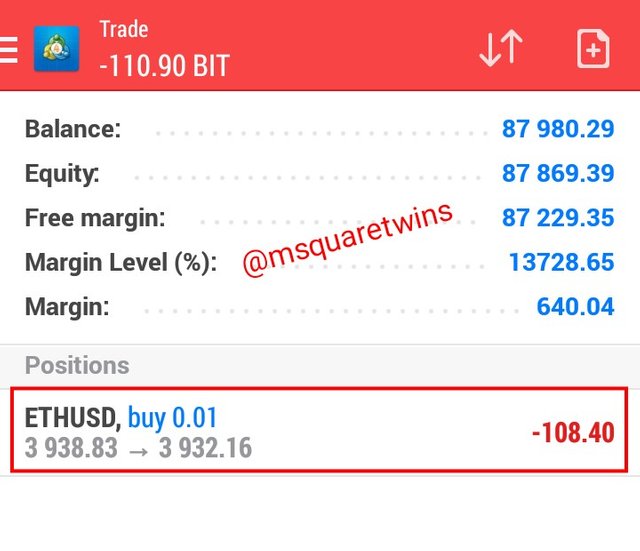
• Lastly, the screenshot below shows the running order of ETH/USD in the MT4 App.
Sell Entry
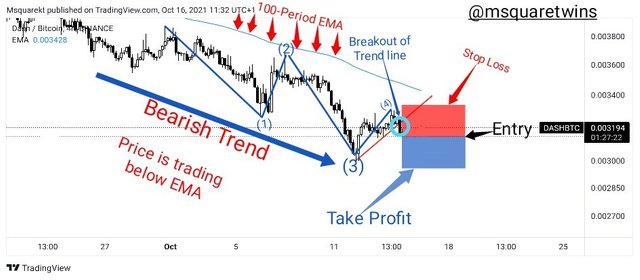
• The chart below is a chart of DASH/BTC. I observed that the asset is in bearish trend after placing 100-Period EMA. As seen in the screenshot below, the price is trading below the EMA that confirms that the trend is bearish.
• Then after the identification of the trend direction of DASH/BTC, I checked for harmony between price and market structure/cycle and I saw that they agreed as there are series of lows and highs in which the next high is lower than the previous one and the next low is lower than the pervious low as indicated in the screenshot by wave.
• Then I drew trend line against the dominant trend. I.e The trend line drawn is a bullish trend line. And I waited perfectly well for a break to the down side to ride in line with the dominant trend. After the breakout of the trend line, I placed a sell order with:
Entry = $0.003188
Stop Loss = $0.00332
Take Profit = $0.00304
• The Sell order entry is displayed in a screenshot below as taken from MT4 trading App. The entry point is indicated by a black arrow, the stop loss and take profit are indicated by red and blue arrow respectively as seen in the screenshot below.
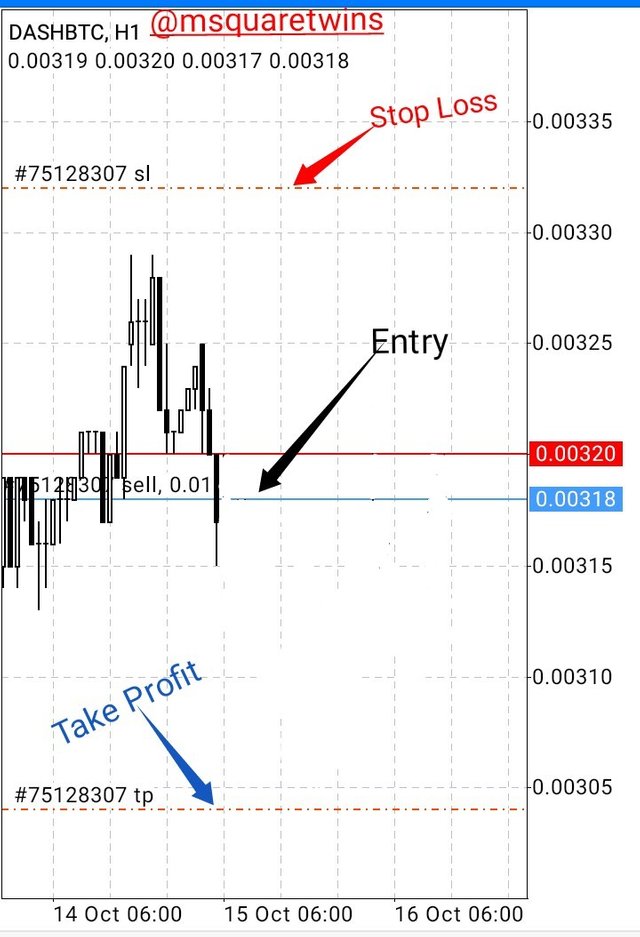
• Finally, the running order of DASH/BTC is uploaded below.


Conclusion

There are many strategy traders used in crypto trading to get both buy and sell signal. In this task I have learnt how to effectively used EMA + Trend Line Breakout strategy to make trade entry.
Additionally, I was able to make two entries, buy and sell entries by using the said strategy. The EMA + Trend line require patience and close monitoring of the candle that break the trend line. Therefore, one thing a trader can do to effectively monitor the breakout especially when the trend line is drawn using higher timeframe is to set trade alert few pips a below or above the trend line, so as to get notified when price is about to break the trend line.
Special thanks to Prof. @lenonmc21 for this wonderful lecture. It added a whole lot to me. I hope to participate in your next class.
Written by :- @msquaretwins
Cc:- @lenonmc21