
Introduction

Hello Crypto Lovers!
Today is an awesome day for me, though was very hectic. I am Kehinde Micheal and my username is @msquaretwins here on this platform. I am happy to be submitting my homework post for Professor @fredquantum who presented a topic on "Crypto Trading Strategy with Triangular Moving Average (TRIMA) Indicator". I will be presenting my answers based on my understanding.

1. What is your understanding of the TRIMA indicator?

Indicators are important tools that are used to predict the direction of an asset over a period of time. They are technical tools that also help traders to determine the strength, momentum and point of price reversal of an asset. The importance of the indicator in technical analysis can never be overemphasized. There are numerous types of indicators used for technical analysis, and each has its strength and weaknesses.
Moving average indicator is one of the most commonly used indicators traders used to determine the trend of an asset. Though, the indicator is considered as a lagging indicators because it majorly uses the past market data for its calculation, and as such it does not give present value. Therefore it lags behind price. There are so many types of moving averages; Weighted Moving Average, Exponential moving average, Triple exponential moving average, Smoothed Moving Average etc. The one I will be talking about in this question is Triangular Moving Average (TRIMA)
Triangular Moving Average (TRIMA) is a type of moving average indicator that is used to determine the trend of an asset in market. This indicator find its root in Simple moving average. The simple moving average uses the past market data to calculate it value and then get the average value while its line move on the chart along the direction of price. The same is true for Triangular moving average, just that triangular moving average is different to simple moving average in the sense that, while Simple moving average calculate the average closing price, TRIMA do it twice, i.e it is averaged twice. As such, TRIMA does not go quickly along with price like Simple moving average.
It calculate the double average and it can be said to be double smoothed indicator. Triangular Moving average indicator unlike simple moving indicator gives a very line. Another importance of Triangular moving average indicator is that it does not react to high volatility caused by impact news and unnecessary price reaction to fundamental news.
Key important notes about Triangular Moving Average Indicator
- The indicator does not react quickly to price as does the simple moving average.
- The trend presented by this indicator is very clean and clear even when compared with simple moving average.
- It does not give sharp reaction to high volatile crypto price which arises from impact news and fundamental news in market.
- It is used to identify the trend of an asset in market and it can be combined with other indicator to take trade opportunity in market.

2. Setup a crypto chart with TRIMA. How is the calculation of TRIMA done? Give an illustration. (Screenshots required).

Adding TRIMA indicator on chart is very simple. To do this open tradingview website and then launch a chart.
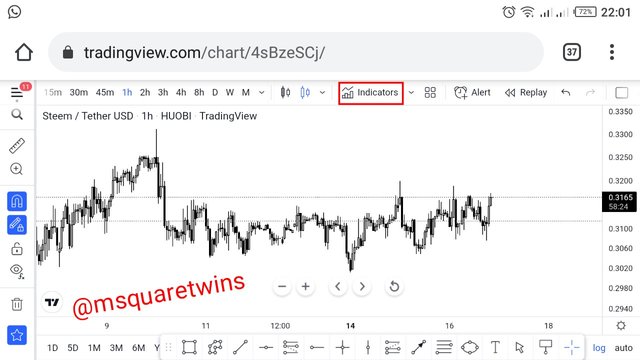
From the chart page, locate indicator icon at the top of the ribbon and then click it as indicated in the screenshot below by a red box.
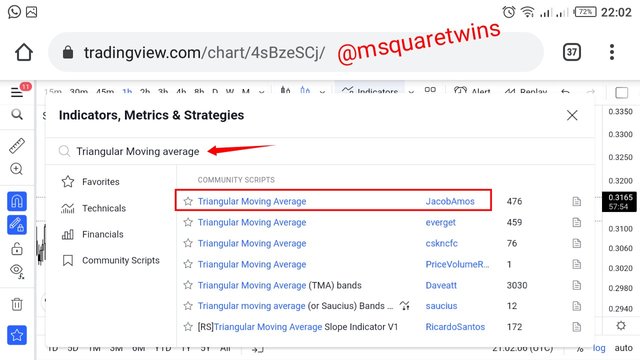
Then the indicator page will appear for you, then type TIMA on the search bar of the indicator as and then click on it as indicated by a red box in the screenshot.
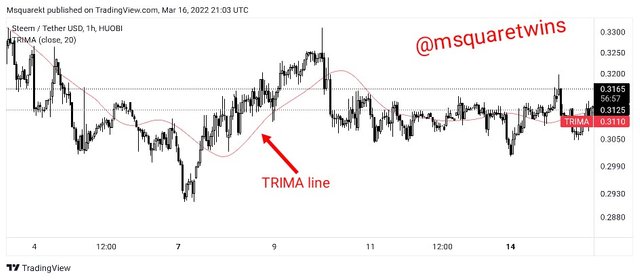
Then we have the indicator added to the chart as seen below.
Calculations of TRIMA
As rightly said, TRIMA is the double average price of that of SMA. For this reason we will first take note of the calculation Simple moving average.
Simple Moving average: (P1 + P2 + P3 +.. + Pn)/n.
Where P1- 3= The asset price considered for 3 periods consecutively.
Pn = price of the last period.
n = Total number of period under consideration
Then the formula for TRIMA imdicator can be gotten now. We simply use SMA to get the value of TRIMA.
TRIMA = (SMA1 + SMA2 + SMA3 + .. + SMAn)/n.
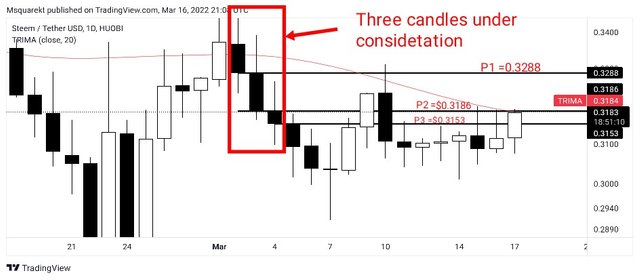
The picture uploaded below is for the illustration of the calculation. written above.
Let us assume we wan to consider 3 days for our period.
Therefore,; n = 3, period under consideration.
Hence;
SMA = (P1 + P2 + P3)/n
P1 = $0.3288
P2 = $0.3186
P3 = $0.3153
SMA 1= (0.3288 + 0.3186 + 0.3153)/3
=$ 0.9625
SMA 2 = (0.3000 + 0.3159 + 0.3190)/3
= 0.9349
SMA 3 = ( 0.3420 + 0.3165 +0.3111)/3
=0.9696
TRIMA =(SMA1 + SMA2 + SMA3)/3
TRIMA = (0.9625 + 0.9349 +0.9696)/3
TRIMA = $0.9557

3. Identify uptrend and downtrend market conditions using TRIMA on separate charts.

Uptrend Identification with TRIMA Indicator
Indicator are good identification of uptrend, downtrend and sideway market. But the settings used for indicator length or period can make the identification easy or simple. Likewise, TRIMA is a powerful indicator that can be used to identify both bullish trend and bearish trend over a particular period of time. But short period or length can make the identification of bullish trend difficult. Therefore, it is advisable to use period that will help traders to correctly identify both trends in market.
In TRIMA indicator, an asset is said to be in a bullish trend (uptrend) when price is trading above the TRIMA indicator line. This means that the indicator line will be seen clearly below the price before we can have a bullish trend. An example of a bullish trend is uploaded below in a screenshot.
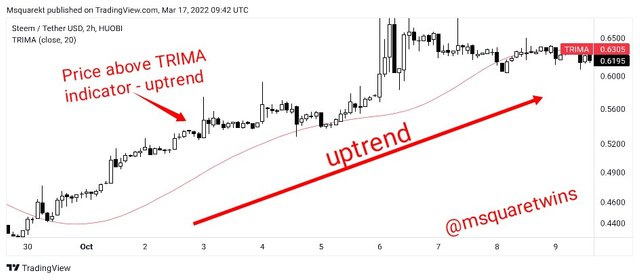
As we can see from the screenshot above, we have price making a series of higher highs and higher lows and the TRIMA indicator is seen below the price of an asset.
Downtrend Identification with TRIMA Indicator
The opposite of what happen in a bullish trend will occur for downtrend market. In a downtrend, the price of an asset will keep trading below the TRIMA indicator as price is making series of lower highs and lower lows. This means that, TRIMA line will be above the price of an asset during a downtrend market. An example of a downtrend as identified by TRIMA indicator is uploaded in a screenshot below.
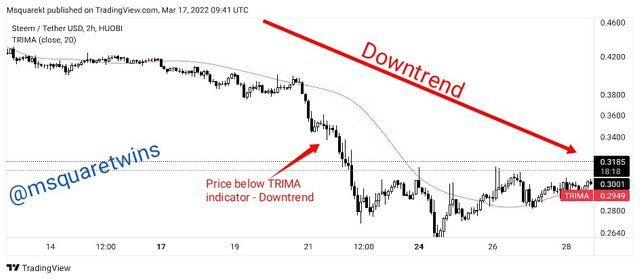
As we can see from the screenshot above, we have STEEM/USDT asset making a series of lower highs and lower lows and the TRIMA indicator is above the price of this asset. This confirm that the asset is in a bearish direction.

4. With your knowledge of dynamic support and resistance, show TRIMA acting like one. And show TRIMA movement in a consolidating market. (Screenshots required).

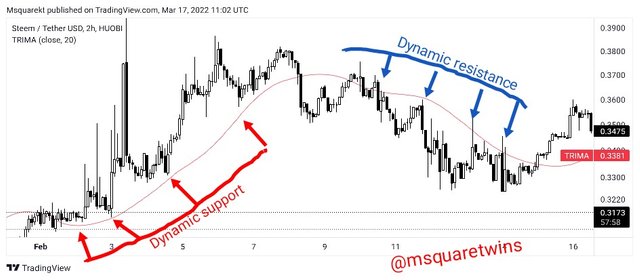
In finance trading, moving average is one of the many indicators that can act as dynamic support and resistance, and Triangular Moving average is a type of moving average that can also be used for this course. TRIMA can act as both support and resistance. We can say that TRIMA act as support and resistance when price keep bouncing back to the opposite direction at the touch of the TRIMA line while price is moving up or down.
For instance, Let take a look at the screenshot uploaded below for more clarity. As seen in the screenshot, we can see that price was makong a series of higher high and low at the left side of the chart and we see how TRIMA line acts as dynamic support here as price keeps reversing back at the touch of the TRIMA line. When a retracement of impulsive leg during an uptrend keep reversing back to the upside at the touch of a TRIMA line, it means the TRIMA line acts as a dynamic support in this case.
The opposite of dynamic support is dynamic resistance. In this case, price bounces back to the downside at the touch of a TRIMA line as indicated by a blue arrow in the screenshot. We can see how price rejecting the TRIMA line at every touch of the line, also in this case, TRIMABindocator act as dynamic resistance.
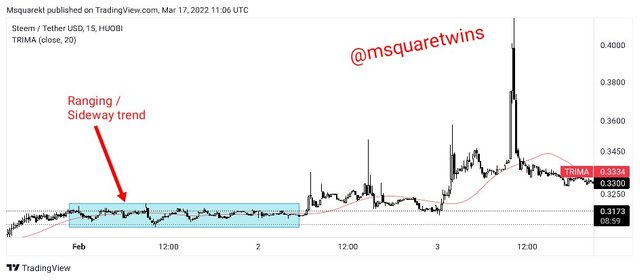
Picture of behaviour of TRIMA indicator for consolidating market is uploaded below. consolidating Market is a market in which there is no clear direction of price movement. This market is also called ranging or sideway market. We can see the behaviour of TRIMA indicator during a consolidating market as indicated by a blue box in the screenshot below. We see how price keep going up and down in a range and we see that the TRIMA line is just within the price and this is the case for sideway market.

5. Combine two TRIMAs and indicate how to identify buy/sell positions through crossovers. Note: Use another period combination other than the one used in the lecture, explain your choice of the period. (Screenshots required).

As earlier stayed, TRIMA indicator does not quickly follow price movement in market because it a double smoothed indicator. And if a trader based his entry strategy only on this indicator, price might have moved so far before he enters an entry order in market. Therefore to combat this menace, traders can add two TRIMA indicator to make a good buy or sell entry.
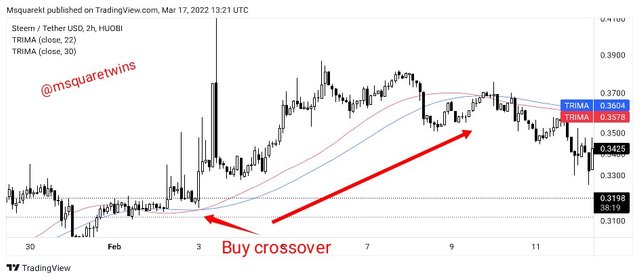
Now let look at the buy and sell opportunity in the crossover of two TRIMA indicator below. I have added two TRIMA indicator to a STEEM/USDT chart below. One of the indicator has a shorter period which is 22 and the second one has a longer period which is 30. I choose this period because it will give me clear trend based on 2 hour time frame chart I am using.
For a buy signal, when a shorter period crosses thw longer period, it signifies an uptrend and traders can take advantage of this crossing to take a buy order.
As we can see from the screenshot uploaded below the 22 TRIMA(red line) crossed the 30 TRIMA (blue) line and shortly after this crossing, the asset bought and traded higher. So with this, traders can open a buy position and make good profit by taking advantahe of this crossing.
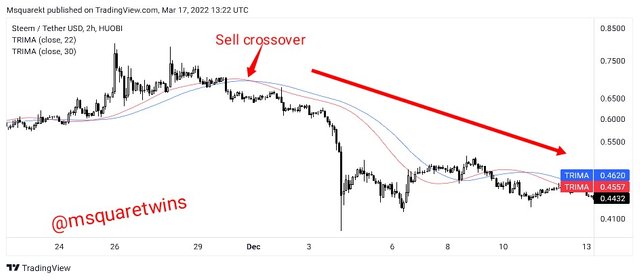
For a sell entry, the longer period crossing the shorter period will indicate and confirm a sell order. The picture below shows an example of a sell crossover. As we can see in the screenshot uploaded below, longer period crossed the shorter period and the asset fell heavily. Therefore, traders can take advantage of this as well to make a sell entry.

6. What are the conditions that must be satisfied to trade reversals using TRIMA combining RSI? Show the chart analysis. What other momentum indicators can be used to confirm TRIMA crossovers? Show examples on the chart. (Screenshots required)

Reversal can be difficult to trade with TRIMA indicator alone. Therefore, when TRIMA is used with some momentum indicators, it can be effective in identifying reversal in market. In this question, I am going to add the RSI indicator to the chart and I am going to tell you how you can use the TRIMA in conjunction with RSI for effective trading.
Guidelines for Trading Bullish reversal
- Understand the current trend. Before you can trade bullish reversal, price must have been in a downtrend prior to getting bullish signal for reversal.
- Add two TRIMA to your chart, one shorter and the other longer. You may use 22 and 30 TRIMA or any other periods you are cool with.
- RSI indicator must entered the oversold region. This would mean that the selling pressure has started reducing.
- After RSI entered the oversold, be patient and wait to see the buy crossover. This means that TRIMA shorter period will cross longer TRIMA.
- Place a buy after a buy confirmation from candlestick like bullish engulfing, morning start or any other bullish candle.
- Ensure proper risk management. Stop loss order should be placed below the previous low and 1:1 risk to reward ration is advisable for someone using the indicator for the first time.
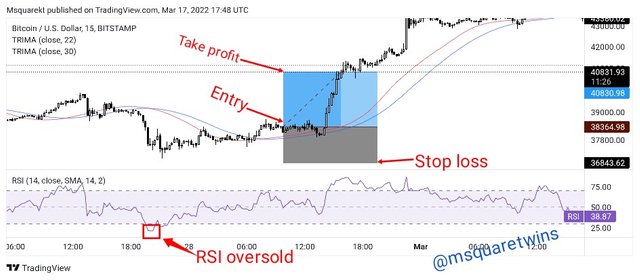
As seen from the chart above, we can see that the asset has been on a bearish trend for a while, but at some point, the selling pressure reduced and the RSI indicator eventually entered the oversold region. This informs us that the trend is about to reverse. Shortly after this, crossover of the TRIMAs occurred as we can see. This is then a perfect opportunity to take a buy position and I did.
Guidelines for Trading Bearish reversal
- Know the current trend. Before you can trade bearish reversal, price must have been in an uptrend prior to getting signal for bearish reversal.
- Add two TRIMA to your chart, one shorter and the other longer.
- RSI indicator must entered the overbought region, and this would indicate that buying power is fading away.
- After ovebought condition of RSI, be patient and wait to see a sell crossover. This means that TRIMA longer period will cross shorted TRIMA.
- Place a sell order after a sell confirmation from candlestick.
- Ensure proper risk management. Stop loss order should be placed above the previous high and 1:1 or 1:2 risk to reward ratio is advisable for traders that are just using the indicator for the first time.
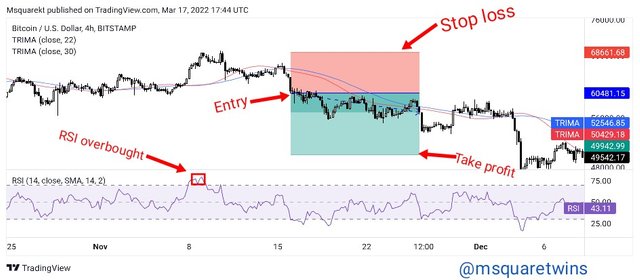
From the picture above, we can see that the asset has been on an upward trend for a while, but at some point, the buying pressure reduced and the RSI indicator entered the overbought region. This informs us that the trend is about to reverse. Shortly after this, crossover of the TRIMAs occurred as we can see. This is then a perfect opportunity, and I took a sell order.
TRIMA and Volume Indicator
Another Indicator that can be used to confirm TRIMA crossover is a volume indicator. Volume indicator shows or reflect the volatility in market at every point in time. When a market is ranging, the volume will be flat and when a market is trending, there will be high volume in market. We know that for a reversal to occur in market, there will be slow movement of price a bit, volume indicator is capable of showing what is going on in market at this period, and when combine with crossover strategy of TRIMA indicator, it can be so effective.
Another important of this is the ability of volume indicator to identify convergence and divergence at area of reversal in market. Therefore, I believe volume indicator can help traders to further confirm crossover TRIMA strategy.
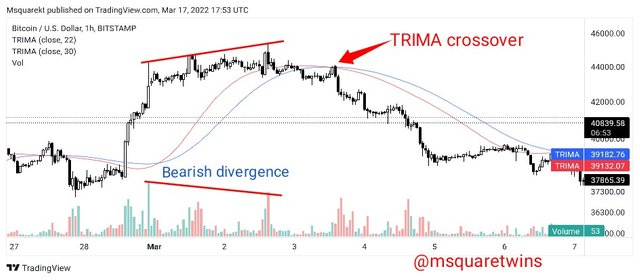
As we can see from the picture uploaded above, close to the end of the bullish trend, price made higher highs while the indicator makes lows and this is what is called bearish divergence. When this happen in market, reversal of the current trend is about to happen. And shortly after this, we see cross over of TRIMAs, and the asset sold heavily. Therefore, the understanding of a bearish divergence from volume indicator with TRIMA indicator can be of help in making good trading decision.

7. Place a Demo and Real trade using the TRIMA reversal trading strategy (combine RSI). Ideally, bullish and bearish reversals. Utilize lower time frames with proper risk management. (Screenshots required).

DEMO Trade of LUNA/USDT
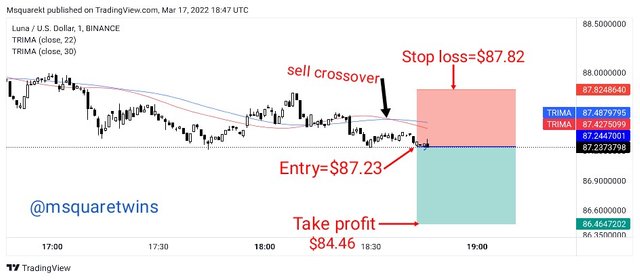
The chart uploaded below is a chart of LUNA/USDT on a 1 minute timeframe. As we can see from the screenshot, this asset has been on a downtrend for some time, then it made a reversal to the upside and after this a crossed of the TRIMAs line occurred and I took a sell order with ;
- Entry = $87.23
- Stop loss = $87.82
- Take profit = $84.46
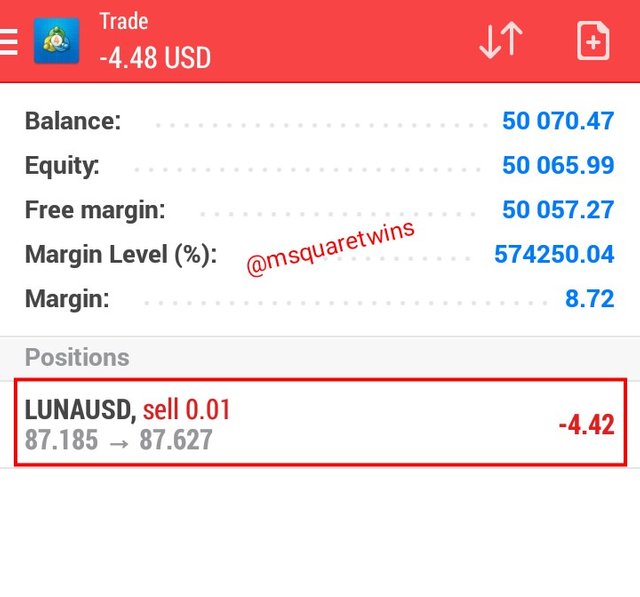
Then the demo order was taken on MT4 Trading platform. The picture uploaded below is the running order of LUNA/USD which was taken immediately after the order was executed.
REAL Trade
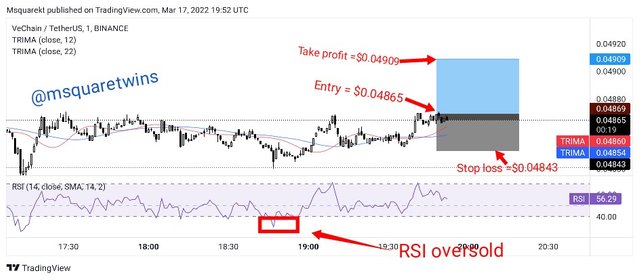
The chart below is a chart of VET/USDT on a 1 minute timeframe. As we can see from the screenshot below, the assets has been on a downtrend for a while, then at a point, the RSI indicator entered oversold region as indicated in the screenshot. Then shortly after this, a cross of the TRIMA indicators occurred. Then I opened a buy order after a break of the minor low created by price.
- Entry = $0.04865
- Stop loss = $0.04843
- Take profit = $0.04909
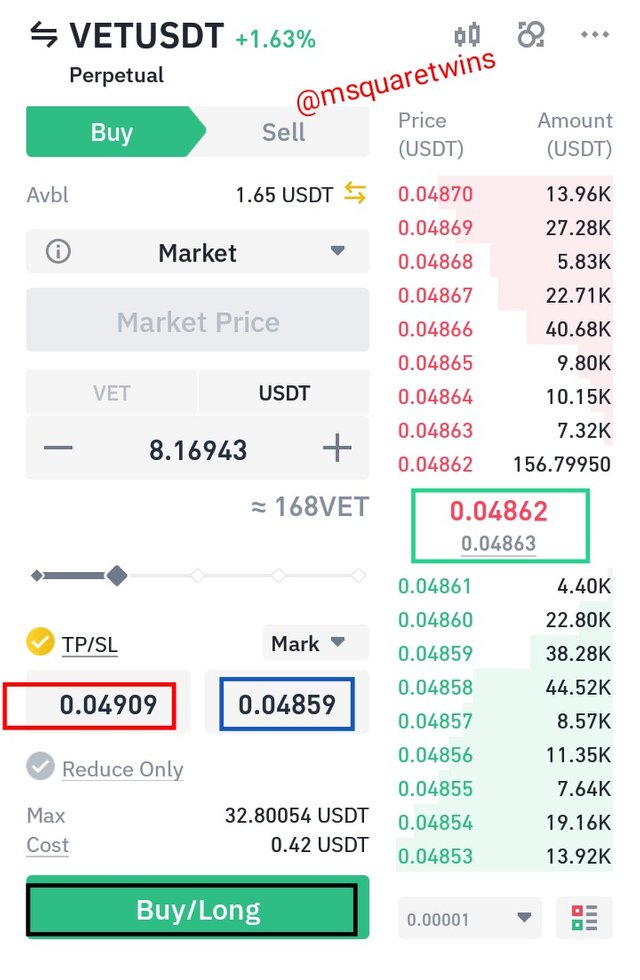
The real order was taken on Binance future trading as seen in the screenshot below. The stop loss and take profit were properly set and the order was taken at current market price as indicated in the screenshot.
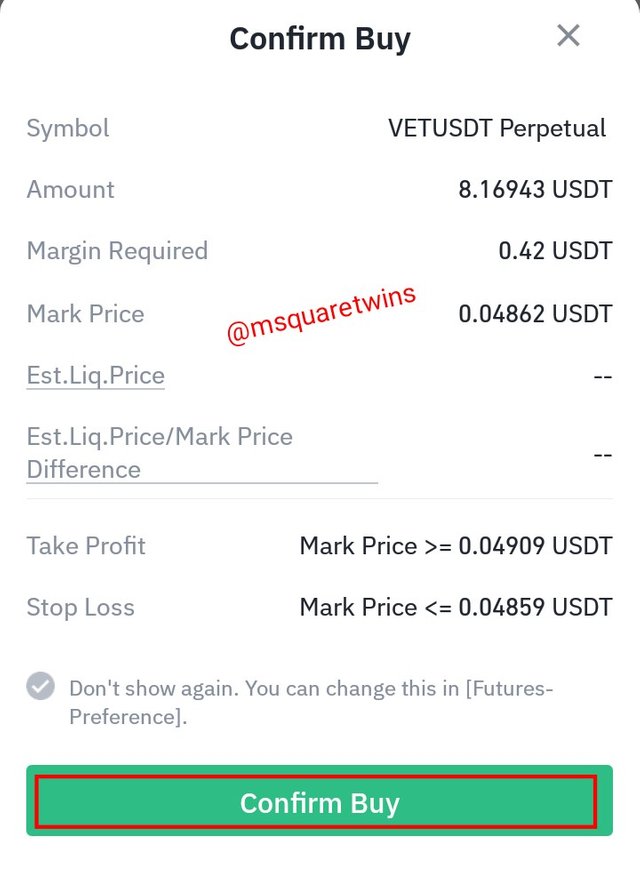
Then I confirmed the buy order by clicking the "confirm button" as seen in the screenshot below.
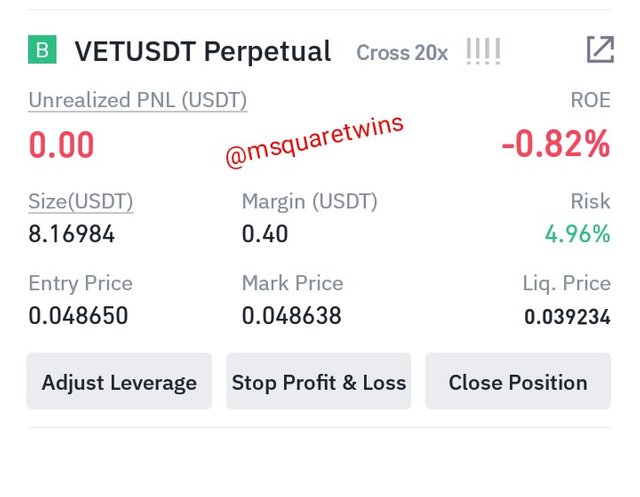
The picture below shows the running order of VET/USDT on a Binance platform.

8. What are the advantages and disadvantages of TRIMA Indicator?

There is no indicator that is 100% efficient, as many indicators have their advantages, they also have draw back. TRIMA indicator likewise has it own advantages and disadvantages. Some of the advantages and drawback of TRIMA indicator are listed below.
Advantages of TRIMA Indicator
a. TRIMA indicator is used to determine the trend of an asset at a particular period of time.
b. The cross over of TRIMA indicator is a good indication for buy and sell entry.
c. Triangular moving average indicator does not react to high volatility caused by impact news and unnecessary price reaction to fundamental news.
d. The trend presented by this indicator is very clean and cleat
Disadvantages of TRIMA Indicator
a. TRIMA indicator lags behind the price and as such, traders may not catch the move from the beginning.
b It can not be used as stand alone indicator
Conclusion
In this post, I have explained TRIMA indicator in my own word and I have also set up this indicator on trading view with necessary screenshots. I also explained how this indicator can be calculated. More so, I explained the uptrend and downtrend confirmation with the use of TRIMA indicator.
Additionally, I identified buy and sell signal with the use of crossover of TRIMA indicator, and also combine the TRIMA indicator with RSI indicatir. And finally, I took a demo and a real order on MT4 platform and Binance platform respectively.
Thanks to Prof. @fredquantum for this lecture.
Cc: @fredquantum