
Introduction

Hello crypto Lovers,
The first week of the steemit crypto academy has been going and I hope you are enjoying different lectures from crypto professors. I am Kehinde Micheal and my username is @msquaretwins here on this platform. In this post, I will be answering the questions posted in the homework task by Professor @reddileep who has presented a topic on Leverage With Derivatives Trading Using 5 Min Chart.

1. Introduce Leverage Trading in your own words.

Leverage trading is a strategy that is used in trading. The word leverage is used in many fields. It is the use of small effort to accomplish greater task. The same is true in trading. Leverage trading is a method used by traders to get access to more position than their deposited funds. This allow traders to control large amount of capital with small amount of capital deposited.
Leverage trading can be very profitable and at the same time, it can be very risky too. This is because, it is possible to make profit entering a position either to the upside or to the downside and it is also possible to lose a trade.
To clearly understand the concepts of leverage trading, if a trader has a $500, and deposit it into a broker account with 100:1 leverage. This means he can trade more than 50 times of what he deposited in his account. What a power of leverage trading. But it should be noted that as profitable leverage can be, it can also lead to a lose of money, especially of the leverage is too high and the trader using it is a beginner who don't really know much about trading.
Care should be taken when trading with leverage, because as much as it is possible to make profit, loss is also real. So traders should be careful so that liquidation does not happen to their deposited capitals. So this is where correct analysis and understanding of market direction and behaviour comes into play. Traders should know market behaviour before entering trade order.

2. What are the benefits of Leverage Trading?

In this question, I will be discussing the benefit of leverage trading. Here, I will be listing the benefits below.
• Leverage trading helps traders to take trader order that are more than their capital deposited in their wallet. It allows them to control large amount of capital with small amount of capital deposited.
• Leverage trading is also beneficial in the sense that traders are allowed to take partial of their profit without closing the entire trader order which in turns help traders to manage their trade orders.
• Leverage trading gives traders the opportunity to take larger positions than they should not have taken if there were no leverage involved.
• Leverage trading multiplies the profit made in trading. It also allows traders to use their money for some other things that can earn them reward.
• In case the market does not move as predicted, there is an opportunity to do what is know as cross marging by adding some fund to it without subjecting the capital into liquidation.
• Leverage trading can be used for scalping order where by traders enter a sure trade order within a short time and exit it to make profit.

3. What are the disadvantages of Leverage Trading?

Like I said earlier, leverage trading has it own drawback. In this question, I will be listing some disadvantages of leverage trading.
• There is risk involved in leverage trading compare to other types of crypto trading.
• As profit made using leverage trading could be multiplied so also losses could be multiplied.
• Trader could be called upon to deposit more funds if the market isn't going according to prediction so as to cover losses.
• If the market goes not as according to plan, it may lead to a liquidation, a situation where the losses equal to initial capital.
• Leverage trading is attached a fee especially if the order is hold overnight. This is unlike some other types of crypto trading, like spot trading.

4. What are the Basic Indicators that we can use for Leverage Trading? (Need brief details for any essential Indicators and their purposes)

In this question, I will be explaining some effective indicators which can be use for leverage trading. The indicators I will be explaining are:
• Stochastic oscillator
• Moving averages Indicator
• Parabolic Sar.
Stochastic Oscillator
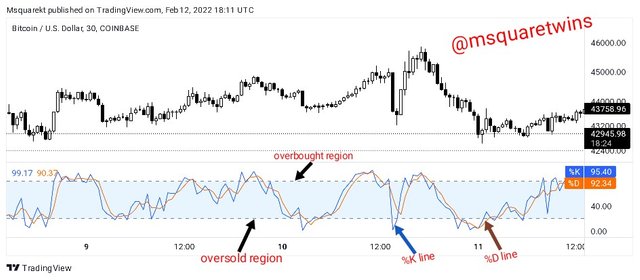
Stochastic oscillator is a technical oscillator that is used to determine the momentum and the direction of an asset. This indicator measures the overbought and oversold region of an asset. The oversold region starts from 20 downward while the overbought region start from 80 upward. It consists of two lines called %K line and %D line.
When price enter the the oversold region, this means that the two lines of stochastic enters below 20, traders often close their sell position and look for opportunity to buy. When price enters the overbought region, sell opportunity is always envisaged.
The picture uploaded below is a chart of BTCUSD with a stochastic oscillator added to it as seen in the chart.
Moving average Indicator
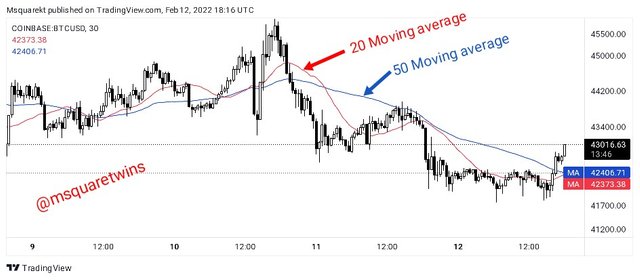
Moving average indicator is one of the popular indicator that is used mostly by traders. It is a technical indicator that is used to determine the price direction of an asset. It is also use to determine the support and resistance of an asset.
The indicator is a line that moves as price moves. It is always on the main chart. When the line is below the candles, it means an uptrend and when the moving average line is above the candle, it means a bearish trend.
Traders often add two moving averages on chart for effectiveness. In a chart uploaded below, moving average indicators are added to the chart.
Parabolic Sar
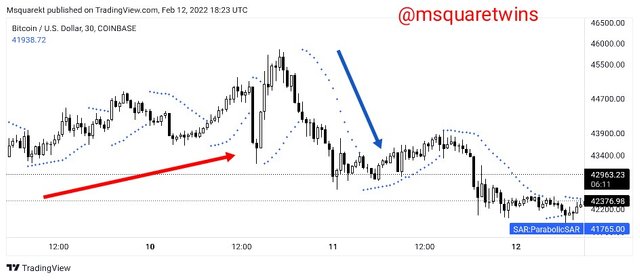
Parabolic sar is another wonderful indicator that traders employed on chart to make good market decision. It is used to predict the direction of an asset, security of commodity. It is a series of dots or point on the chart. When the dots appear above the the candles, it shows that the asset is falling and sell order is always taken. But when the dots appear below the candles or bar, it means the asset is in a bullish trend.
In a chart uploaded below, Parabolic sar is added to it and we can see a series of dot that keeps moving along with price of an asset.

5. How to perform Leverage Trading using special trading strategies (Trading Practice using relevant indicators and strategies, Screenshots required)

For this task, I will be using a strategy. I will be combining the two indicators together. I will combine stochastic and moving averages together. The moving averages I will be using is 20 period moving average and 50 period moving average.
The moving averages in the strategy is to confirm the trend. Trend is very important in trading and a good trader should quickly identify the trend which the price of an asset is. When the price of an asset is above the moving average 20 and 50, the trend is an uptrend. And when the price of an asset is below the moving average 20 and 50, the trend is downtrend.
The crossing of the 20 MA and 50 MA signifies a change in trend. When an uptrend is about to turn to bearish market, the two MAs will cross each other, that will signify that the sellers want to take over of the price. And when the price reaches the extreme bottom of the trend, a reversal in that trend may occur when the two MAs cross. That will signify that the buyers are taking over the market.
Stochastic oscillator is an indicator which shows when the market is overbought and oversold. It contains two lines, %k line and %d line. These lines oscillates to and fro the Indicator window. It has a scale of 0 to 100. The scale of 80 and 100 is known as overbought region, the scale of 20 and 0 is called oversold region while between 20 and 80 is neutral.
When the price crosses above 80, it's a signal that the price is overbought and that buyers may be overpowered soon. When the %k and %d line cross, it's referred to as sell signal. Also, when the price crosses below 20, it's a signal that the price is oversold and that the sellers may be overpowered by the buyers.
Now, combining both indicator together will help filter the false signals and give some percentage of accuracy.
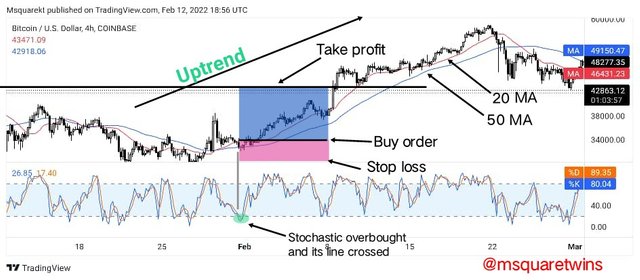
Now, to use the strategy, we first identify the trend which the asset is. Market structure is used to identify the trend and the moving average. When price makes higher highs and higher lows, that means the trend is bullish. Further, when price is above the two moving averages, the trend is bullish. Now, after identifying the trend, we look at the opportunity to enter a long. When the stochastic is oversold and the %k and d line cross, then a buy order is executed. Stop loss should be placed below the current low, and take profit should be placed at the nearest resistance level. See the screenshot below.
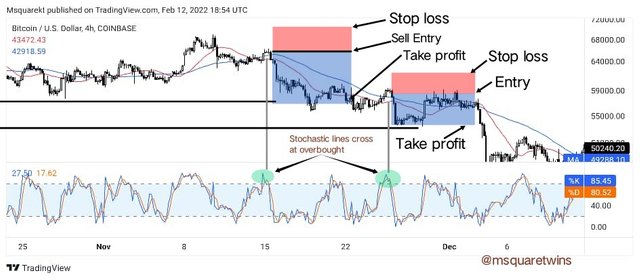
To place a sell order with strategy, we look for an asset which is in a downtrend. Market structure must show that the market is in a downtrend. A series of lower lows and lower highs will signifies that the market is in a downtrend. Further, the price must be below the two MAs (20MA and 50MA). Once this is confirmed, we look at the Stochastic oscillator to place a sell order. When the %k and d cross at the overbought, then a sell order should be executed. Stop loss should be placed above the current high and take profit should be placed at the nearest support level.

6. Do a better Technical Analysis considering the above-explained trading strategy and make a real buy long or sell short position at a suitable entry point in any desired exchange platform. Then close that buy or sell position after appearing trend reversal signal from the Parabolic SAR indicator. Here you can also close your Buy or Sell position using any other desired Trading Method in addition to the signal coming from the Parabolic SAR indicator. However, here you must prove that trading method as a reason for closing your position. (Usually, You should demonstrate all the relevant details including entry point, exit point, resistance lines, support lines or any other trading pattern. Use at least 2X leverage and no more than 10X )

For this question, I will be performing a real sell order of TRX/USDT.
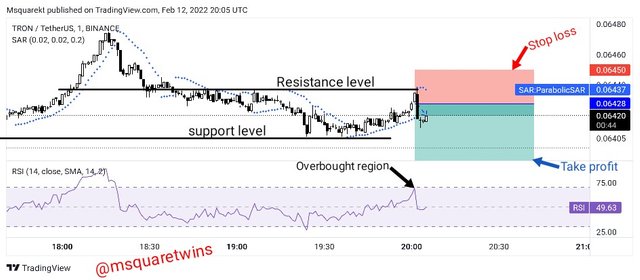
The TRX/USDT chart is uploaded below. As seen in the screenshot uploaded below, the RSI entered the overbought region and the Parabola Sar appear above the candle. The a sell order was place with a stop loss above the resistance level and a take profit order was set below the support level
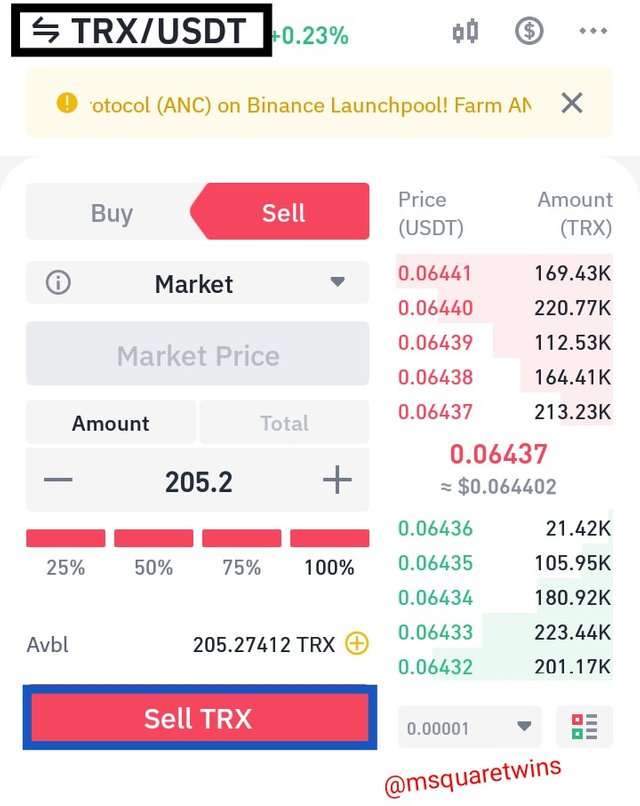
Then I placed the real sell order or binance App as seen in the screenshot below.
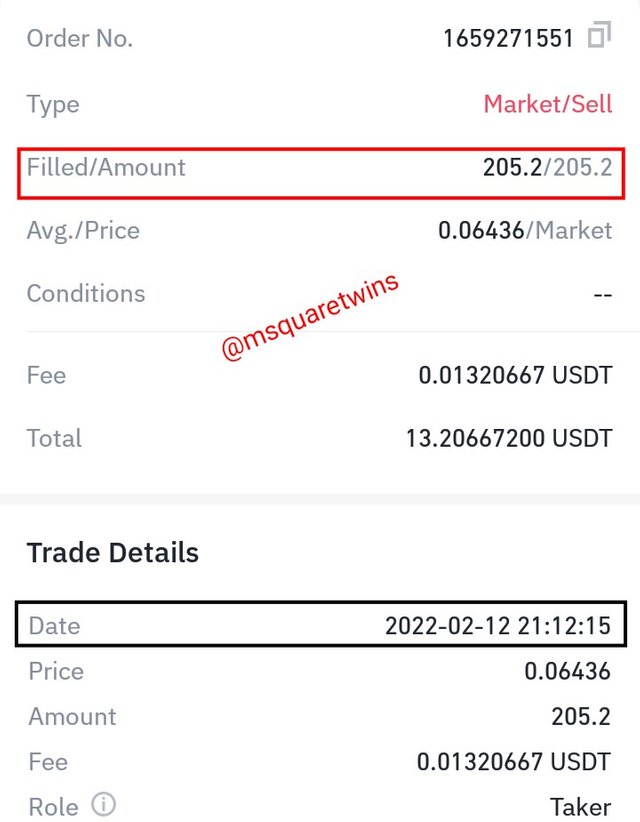
Then the history of the sell order is uploaded below as seen in the screenshot below.

Conclusion

Leverage trading is type of the trading that is very profitable. As it can be profitable, it can also be very risky too. This is because, it is possible to make profit entering a position either a buy position or bearish position and it is also possible to lose a trade. Therefore, traders must know the market direction and market behaviour before entering a trade order.
In this task, I have explained the leverage trading and some indicators that can be used for leverage trading. I have also explained the advantages and and disadvantages of leverage trading in this task. Lastly, I took a real sell order.
Special thanks to Professor @reddileep for this great lectures.