
Introduction
Hello Crypto Lovers!
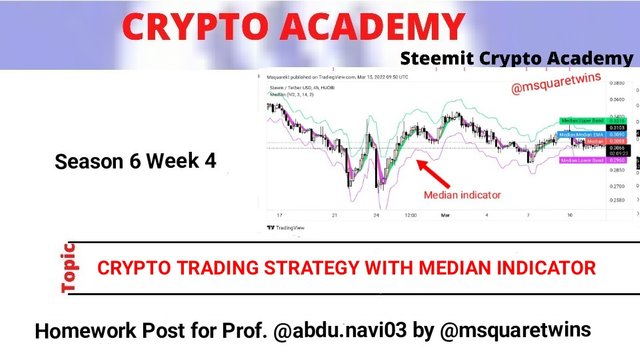
It is another wonderful time again at the Crypto Academy community. This week marks the 4th week of season 6 in the crypto academy community, and I hope you have been enjoying your time. I am Kehinde Micheal and my username is @msquaretwins here on this platform. Thanks to @abdu.navi03 who presented a lecture on "CRYPTO TRADING STRATEGY WITH MEDIAN INDICATOR". Therefore, I will be answering the questions based on my understanding of the topic. Happy reading!
1. Explain your understanding with the median indicator.
Indicators are technical tools that are used for technical analysis. They help to determine the trend direction, the strength and the momentum of an asset. Some indicators are best used for trend determination while some measures the momentum and strength of an asset.
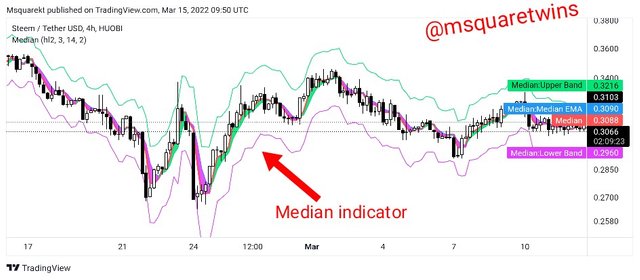
Median indicator is a powerful indicator that is used to determine the trend of an asset. That is, it is used to identify the price direction over a particular period. It also measure the volatility in market at a particular period of time. It shows the mean value between the high and the low point price make over a particular period of time. The indicator consist of a thick line which is added to the main chart and the line shows a green color when an asset is in uptrend and shows a purple color when the market is in downtrend.
The indicator has a lower and upper band. By default, the upper band is a green line and the lower band a purple line. The thick green line appear when price passes through the EMA line from bottom to up and the purple line appear when price passes through the EMA line from above to down.
2. Parameters and Calculations of Median indicator. (Screenshot required)
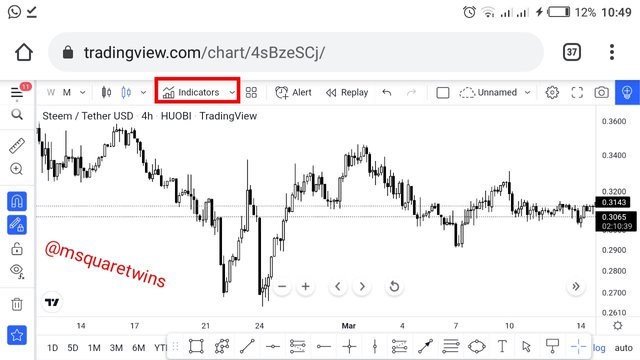
Firstly, I will explain how to add this indicator on chart on trading view platform.
To add this indicator on trading view chart, click indicator" from the top of the trading view as indicated by a red box in the screenshot below.
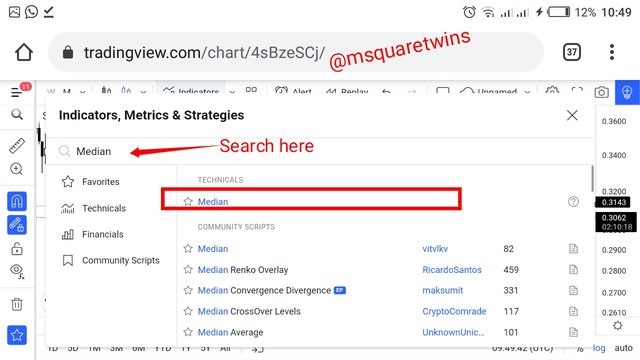
Then, an indicator search bar will appear for you. From the search bar, type "median" and search. Then it will bring result for you as seen in the screenshot. Click on "media" as indicated by a red box in the screenshot below.
Then we have the indicator added to the chart as seen in the screenshot below. From the screenshot we can see that median Indicator has different parameters and each parameter has it own use.
Some of the parameters are;
- Upper band
- Lower band
- Median EMA line
- Median
- ATR multiplier
- Median length
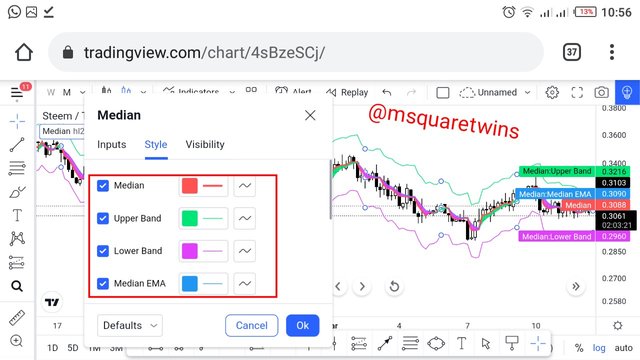
By default, the upper band is called median upper band, and it is a green thin line that is at the upper part of the price which acts as resistance level. The lower band on the other hand is called the median lower band, and it is a purple thin line that acts as support. The median and median EMA are the middle line that are bounded together to form a thick line as seen in the screenshot.
Median length by default is 3 as seen in the screenshot below. This is the data that is put to use for the calculation of media length. The ATR multiplier helps in the calculation of upper and lower band and the default value is 2.
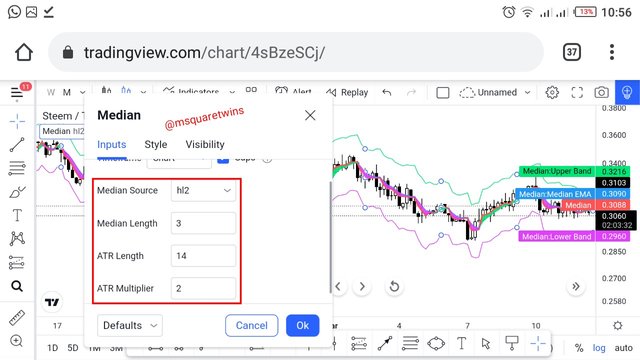
Mathematical calculation
Median = (Ph - Pl)/2
Where Ph is Highest price, and Pl is the lowest price.
Upper Median band = Median + 2 ATR
Lower Median band = Median - 2 ATR
EMA value = (CP x Multiplier) + [Previous EMA x (1 - Multiplier)]
CP is closing price.
EMA is Exponential Moving Average
Median Indicator,
M I = ATR %change ( Median, EMA Value)
3. Uptrend from Median indicator (screenshot required)
A trend is said to be in uptrend or bullish when price is continuously making a series of higher high and higher lows. There are so many ways traders can detect uptrend in market. Market structure, technical indicator, trendline etc can be used to detect whether an asset is in uptrend or downtrend.
Interestingly, median indicator can be used to determine uptrend and downtrend. A trend is said to be in an uptrend when median line is above the EMA line. And when this happens, the middle line will turn to green and this signifies an uptrend in market. An example of a bullish trend is uploaded above.
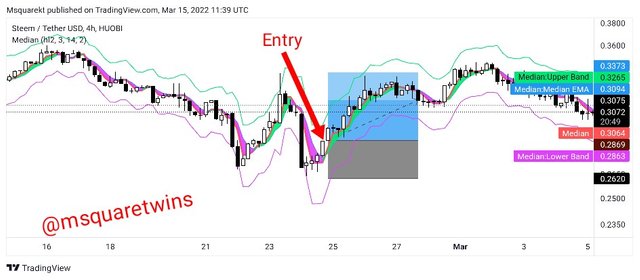
From the picture uploaded above, we can see how the thick middle line turns o green when media line is seen above the EMA line and price moved to the upside direction. Traders can open a buy position at this point and place a stop loss below the last low made by price. The take profit order can be placed at the resistance level.
4. Downtrend from Median Indicator (screenshot required)
The opposite of what is described above happen to a downtrend. For an asset to be in a downtrend, the median line must be below the EMA line and at this point, the thick middle line will turn to purple line and this indicate that the assets is starting a bearish move.
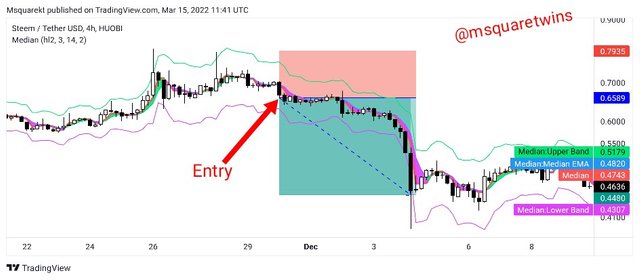
As we can see from the screenshot above, the thick green line which signifies a bullish trend turns to purple line as soon as the EMA line appear above the median line. And we see now the asset traded lower after the appearance of purple line. Traders can place a sell position here and place the stop loss just above the recent resistance level, and take profit order can be set to nearest support level.
5. Identifying fake Signals with Median indicator(screenshot required)
Indicators are powerful bit they are beat use when they are combine together. This will help to identify false signal that may arise when just an indicator is used alone. Mediam indicator os an indication that is used to identify trend in market. Therefore, some indicator that are not trend-based cam be used together with median indicator for effectiveness and to identify fake signal in market.
In the screenshot uploaded below, I have added both the median indicator and RSI indicator for the purpose of identify false signal in market.
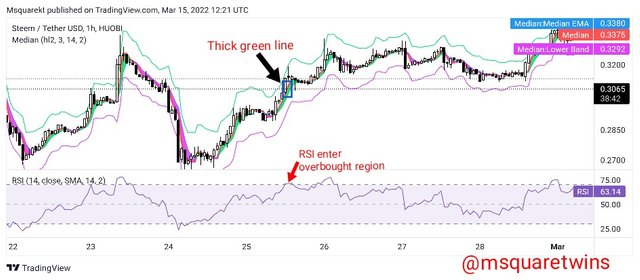
From the screenshot above, we can see that RSI indicator entered the overbought region which signifies a sell order and that price is about to turn to a bearish direction. But what did median indicator tell us? Median indicator didn't inform us about this sell signal since the thick line is still green at this point. Hence, this is a false signal to sell this asset at this time.
For a an entry to be valid, the two indicator must give the same signal at the same time. That is, for a buy signal, RSI must be oversold and the median indicator must show a green thick line at the same time. Also, for a sell signal, the RSI indicator must be seen at the overbought region and the median line must show a purple line which also confirm a bearish trend.
6. Open two demo trades, long and short, with the help of a median indicator or combination that includes a median indicator (screenshot required)
Buy Order
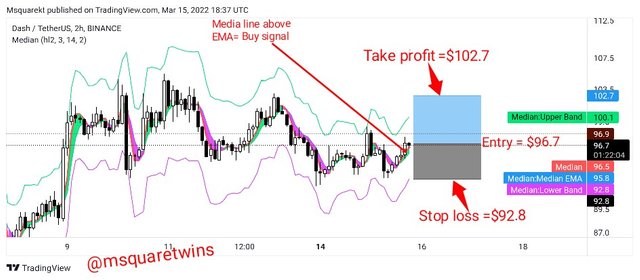
The screenshot uploaded below is a chart of DASH/USDT on a 2hour time frame. As seen in the screenshot, this asset has been on a bearish trend as the price was making a series of lower highs and lower lows. Also we see that the thick line of the median indicator was showing a purple line and this means the trend is bearish.
But at a point, the median line is seen above the EMA line and the thick purple cloud turn to green which signifies a reversal of the current trend. Then immediately after the formation of bullish engulfing candle, I placed a buy order with;
- Entry = $96.7
- Stop loss = $92.8
- Take profit = $102.7
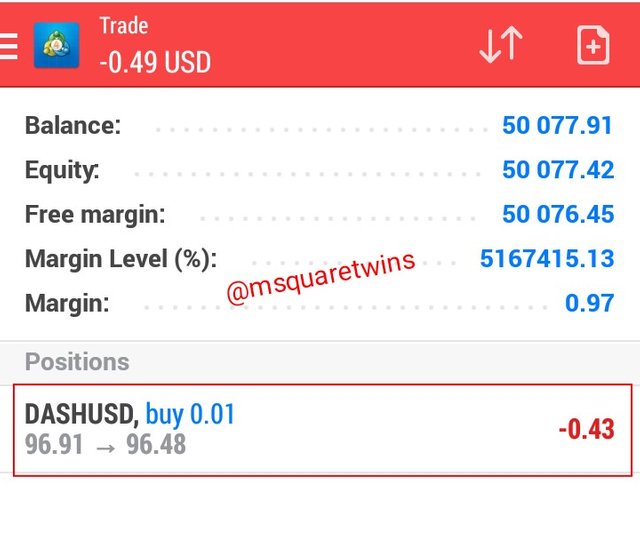
Then the demo trade is taken on MT4 platgorm as seen in a screenshot below.
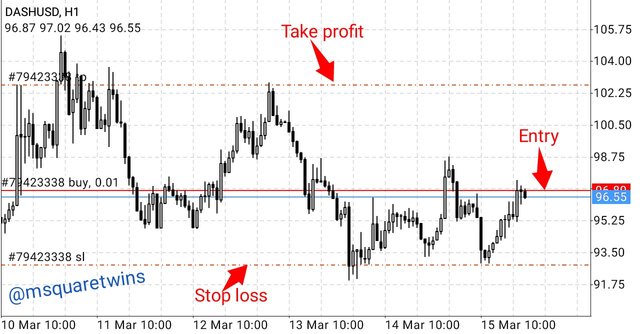
The picture uploaded below shows the running order of DADH/USDT which was taken immediately the orser was executed.
Sell Order
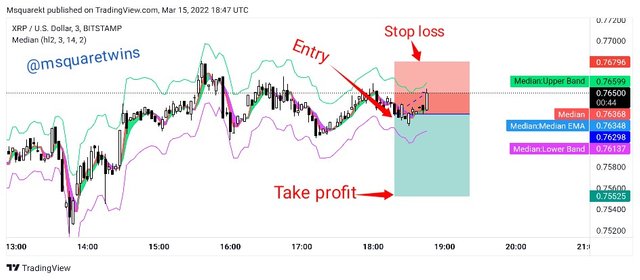
The screenshot uploaded below is a chart of XRP/USD on a 3 minute timeframe. We can see that this asset has been on a downtrend making a series of lower highs and lower lows. Also we see the thick cloud line showing purple and this means that EMA line of the indicator is above the media line which also signifies a bearish trend. Then at a point, the last impulsive leg made a retracemen, and the green cloud appear for some time. Then after this retracement, the purple cloud appear again which means the asset is about to continue with its bearish trend.
With this, I placed a sell order after the formation of bearish engulfing candle with;
- Entry = $0.76298
- Stop loss =$0.76796
- Take profit =$0.75525
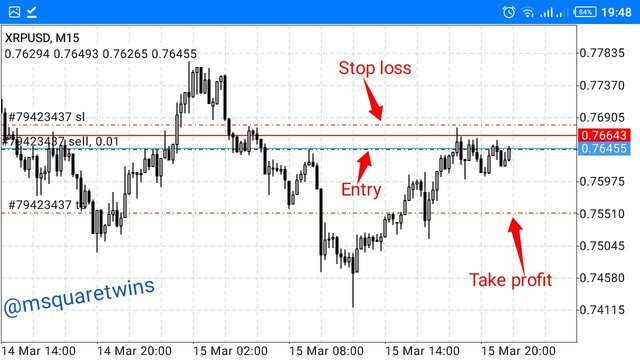
The demo trade for XRP/USD is taken on MT4 platform as seen in the screenshot uploaded below.
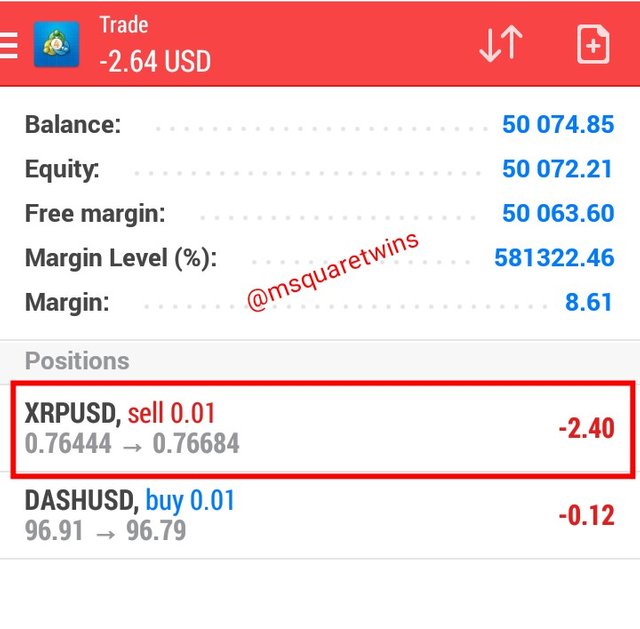
The picture uploaded below is the screenshot of the running order of XRP/USD which was taken immediately the order was placed.
Conclusion
Median indicator is used to determine the trend of an asset. That is, it is used to identify the price direction over a particular period. It also used to determine the volatility of an asset in market at a particular period of time. As powerful as median indicator is, it is advisable not to use it as stand alone indicator. Indicators are best used when combined them together.
In this post, I have explained my understanding of the median indicator, the parameters and it calculation were also discussed at length. I also explained with screenshot both the bullish and bearish identification of median indicator. And finally, I took both buy and sell order with the median indicator strategy.
Special thanks to Professor @abdu.navi03 for this great lecture.