

Introduction

Hello crypto Lovers!
It is a new week at the academy, and I hope you enjoyed the past weeks. This weeks marks the 4th week of season 6 in the crypto academy community. I am Kehinde Micheal, and my username is @msquaretwins on this great platform. In this post, I will be answering the series of questions posted on the homework section by Prof. @reminiscence01 who presented a lecture on "Psychology of Trends Cycle." Therefore, I will answer all yhe question based on my understanding of the topic. Happy reading!

1. Explain your Understanding of the Dow Jones Theory. Do you think Dow Jones Theory is Important in technical analysis?

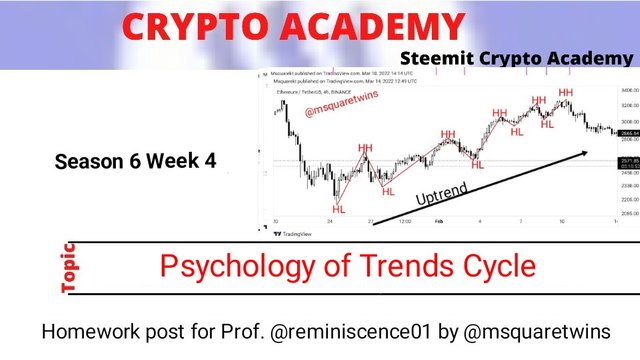
Dow Jones theory is a theory that is popularly known and used in finance market. It is an innovative idea of a man called Charles Dow, which was developed in 1897. Dow Jones theory of trend says that market may either be in a bullish trend or a bearish trend. According to Dow theory, an asset is bullish (uptrend) when it consistently making a series of higher highs and higher lows, and an asset is bearish when it is making a series of lower highs and lower lows.
This theory is believed to form the fundamental of technical analysis. This is because technical analysis is done to determine the trend direction, strength and price movement of an asset. Dow is of the opinion that anything that happen in market ranging from supply and demand, fundamental news etc can be shown by price of an asset in market. Hence, analysis of price of an asset will help to determine the state of the market and price direction.
This theory also says there three main types of trends; the primary trend, secondary trend and the minor trend. According to the theory, the primary trend is a trend that last for months and years. Secondary trend go from some weeks to few month and minor trend is just for some days. Traders can find opportunity in market to join these trends after a detailed technical analysis.
With all said, I believe the Dow Joe theory is important because it formed the fundamental part of technical analysis. If there is no this theory, it may be hard to predict the direction of a tend or perhaps may not be feasible to predict trend direction at all. Another important reason why this theory is so significance is because it helps traders to know the basis of supply and demand in market which in turns helps them in their technical analysis. More so, traders get to understand price movement and volume of an asset in market with the help of Dow Jones theory. Therefore, the importance of this theory can never be overemphasized.

2. In your own words, explain the psychology behind the Accumulation and Distribution phases of the market. (Screenshots required).

In trading the price of an asset operate in a cycle and this cycle may either be in a bullish trend that is upward trend or bearish trend (Downtrend). When price is an uptrend, it keeps making a series of higher highs and higher lows. This means that price keep pushing high. Although, uptrend is not without a moment of pullback, it is just that the pullback or retracement never break the true lows before a new high is made in market.
This keeps on happening till an uptrend reach an area where the asset is overpriced. And at that point, buyers will start closing their buy position and the buying pressure will drastically reduce and at this point, sellers start taking charge of market. This cycle keep on repeating it self in market and of course, it also form the fundamental upon which accumulation and distribution occur in market. Therefore, I will briefly talk about accumulation and distribution in market.
Accumulation phase
Accumulation phase is a phase in market that occur at the lowest part of a downtrend. This means, an asset must have been in a downtrend prior to the formation of this phase. During a downtrend that precede the formation of this phase, more selling pressure will be directed toward the downside and there will be high volume in the direction of the trend till the price is underpriced. When price is underpriced, sellers will begin to close their position and ultimately, the selling pressure will reduce.
At this point, there will be a tug of war between the sellers and buyers in market. The tug of war between both party at the end of a bearish trend create what is known as accumulation phase. This phase is as a result of buyers dragging price up to a point and then seller taking it back downward before buyers take it again and also drag it up to the same point or zone where sellers previously took it. This goes on for sometime before the buyers overpower the sellers and the drag price higher and the trend change from bearish to a bullish trend.
The accumulation phase is initiated by strong hands in market which are often referred to as professionals, institutions or big players in market. At the end of a bearish trend, they will close their sell position, and because of their big sell position, price experience a slow movement and keeps ranging at this point to form accumulation phase. Their aim of creating this phase is to trap and haunt the retail traders in market.
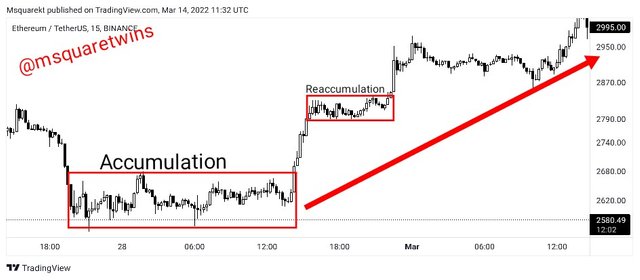
In the screenshot uploaded above, we can see how an accumulation formed and after some time of market competition between buyers and sellers, price broken the accumulation zone and because of the high buying pressure, the trend goes up. But as we can see, at a point, the big investors who opened a buy position at the beginning of a trend take some profit out of market and market slow down a bit before it continue in an upward direction. This is called a reaccumulation phase and this help some buyers who did not start at the beginning of the bullish trend to join a bullish trend and continue riding the trend.
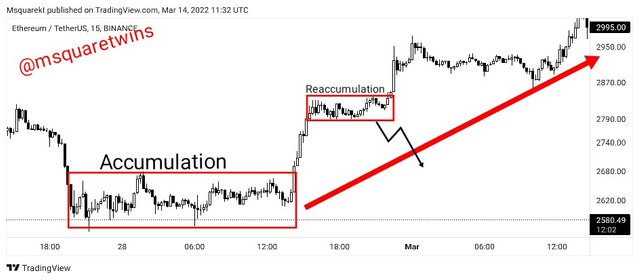
However, the bullish trend will become invalid if the price break below the reaccumulation phase as indicated in the screenshot.
Distribution Phase
Distribution phase is the opposite of accumulation face that happened in the downtrend. While the accumulation phase occur at the end of a bearish trend, distribution phase occur at the end of a bullish trend.
The distribution phase is also the initiation of by strong hands, professionals, institutions or big players in market. At the end of a bullish trend, these strong hands who bought an asset from the bottom of a bearish trend will start closing their buy position, and because of their big position, price experience a slow movement and retail traders also close their position at a loss and this cause a sideway market, which is called distribution phase. Their aim of creating this phase is to also trap and haunt the retail traders in market.
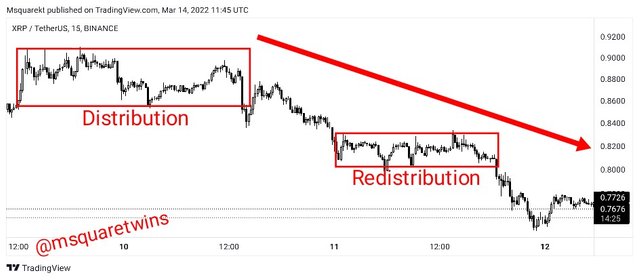
In the screenshot uploaded above, we can see a distribution phase as indicated. Then, after some time of market competition between buyers and sellers, price broke the distribution zone and because of the high selling pressure, the trend down. But as we can see, at a point, the big investors who opened a sell order from the start of a trend take some profit out of market and price slow down a bit before it continue a downward trend. This is called a redistribution phase and this allows sellers who did not start at the beginning of the trend to join this trend and continue riding the trend.
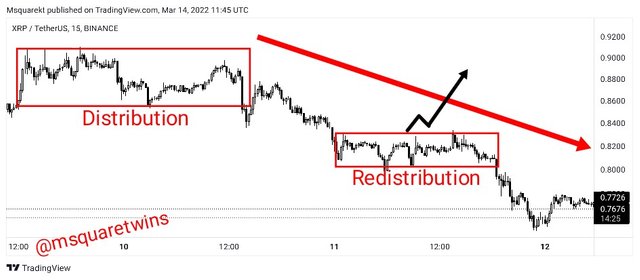
However, a break above the redistribution zone will make the downward trend nulled as indicated in the screenshot above.

3. Explain the 3 phases of the market and how they can be identified on the chart.

In finance market, there are three types of phases which can be identified through the formation of price and market structure. The three types of phases are:
- Bullish Trend
- Bearish Trend
- Sideway Trend.
Bullish Trend Phase
An asset is said to be in a bullish phase when the price of the asset keep rising over a period of time. That is, when price is making a series of Higher Highs (HHs) and Higher Lows (HLs). For a bullish phase to occur in market, it means that demand is greater than supply at a particular period of time, and as such the buying pressure exceeds the selling pressure.
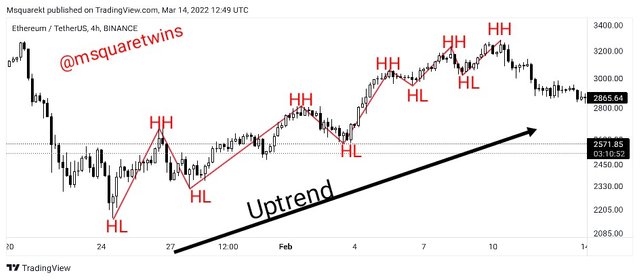
Bearish Trend
Bearish trend is the opposite of a bullish trend. It occurs when price of an asset keep falling over a period of time. A bearish trend is confirmed by market structure making a series of Lower Highs (LH) and Lower Lows (LLs). For this phase to occur, the selling pressure must overpower the buying pressure, meaning that supply at that period is greater than demand in market.
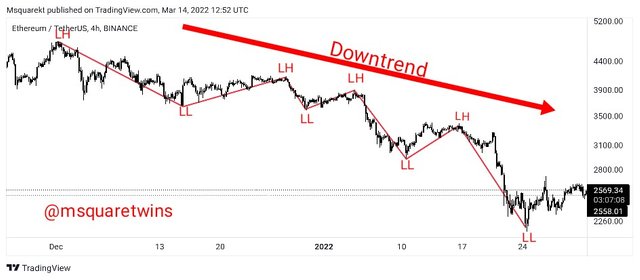
Sideway Market
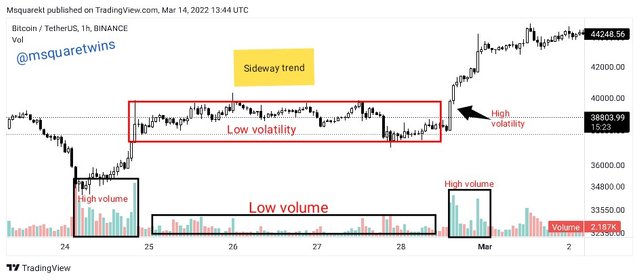
Side way market is another phase in market which is characterized by a low volatility and volume. This phase is often caused by strong hands, or big players in market. It often occur during accumulation or distribution phase. In this case, we will see price bouncing back whenever it touches the support and resistance level until it break either to support or resistance level. This phase may occur at the end of a trend or at the medium of a trend and the side of the breakout will tell traders whether it is a reversal of a trend or continuation.
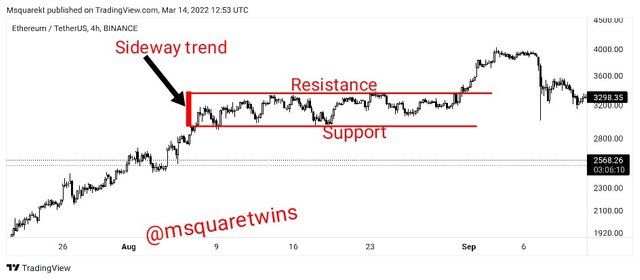
It should be noted that in a trending market, either bullish or bearish trend, there are two types of move, the impulsive move and retracement move. During a bullish trend, impulse move is toward the direction of the dominant trend and the retracement move is the pullback to the opposite side of the dominant trend. The retracement move should not be mistaken for a reversal of the trend. For a reversal of a bullish trend to occur, there should be a break of the last significant low. The case is the same for a bearish trend, for a reversal from a bearish to bullish, the last significant high must be broken upward
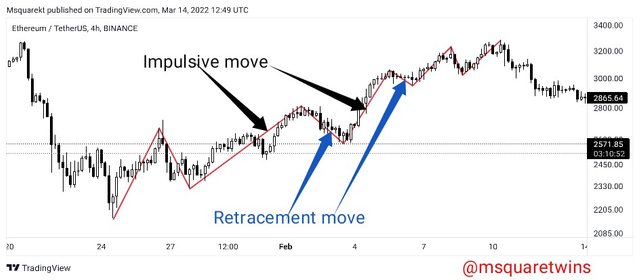
How to Identify Phases in Market
There are so many methods and ways traders used to identify the current phase in market. They use trendlines, market structure and technical indicator to identify the trend. However, out of all these, market structure is the most efficient method of identifying the trend of an asset while some other method like indicator, patterns etc can be used as confirmation and support.

4. Explain the importance of the Volume indicator. How does volume confirm a trend? Do this for the 3 phases of the market (Screenshots required)

Everything that happen in market can be seen in the reaction of price, and this is why it is discounted in price. The forces between buyers and sellers in dragging price in market is always visible on chart. When a market is ranging (Sideway trend), the volatility in market will reduce and this will also be visible in the volume. At this point, the volume will also reduce. The volume, during a sideway trend will be flat and this indicates the current situation in market.
This is visible on the chart uploaded below. As we can see, during a sideway market, price was slow and there wasn't volatility in market, and volume indicator also interpreted it as the volume is seen flatten at this period of time
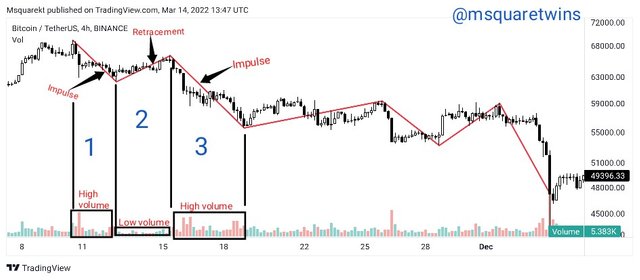
Also during a bearish trend, there will be a high volatility and high volume in the direction of the dominant (main) trend, and low volatility and low volume in the opposite direction of a main trend.
Let's take a look at the picture uploaded below. In the picture, we can see that the asset is on a bearish trend as confirm by market structure. The impulsive move is in the direction of the main trend, and the retracement move opposed the trend direction. The section 1 in the picture is the impulse 1, and we can high volume in section. Now, the section 2 is the retracement move, we can see that this section has a low volume. Hence volume indicator can help us know the direction of a trend because there will be high volume to the direction of the main trend
For bullish trend, high volume will also be seen in the direction of the predominant trend, while there will be low volume in the direction opposite to the main trend. As seen in the picture below, we have a high volume in line to the direction of the main trend and a low volume during retracement.
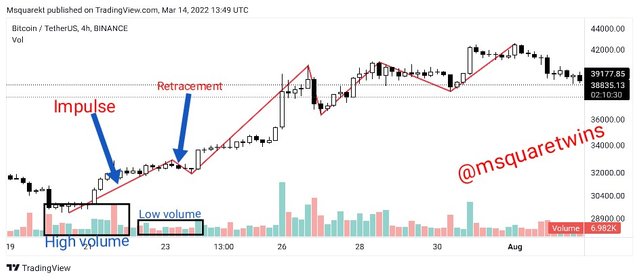

5. Explain the trade criteria for the three phases of the market. (show screenshots)

In this question, I will highlight the trade criteria for bullish trend, bearish trend and sideway trend.
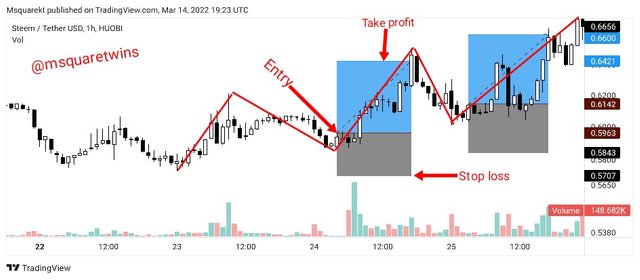
Bullish Trend
The following guidelines should be take into consideration before making an entry for a buy position on a bullish trend.
- Price must be in an uptrend. I.e It must be making a series of higher highs and higher lows. Then there should be increase volume toward the direction of the dominant trend.
- Wait for a retracement to the opposite side of the main trend to occur. This retracement will form a low point. Then after a reversal back to the direction of the dominant trend, execute a buy position after the formation of a bullish pattern like engulfing candle, hammer, morning star etc.
- Place the stop loss loss below the recent low and with 1:1 or 1:2 risk to reward ratio.
Bearish Trend
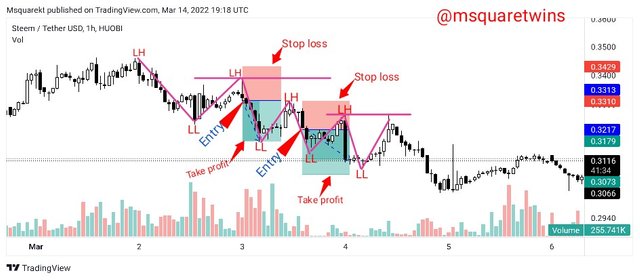
- Price must be in a downtrend. I.e It must be making a series of lower highs and lower lows. Then there should be increase volume toward the direction of the dominant trend.
- Wait for a retracement to the opposite side of the main trend to occur. This retracement will form a high point. Then after a reversal back to the direction of the dominant trend, execute a sell order, after the formation of a bearish pattern like engulfing candle, evening star etc.
- Place the stop loss loss above the recent high and with 1:1 or 1:2 risk to reward ratio.
Sideway Market
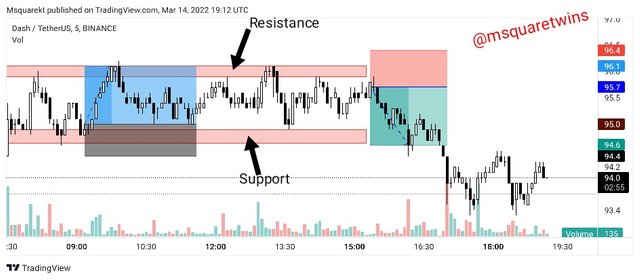
One of the dangerous trend to trade in market is sideway trend. It is dangerous because manipulation of price can occur at anytime. Also, price can break to any side. So if a trader should in any case trade this market, it is recommended that he trades it with a very good risk management.
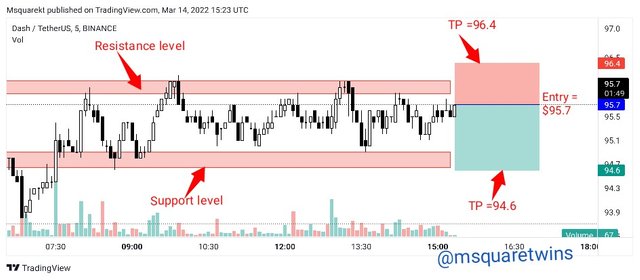
With that said, a trader who want to trade side way market should open a buy order when price reaches the support level with a stop loss below the support level, and a take profit at the resistance level. Then a sell order is initiated when price reaches the resistance level with a stop loss above the resistance level and a take profit at the support level. This is demonstrated in a screenshot below.

6. With the Trade criteria discussed in the previous question, open a demo trade for both Buy/ Sell positions.

Buy Position
The picture uploaded below is a chart of BTC/USD on a 15 minutes time frame. As we can see from the screenshot, the asset is on a bullish trend as confirmed by market structure as price keep creating higher highs and higher lows. Also, we have increased volume toward the direction of a dominant trend, while the asset keep indicating low volume at every retracement of the trend as seen in the screenshot.
Then after a retracement which make a low as seen in the screenshot and a bullish engulfing candlestick formation toward the direction of the main trend, I opened a buy position with;
- Entry = $39109.85
- Stop loss = $38398.27
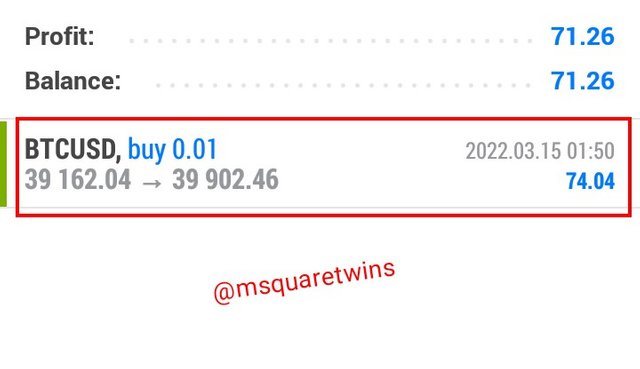
- Take profit = $39902.46
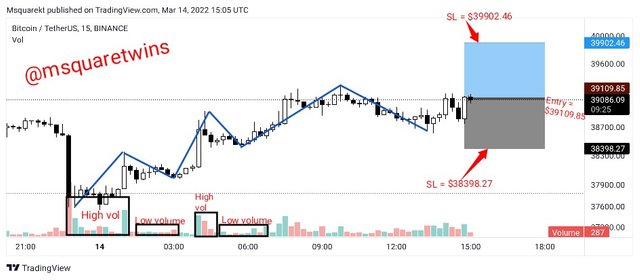
Then I took the demo trade on MT4 platform as shown in the screenshot below.
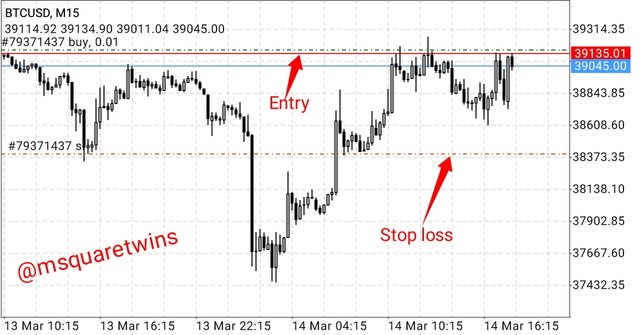
Then the screenshot below shows the running order of BTC/USD order taken immediately after the order was placed.
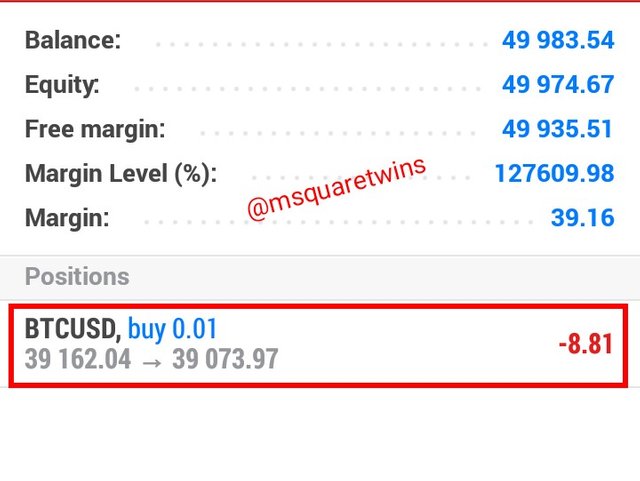
Then after some time I checked the BTC/USDT order andbI saw that ot wrnt according to our prediction. It hit our take profit as seen in the picture below.
Sell Position
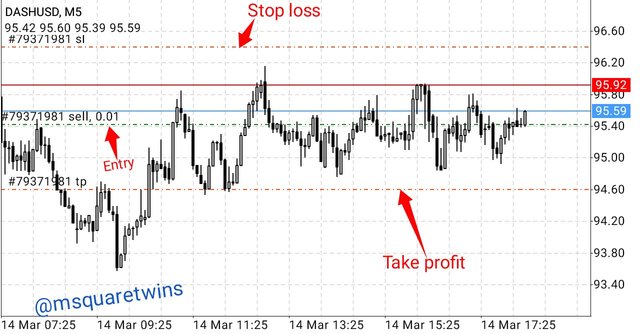
The picture uploaded below is a chart of DASH/USDT on a 5 minutes timeframe. As seen in the screenshot, the market is ranging as price keep bouncing up and down the support and resistance level.
The when price got to a resistance level, I opened a sell order at $95.7 with a stop loss above the resistance level at $96.4 and a take profit targeting the support level at $94.6
Then the demo order was taken on MT4 platform as seen in the screenshot below.
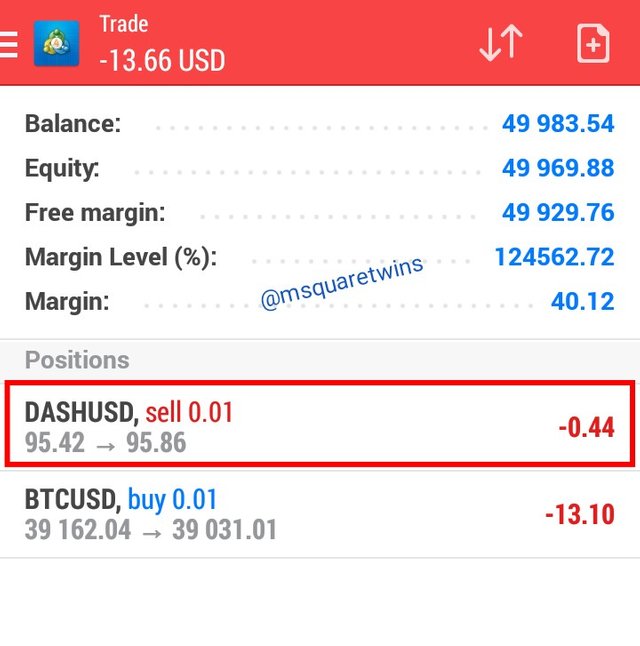
The picture below shows the running order of DASH/USDT which was taken immediately after the order was executed.
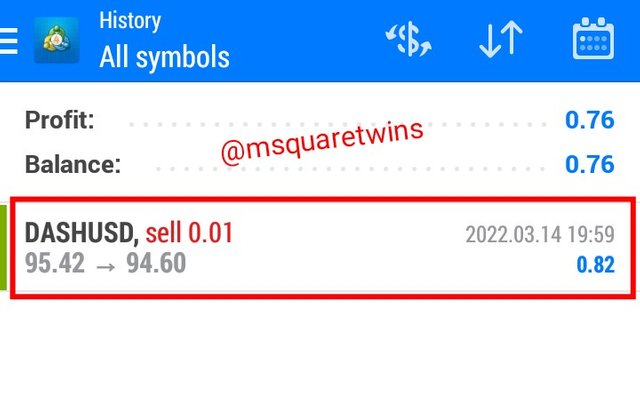
Then after some time I check to see what price is doing. The picture below shows the result of the DASH/USDT sell order. As seen in the screenshot, the trade hit our take profit.

Conclusion

Trend just like the chassis or frame upon which the engine of an automobile sit, is the backbone and basis of technical analysis. The importance of trend in market can never be overemphasized. Therefore, for profitable trading, it is important to know the direction of an asset.
In this post, I have extensively discussed the Dow Jones theory and how it is important in technical analysis. Also, I discussed both accumulation and distribution phase and the psychology behind the formation of each phase with necessary screenshots. More so, I explained three phases in market with screenshots and how they can be identified. Finally, I open a demo other base on the trade criteria given in the lecture note.
Special thanks to Professor @reminiscence01 for this great lecture.