
Introduction
Dear Steemians,
I welcome you all to another great week in steemit crypto academy. This week shall be full of blessings and favour for you all. I am Kehinde Micheal and my username is @msquaretwins. In this post, I will be answering the questions posted in the homework section by professor @allbert who has explained the concept of the topic "Trading with Contractile Diagonals." in the intermediate class. So, let's go together as I explain the question based on my understanding of the topic.

1. Define in your own words what a contractile diagonal is and why it is important to study it. Explain what happens in the market for this chart pattern to occur. (screenshot required / Bitcoin not allowed)
In finance trading, there are many patterns which traders look for to take profitable trade. One of the patterns is contractile diagonal. Contractile diagonal occurs in market in many occasion. This pattern is commonly regarded as wedge. Contractile diagonal is a price pattern that form by two trend lines that tend to converge at a point when price has moved for a certain period of time. It is a pattern that forms as a result of constriction or contraction of candlestick in an upward direction or downward direction which also goes along with wave 1-2-3-4-5
The waves in this pattern is similar to that see in Elliot wave in which waves 1, 3 and 5 are impulses in the direction of the trend and waves 2 and 4 are retracement of this leg.
The two trend lines that later converge often called support and resistance line. This pattern is a reversal pattern. It may form when market is rising or falling. When this pattern form during downtrend, traders often position themselves for a long order and when it forms during uptrend, reversal to the opposite direction is always envisaged.
It is important to study this pattern for profitable trading. It helps traders to predict the beginning of a trend. Not only this, this pattern is also helpful in setting stop loss and target for orders.
This pattern often forms when price has traded for some times either in upward or downward direction such that the power of buyers in upward direction or that of sellers in downward direction has greatly reduced and that the opposite side has come to take over the market.
Let's see an example of a contractile diagonal in a screenshot below
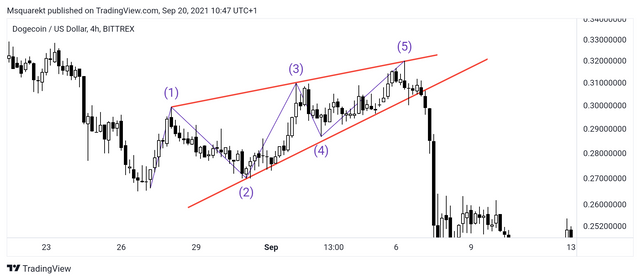
The diagram above is a 4hr chart of DOGEUSD on tradingview. Wave 1, 3 and 5 are impulses and wave 2 and 4 are retracements. As seen in the image, the trend line converges toward the end of the wave 5 and then there was a break of the trend line that joined wave 2 and 4. After this break, price traded lower in the opposite direction. The upper trend line is often regarded as resistance and the lower trend line as support. Notice how the candlesticks stricken or contract as the trend lines come close or converge.

2. Give an example of a Contractile Diagonal that meets the criteria of operability and an example of a Contractile Diagonal that does NOT meet the criteria. (screenshot required / Bitcoin not allowed)
To know a contractile diagonal that meets the criteria of operability, it is important to first highlight the criteria that must be met.
As mentioned earlier, the formation of this pattern usually lead to a reversal in market. But for this to occur, these are some criteria that traders should look out for.
i. Wave 1 must be longer than wave 3
ii. Wave 5 must shorter than wave 3
iii. Wave 2 must be longer than wave 4
iv. The first trend line must touch point 1 and 3 and wave 5 must also agree with this trend line.
v. The second trend line must touch point 2 and point 4.
vi. The two trend lines should converge and cross each other at a point not far away from wave 5.
Example of a Contractile Diagonal that does NOT meet the criteria.
Below is an example of contractile diagonal that does not meet the criteria.

The above chart is a 4hr chart of DOGEUSD.
• As seen from the screenshot above, the trace of diagonal touched point 1, 3 and even point 5 which is a good indicator that this may be valid.
• Also the trace of the second diagonal touched point 2 and point four. This is also good as well.
• wave 2 is longer than wave 4, it meets this rule in this case.
• Wave 3 is longer than wave 1, and this make this example void. Although wave 5 is shorter than wave 3 which is good.
Since one criteria isn't met, therefore, the example is invalid. The example is invalid because wave 3 is greater than 1 which ought not to be.
The screenshot below shows further confirmation that wave 3 is longer than wave 1.
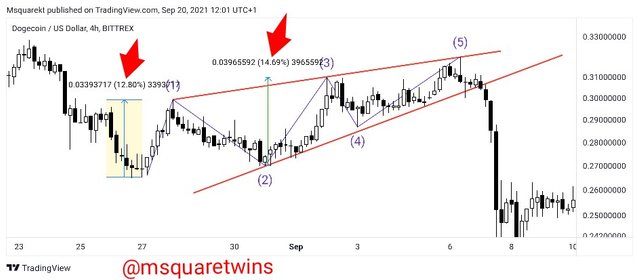
As seen from above, the price range % for wave 1 is 12.8% and wave 3 records 14.69% as indicated by red arrows in the screenshot. This example does not meet criteria since wave 3 is greater than 1.
Example of a Contractile Diagonal that meets the criteria
The example below is a perfect example of contractile diagonal that meets the criteria.
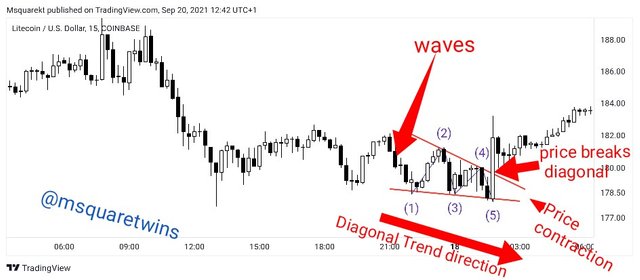
The chart above is the chart of LTCUSD. The market is in a bearish direction. And at some point price is said to be contracting as buyers are seen to be taking over the current trend and price begins to contract. The contractile diagonal is spotted and numbered accordingly as seen in the screenshot above.
The reason why I said the above example met the criteria is that;
• The trace of the first diagonal touched point 1, 3 and 5 as seen in the screenshot.
• The trace of the second diagonal also touched point 2 and 4. The criteria is also met in this aspect.
• Also, we know that for this criteria to be fulfilled, wave 1 must be greater than wave 3 and wave 3 must be longer than wave 5. The example above also met this criteria. Below is the screenshot that attest to this.
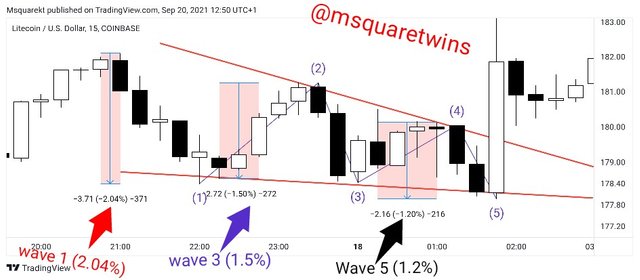
As seen from the above screenshot, wave 1 is 2.04% in the downward direction as indicated by a red arrow in the screenshot, and wave 3 is 1.5% in the same direction as shown by a blue arrow and wave 5 is 1.2%. This shows that wave 1 is greater than wave 3 and wave 3 is greater 5. Criteria met!
• Also we know that for the criteria to be met, wave 2 must be longer than wave 4. The screenshot below also shows that the criteria is met for this requirement as well.
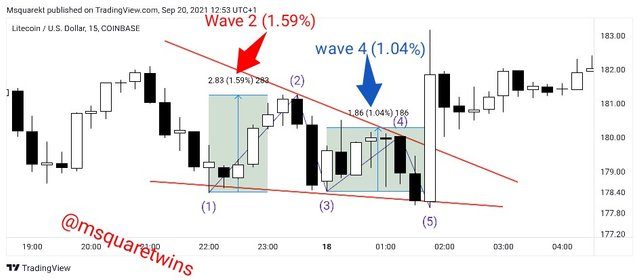
As seen from the above screenshot, wave 2 is 1.59% as indicated by a red arrow and wave 4 is 1.04%. Criteria met.
Since this example met all criteria, this means the example above is valid.

3. Through your Verified exchange account, perform one REAL buy operation (15 USD minimum), through the Contractile Diagonal method. Explain the process and demonstrate the results and graphical analysis through screenshots. Your purchase data must match your analysis data: such as cryptocurrency and entry price.
I am going to use AVAXUSDT for this operation.
Let's see the screenshot below.
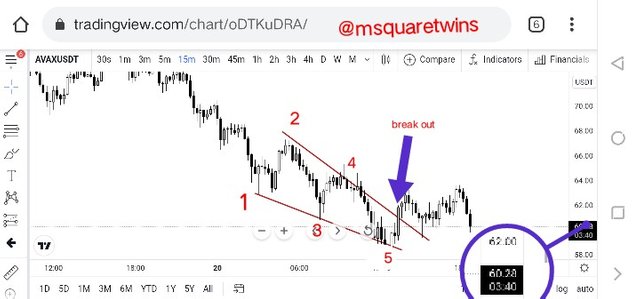
The screenshot above shows the chart of AVAXUSDT on trading view. The market has been bearish for some time. But at some point, the power of sellers have been weaken and buyers are seen to be taking over. The contractile diagonal is spotted as indicated and labelled in the screenshot above. Then price break the diagonal to the upside. I then wait for the retest of that place. At a retest, the price of the Crypto asset on trading view before the trade was placed on binance was $60.28.
Having checked and ascertained that the criteria are met, I then opened my Binance account to place a buy order.
The screenshot below show my verified Binance account.

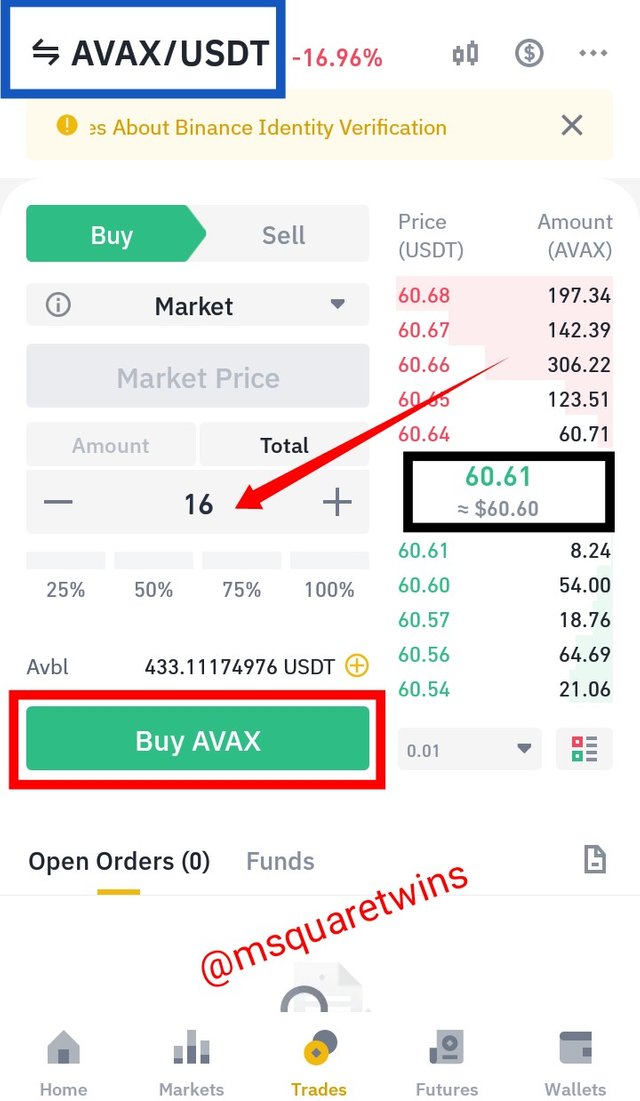
• Then from the home page, I click trade. I selected AVAXUSDT as indicated by a blue box at the top right corner of the first picture below.
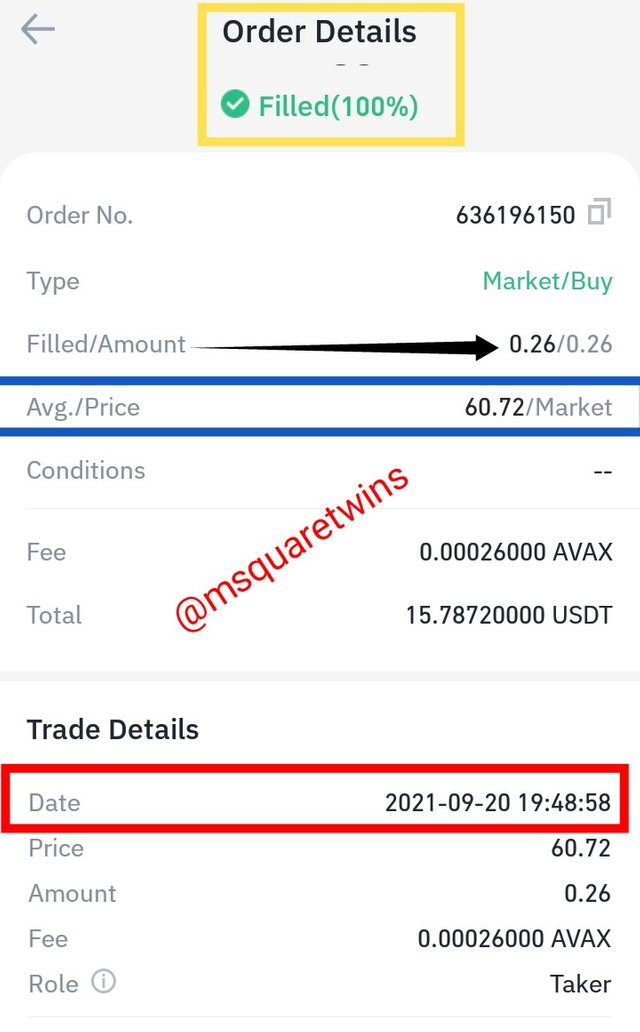
• I put 16 USDT in the amount tap at market price of $60.61. Then I clicked the buy button as indicated by a red box in the first screenshot.
• The second screenshot shows the order details as indicated by a yellow box.
• A total of 0.26 AVAX was filled as indicated by a black arrow at an average market price of $60.72
• The time that the order get executed is also indicated in the second screenshot by a red box.

4. Through a DEMO account, perform one sell operation, through the Contractile Diagonal method. Explain the process and demonstrate the results and graphical analysis through screenshots. Bitcoin is not allowed
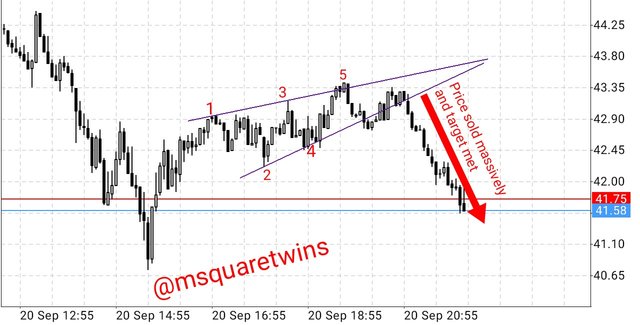
Contractile diagonal was spotted on the NEOUSD. Let's check the screenshot below.
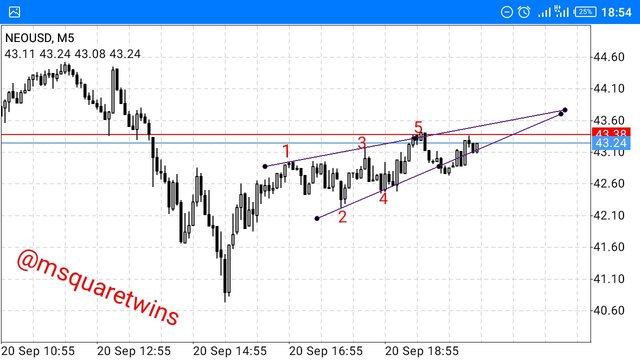
NEOUSD had been moving on a downward trend for some time. But the immediate bias is to the upside. Then the candle started to contract. As seen in the screenshot above, wave 1 is greater than 3 and 3 is greater than 5.
Also, wave 2 is longer than wave 4 and the diagonal converge at near by point.
Let's see the sell order of this in a screenshot below.
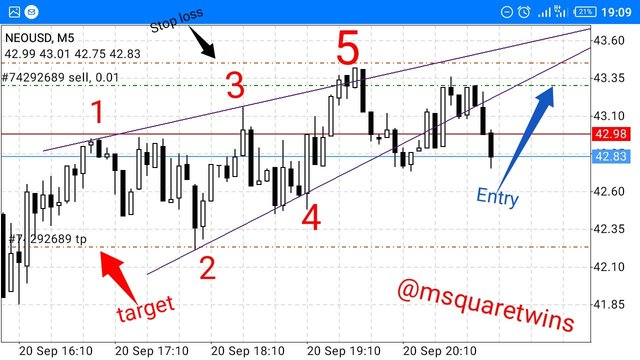
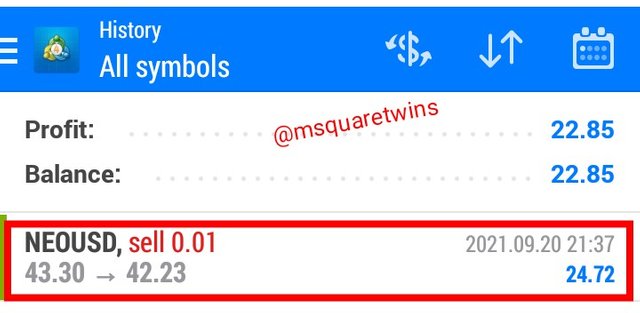
The screenshot above shows the sell order of NEOUSD. on MT4 Chart. The entry, at 43.30 as indicated by a blue arrow was made at a retest of leg 5 that broke the structure slightly downward. The entry also confluences with order block the market created in this place as seen in the screenshot above.
Stop loss was placed immediately above point 5 as indicated in the screenshot by a black arrow. The take profit or target was place at 42.23 which correspond to point 2 of the wave as shown by a red arrow in the screenshot above.
Below is the screenshot of the running trade
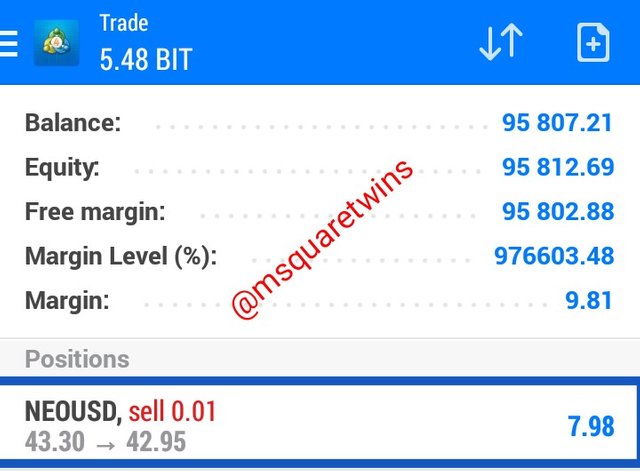
The market later sold from the entry and target was hit. See the screenshots below

5. Explain and develop why not all contractile diagonals are operative from a practical point of view. (screenshot required / Bitcoin not allowed)
In market, not all contractile diagonal are operative. Criteria is part of what traders look out for in selecting contractile diagonal that are valid. For instance, let's check the screenshot below
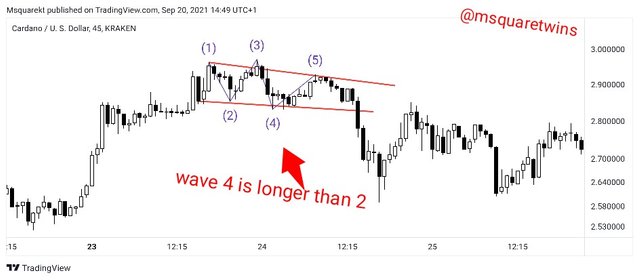
The screenshot above is a chart of ADAUSD. From the screenshot above, we can clearly see that wave 4 is longer than wave 2 which is against the rule. Also, the two diagonals or the trend lines do not seem to converge and as such may not cross each other at nearby place. Therefore, this kind of example isn't operative.
Let's also check the screenshot below
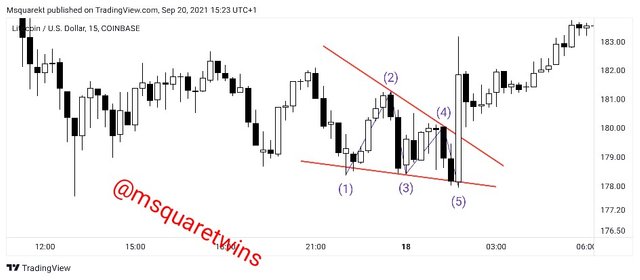
The chart above is a chart of LTCUSD. This is an example of a contractile diagonal. All the criteria are met in this example. Wave 1 is longer than 3, and 3 longer than 5. Also, wave 2 is longer than wave 4. Also the trace of first diagonal touched points 1, 3 and 5 and the trace of the second diagonal touched points 4 and 5. And the two trend lines converged. So, all criteria for this example were met.
But despite the fact that all criteria were met, it's not operative. The reason why it is not operative is that price broke the trend line aggressively even beyond point 2 which ought to be the target if entry should be made after the formation of the candle that broke the 2,4 diaginonal.
Also, if entry was to be made immediately the break is spotted, the stop loss will be placed below point 5 and target or exit point at point two. It is still not worth taking. Let's see the screenshot below.
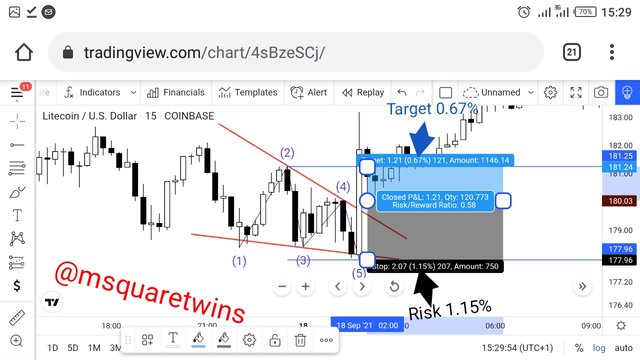
According to the screenshot above, if the entry is made immediately after the break, the risk as seen in the screenshot is 1.15% and the reward is 0.67% . The risk is higher than the reward. Therefore this kind of contractile diagonal is not operative.

Conclusion
Contractile diagonal is one of the pattern that is common in market and it is often follow by reversal and this make it unique. This is because if a trader rightly spot it, it would be at his advantage because he would have known what is attainable in market, especially as what trend to expect after the break of diagonal. Additionally, This pattern also helps in setting stop loss and it can be used as a great tool for exit strategy as discussed above.
Special thanks to Prof. @allbert for this lecture. It's really great to learn new thing in crypto market.
Thank you for reading
Written by: @msquaretwins
Cc:- @allbert