Hello Steemian, I hope you are doing okay. This is my homework post is about candle sticks patterns instructed by @reminiscence01 The lecture was pretty much explained in the very simple and easiest way. Here take a look at my homework.
Q1.In your own words, explain the psychology behind the formation of the following candlestick patterns.
- Bullish engulfing Candlestick pattern
- Doji Candlestick pattern
- The Hammer candlestick pattern
- The morning and evening Star candlestick pattern.
Bullish engulfing Candlestick pattern
A bullish immersing signal occurs when a new candle is preceded by a massive candlestick the next day, the body of which totally overlap or encloses the body of the prior day's candlestick.
Whenever four or more black candlesticks follow a bullish overflowing formation, it is much more likely to signal a reverse.
Doji Candlestick pattern
The doji candlestick chart pattern happens whenever the overall market entry and exit prices are nearly identical. The patterns are divided into four types: ordinary doji, gravestone doji, dragonfly doji, and long-legged doji.
The wick is indeed the straight line in the doji pattern, while the body is the horizontal line. Because the top indicates the maximum bid and the base indicates the lowest, the wick can be any size.
The Hammer candlestick pattern
The genuine body of a hammer is small, with a long downward shadow.
Hammers appear after such a price reduction.
The hammer candle suggests that the seller entered the marketplace during the interval, but that the sale was consumed at the closure, and that purchasers had driven the price back near the opening.
The closing can be either up or down open, but this should be closer to the open to keep the real body tiny.
The morning and evening Star candlestick pattern.
A morning star is a graphical pattern composed of three candles that technical indicators see as a bullish signal. A morning star appears after a declining trend that marks the beginning of its upward journey. It's a symptom of the prior price trend reversing. Traders look for the development of a morning star, then use other indications to verify that a turnaround is taking place.
Q2. Identify the candlestick patterns listed in question one on any cryptocurrency pair chart and explain how price reacted after the formation. (Screenshot your own chart for this exercise)
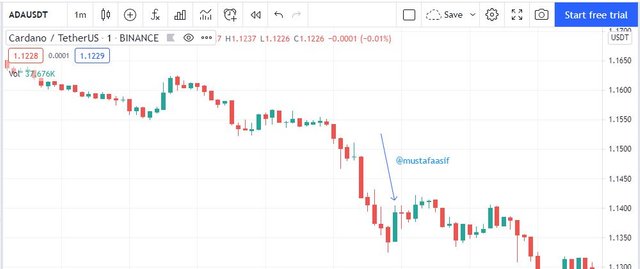
Bullish Engulfing Candlestick Pattern
The downturn above the chart lasted several minutes, with bear candlesticks. The upswing was driven by the bull candle that developed, which consumed the previous bear candle. When a bullish engulfing candlestick appeared, the price increased.
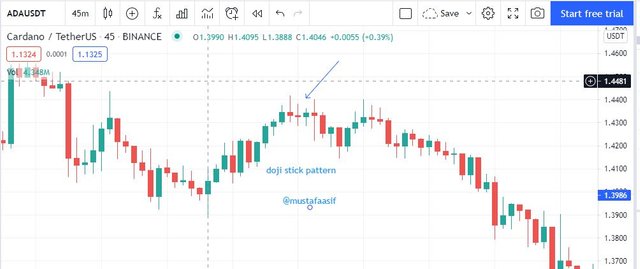
Doji Candlestick Pattern
The value at the time of the development of such set of candlesticks, as seen in the figure above, demonstrated that perhaps the price did not move far too much down or up. For roughly an hour and thirty minutes, it was shifting among two set regions.
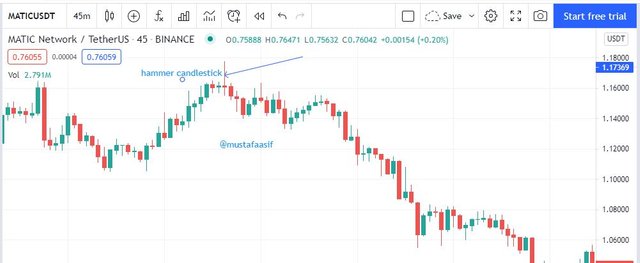
Hammer Candlestick Pattern
The value started at the bottom and fell before rising in an upswing. As this candle formation took shape, the value dropped further and further, indicating a downturn.
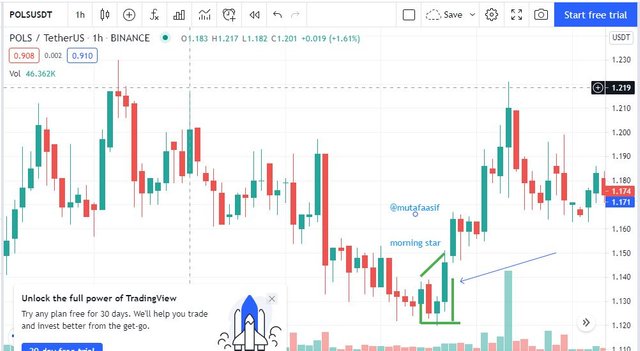
Morning and Evening Star Candlestick Pattern
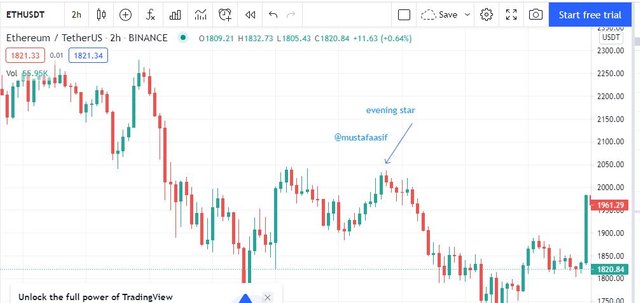
The creation of this candlestick formation resulted in upward market movements, which eventually turned into a decline.
The formation of this candle pattern led to a downward moment of price, leading to a downtrend.
Using a demo account, open a trade using any of the Candlestick pattern on any cryptocurrency pair. You can use a lower timeframe for this exercise.(Screenshot your own chart for this exercise).
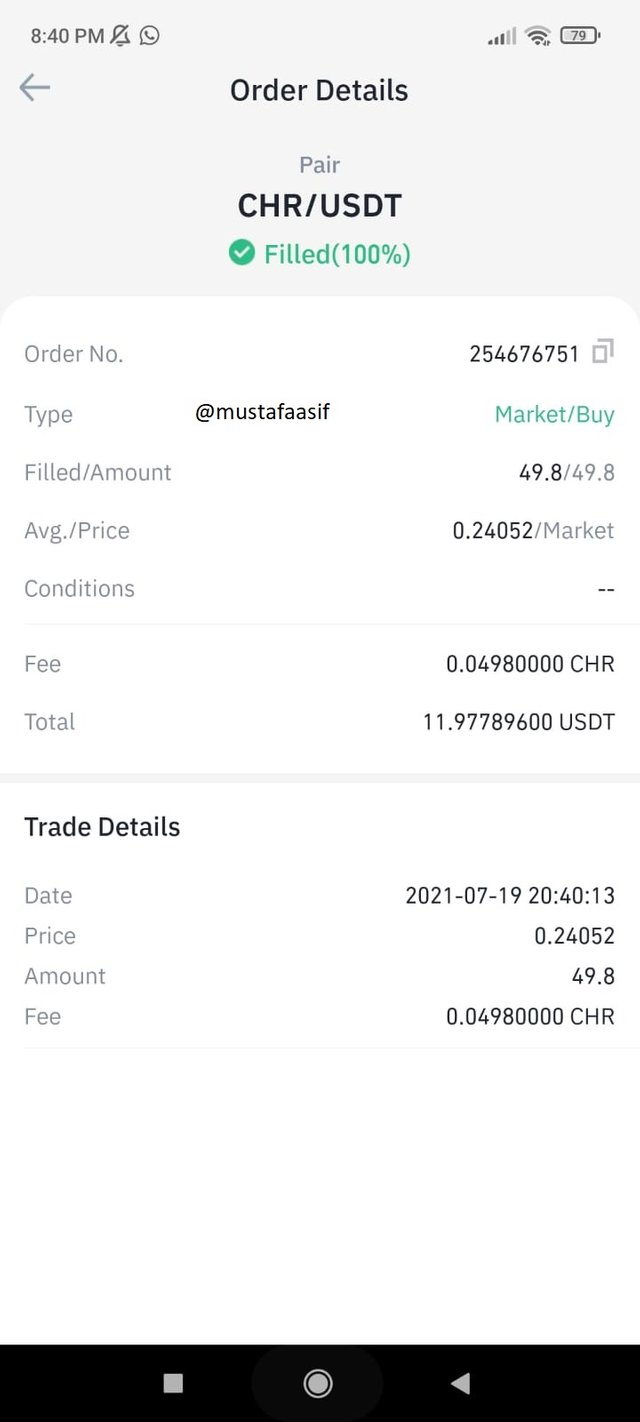
by seeing the second last Bullish engulfing Candlestick pattern i opened a trade. of CHR
Conclusion:
On cryptocurrency graphs, candlesticks produce a variety of formations. As there are diverse conceptual frameworks driving their forms, these rules change are indications of market circumstances. They can't be utilised on their own. They are used with great trading tactics and trading strategies.
#reminiscence01-s3week4 #cryptoacademy #chartpatterns #cryptohomework #steemit
