Hello to everyone. I'm really excited to be here for the first week of the season 6 crypto academy class program. Professor @dilchamo conducted a class on Effective Trading Strategies Using Line Charts. In this post, I shall answer to the assigned task.
Question 1
Define Line charts in your own words and Identify the uses of Line charts.
Line Chart
The line chart is a sort of price representation chart that employs a single undulating line to show the price action of an item over a specific period of time. The line graph is drawn using sensitive price data, which is the closing price of an asset over a given time period. As the price is represented with a simple continuous moving line, the noise created by arbitrary price volatility is smoothed, offering a clear depiction of price and an obvious directed bias regarding the present trend and trend formations.
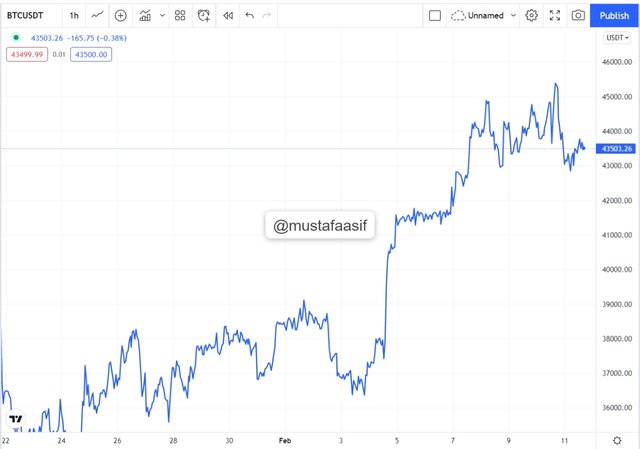
Once opposed to other types of cost chart portrayals such as a line graph or bullish engulfing charts, the streamlined depiction of cost that used a line graph makes it very easy for traders to identify the market condition at any given interval, which also significantly improves the trader's predicting possibility, actually results in simplified earning profit.
It is worth noting that, while the line graph offers a simplistic version of price action, making it ideal for novices to use when beginning their trading journey, both these chart shapes choose other delicate price data to provide information about price action, such as the initial price, high price, and low price.
Uses Of Line Chart
Line charts have a wide range of applications, some of which are as follows:
1- Simplified Representation
A line chart's most prevalent application stems from its ability to illustrate price movements in a straightforward manner. This assists traders in identifying the present trend, trend structure, and exact depictions of potential price movements. This also assists new traders in learning more about price evolution over a certain time period.
2- Identifying Resistance and Support
In a price chart, the line chart is helpful for spotting significant resistance and support levels. As previously stated, the line chart is produced using the asset's closing price at each interval, providing an accumulated price record that reveals regions of high resistance and support. Line charts on higher time frames (Monthly, Weekly, Daily) are commonly used by traders to depict significant resistance and buying pressure.
3- Trading Opportunities
Line graphs, like some other technical indicators, offer investors trading chances. To find winning trade settings, a line chart can be supplemented with indicators or other types of technical charting approaches. This notion simplifies and simplifies trading.

Question 2
How to Identify Support and Resistance levels using Line Charts (Demonstrate with screenshots)
Identifying Support and Resistance Using Line Chart
Resistance and approval numbers are pivotal swing price points when buyers (buying pressure) and sellers (selling pressure) respond visibly. These price points serve as a historical response zone for the price when pending trade orders are placed at those levels, resulting in a quick reaction of price around those levels, which can be rejected (bounced off) or violated (broken). Strong resistance and support levels are ideally established by how many times prices have previously responded around those levels, therefore functioning as both resistance and support levels in the past.
For determine a barrier or supporting point on a line graph, the market should really have reacted to the horizontal level at least three times in the past in relation to the present price. This shows that the level of resistance or support is significant to the present price action. I'll explain in more detail below:
Resistance Level Using Line Chart
A resistance level is a point at which buying pressure has been exhausted, allowing sellers to halt future price rises. In an ideal world, massive sell pending orders would be placed around critical resistance locations, resulting in price rejecting (bouncing off) the resistance level and a trend reversal (bullish to bearish).
It really is significant to mention that now the power of a provided resistance line depends on the timespan used; support levels recognized within results were computed time frames such as 5 Minutes, 15 Minutes, and 30 Minutes are relatively ineffective when compared to resistance levels identified on higher trading timeframes such as Daily, weekly, or monthly. Consider the graph below to see what I mean:
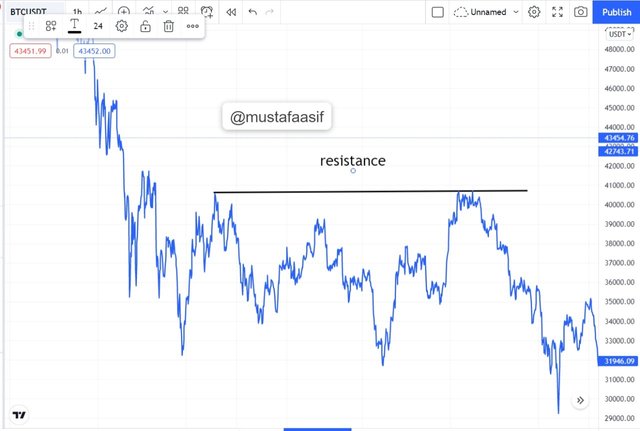
According to the ETHUSDT chart above, a resistance level has developed between $4,050 and $4,150. Price responded numerous times between these price points before moving in a specific way (bearish).
Support Level Using Line Chart
A resistance level is a zone when selling force has been exhausted, allowing buyers to avoid additional price declines. Large buy pending orders should ideally be placed around important support levels, which may result in price rejecting (bouncing off) the support level, resulting in a trend reversal (bearish to bullish).
It really is worth noting that now the power of a provided resistance level is subject to time picture used; for example, support levels recognized inside of results were computed time scales such as 5 Minutes, 15 Minutes, and 30 Minutes are relatively ineffective when compared to support levels identified on higher trading timeframes such as Daily, weekly, or monthly. Consider the graph below to see what I mean:

According to the ETHUSDT chart above, a support level has established between $3,900 and $4,000. Price responded numerous times between these price points and refused the level before moving in a certain direction (bullish).

Question 3
Differentiate between line charts and Candlestick charts. ( Demonstrate with screenshots)
Difference Between Line Chart and Candlestick Chart
That both following graph and the candlestick chart serve the same function of graphically showing price, however there are several significant differences among these, some of which are as follows:
1- Data Representation
Line Chart
A line chart depicts price action with such a solitary fluctuating line that is drawn with just the asset's closing price at a specific interval. As a result, this style of pricing depiction is quite simple and straightforward.
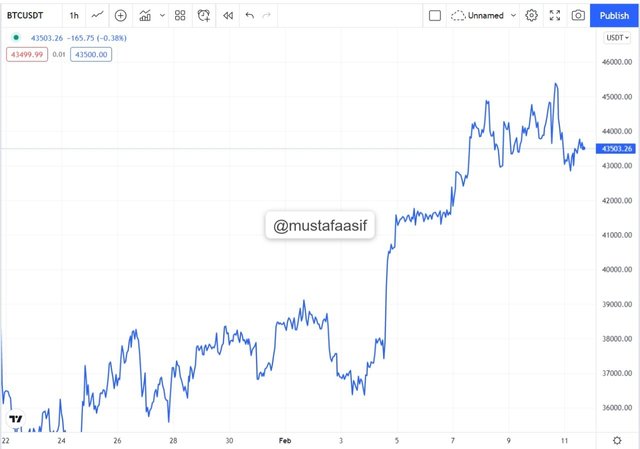
Candlestick Chart
The candlestick chart depicts price movement using features called candles that are shown utilizing sensitive pricing data such as the asset's opening, closing, highest, and lowest price within a specific time. This sort of representation gives more information about the price over a certain time frame.
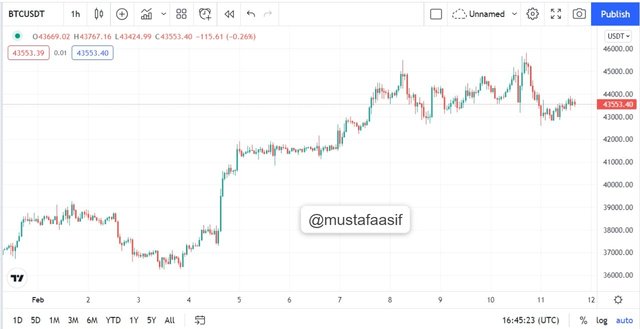
2- Trend Identification
Line Chart
The line chart makes use of a single oscillating line to emphasize the price group's directional bias. This decreases the ambiguity and noise associated with using numerous pricing data sets, resulting in a clear signal of potential price change.
Candlestick Chart
The candle chart employs candlesticks (bearish and bullish) to determine the price movement's directional bias. This might result in unclear price data representation, limiting a trader's ability to properly estimate the potential of a trade setting.
3- Identifying Support and Resistance Levels
Line Chart
The line chart makes it simple to spot significant levels of support and resistance. This is due to the way data is displayed on the chart, which allows for simple detection of significant swing points.
Candlestick Chart
The candlestick chart may be used to determine amount of resistance and support. Though utilizing a candlestick chart is a bit different due to how price data is represented, traders would examine several elements when drawing resistance and support levels on the chart, such as the wicks of candlesticks, when finding regions of opposition or supports.

Question 4
Explain the other Suitable indicators that can be used with Line charts. (Demonstrate with screenshots)
RSI and Line Chart
The RSI is a technical indicator that determines whether a marketplace is overbought, oversold, or balanced. This is accomplished using RSI values of 30 and 70. When the price falls below the 30 RSI level, the market is deemed oversold, and a positive reversal should be expected. While a rise over the 70 RSI level suggests that the market is overvalued and a negative reversal is likely.
The RSI, like any other indicator, is not perfect, thus it's best to utilize numerous confirmations before committing to a directional bias.
The RSI may be used in conjunction with the line chart to confirm a trade order's directional bias. To do so, the RSI must indicate whether the market is overbought or oversold, and then wait for price to break above a resistance level in the case of an oversold market, confirming the presence of buyers to push price upwards, and a break below a support level in the case of an overbought market, confirming the presence of sellers to push price further downwards.
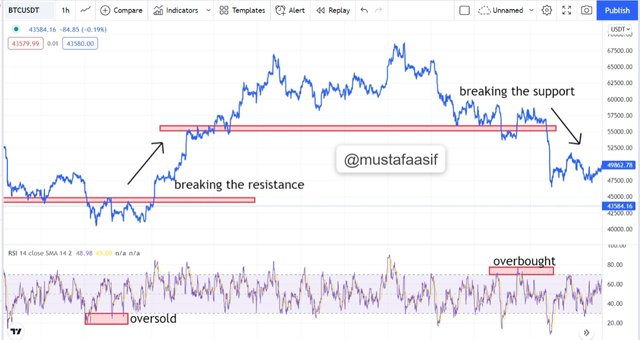
The RSI indicates oversold and overbought situations in the chart above. The bias was further supported by the break above resistance and support, as noted above, and the predicted trend reversal occurred. As previously said, the RSI is not perfect, thus it's best to utilize numerous confirmations before deciding on a directional bias.

Question 5
Prove your Understanding of Bullish and Bearish Trading opportunities using Line charts. (Demonstrate with screenshots)
Trading Opportunities Using Line Chart
Using a line chart to discover trading opportunities is entirely dependent on the trader's ability to spot trends and combine numerous indicators to create confluence. Although a line chart makes it simple for traders to recognize trends, it works best in conjunction with other indicators to uncover worthwhile trading opportunities. I'll use a line chart and the moving average crossing to demonstrate this (20 and 50 SMA).
Moving average crossing is a trading method that employs two basic moving averages with differing period settings, with an MA with a lower period (20) setting crossing above the MA with a longer period (50) setting considered a positive indication. Similarly, when the MA with a longer duration (50) crosses over the MA with a shorter period (20), it is considered a sell signal.
The secret to combining the line chart with the moving average crossing method is to wait for price action (line chart) to cross above or below the MAs, then wait for a cross to confirm the trade signal. Consider the following instances to demonstrate this:
Bullish Scenario
Price movement (line chart) should cross above the moving averages (20 and 50 SMAs) in a bullish scenario, then wait for the 20 SMA to cross above the 50 SM, indicating the existence of buyers and their readiness to drive price upwards. Consider the following graph:

Observing the chart above, the line chart broke above the two moving averages, followed by a cross of the 20 MA above the 50 MA, indicating the presence of buyers in price control. Trade was conducted after the moving averages crossed, the stop loss was set below the previous low, and the take profit was set to target the previous structural highs. The transaction has a risk-to-reward ratio of 1:3.
Bearish Scenario
Price movement (line chart) should pass below the moving averages (20 and 50 SMAs) in a bearish scenario, then wait for the 50 SMA to cross above the 20 SM, indicating the presence of sellers and their intent to push the price lower. Consider the following graph:
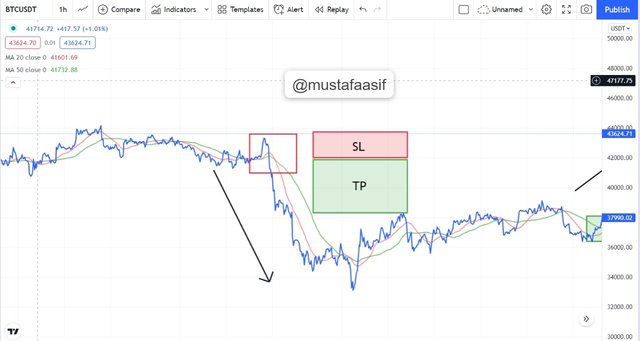
Looking at the chart above, the line chart broke below the two moving averages, followed by a cross of the 50 MA above the 20 MA, indicating the presence of sellers in price control. The trade was performed after the moving averages crossed, the stop loss was positioned above the previous high, and the take profit was set to target the previous structural lows. The transaction has a risk-to-reward ratio of 1:2.5.

Question 6
Investigate the Advantages and Disadvantages of Line charts according to your Knowledge.
The use of a line chart in trading has pros and cons. Among them are the following:
Advantages of Line Chart
The following are some of the benefits of using a line chart:
1- Simplified Representation
The line graph with a simple oscillation line makes it simple to read the chart and detect many characteristics of price development such as the trend, trend structure, and so on. This facilitates the simple interpretation of real-time market data, allowing traders to profit from a good forecast.
2- Identifying Swing points
Line charts make it simple for traders to spot significant swing points (resistance and support) in a market, considerably improving traders' ability to detect critical resistance and support levels.
3- Easy to Use
Because of its simplicity, a line chart is simple to use and easy to incorporate with additional indicators such as RSI and moving averages. This boosts the quality of trade signals created by the confluence even further. It also facilitates the learning process for new traders while researching trends and market structure.
Disadvantages of Line Chart
The following are some of the disadvantages of the line chart:
1- Less Information
Because of its simplicity, the line chart gives less details concerning price evolution that is useful to expert traders. When compared to candlestick charts, the absence of detailed information makes the line chart less appealing to use.
2- Trade signal
When used in conjunction with other indicators to determine a trade signal, the line chart performs admirably. As a result, the line chart is dependent on other indicators to provide trading recommendations.
3- Limited Usage
The line chart, in contrast to the candlestick chart, has extremely limited application because it only analyses the closing price of an item depicted with a single line. Various technical analysis aspects like as candlestick patterns (engulfing, doji, pin bar), chart patterns, and so on that provide additional insight into price development may only be employed sparingly on line charts.

Conclusion
A line graph is a sort of pricing depiction graph that employs a solitary undulating lines to show the price action of an item over a specific period of time. Once compared to other types of cost graph portrayal such as a line graph or intraday graph, the streamlined depiction of cost that used a line graph makes it very easy for market participants to recognize the market situation at any specified frame, that also greatly enhances the merchant's predicting future possibility, likely to result in streamlined trading activities.
Thank you professor @dilchamo for this educative and insightful lesson.
#dilchamo-s6week1#cryptoacademy#club5050#linecharts#pakistan
.jpg)