

Hello crypto fellas, how are we holding up for the beginning of the academy season 6. As for me, I think everything is moving pretty well. Today I will be talking about the zig zag indicator and how to use it in cryptocurrency trading. This task has been broken down into the professor’s lesson questions.


Cryptocurrency trading makes use of certain anlytical tools such as indicators and patterns which are used to predict upcoming market events from a technical analysis point of view. To know the current trend of a particular crypto asset we have to observe the price movement keenly and this is done by the use of some indicators which one of them is known as the zig zag indicator.
The said zig zag indicator is one of the common trading indicators that are used to identify points of weakness in an existing trend such that one can determine the reversal signal of the upcoming trend.
This reduces the work of trend lines and the support and resistance techniques that are commonly used to identify trend breakout and reversals. Knowing that support and resistance are the fundamental analytical techniques used during technical analysis, the precision that will be given by the zig zag indicator will do well to give the trader a good head start and probably a successful trading career.
Now the question goes as to how do we use this indicator? The zig zag indicator like most trend following indicators can be customized to the traders level or the trader’s desire. To customize this indicator we have to set up two things but fortunately these settings are already in default for the way we require them. We will use the default percentage of fluctuation of 5% so that analysis will only work around the 5% movement and hence silencing some false moves in the market. The data gotten from this indicator is from the price history or the history of the price action of the asset. This record provides a vivid signal that is given by the zig zag indicator to a trader. This brings about a late signal but it can still be used for the advantage of the trader since it provides a great deal of the past price movement. Making an immediate use of this indicator will require that we use other supporting data from trading tools like the Fibonacci retracement and even used with the Elliott wave theory.
Due to the said 5% fluctuation limit, this indicator has the ability to filter noise from the market and reduce the complexity and f the market such that it becomes easy to read. Therefore I’m an intense market movement, the zig zag indicator becomes more relevant.
The calculation of the zig zag indicator is carried out by the following means:
chose a swing low or high on the chart
Select your percentage
Identify the next swing low/high as in the fort point making sure it is not the same as the first point
Now draw a trend line from the beginning to the end
Finally, repeat the next swing low/high strictly different from the new one
Depending on the chart type used, the approach might differ but the feedback the same. If we use a line chart we’ll see that the response will only be for the closing price since the line chart solely depends on the opening and closing prices of an asset. Taking our candle chart, it’s seen that this indicator will give us a record of the minimum and the maximum points on the chart.


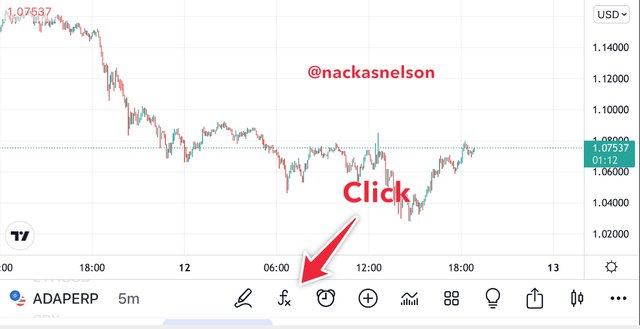
There are two parameters in the set up of the zig zag indicator that should be taken note of such that the noise level and accuracy are balanced. To add this indicator on the price chart of an asset of interest, you have to add it like you add any other indicator on the trading platform. On tradingview, you click on the indicator button and later type the name of the indicator “zig zag” and it will appear below such that you can click on it and it automatically adds to your chart. I will describe this process in the steps below using screenshots.

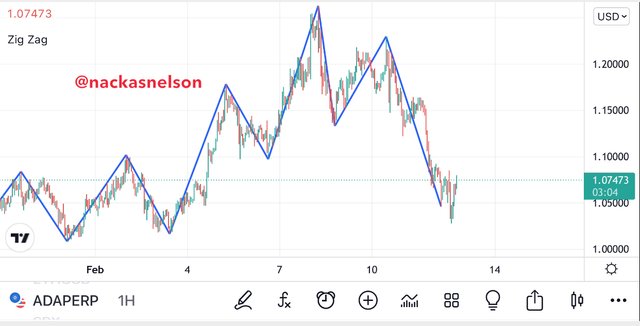
Now we can get into the description of the main parameters known as the Deviation and the Depth.
This parameter measures the change in prices from minimum to maximum price (fluctuation) to keep track of the market movement in order to be able to identify new peaks via the zig zag indicator.
The depth of the indicator stands for the regulator of the indicator representing a new maximum and minimum difference from the previous max/min point. This is set at 10 which is half the deviation value.
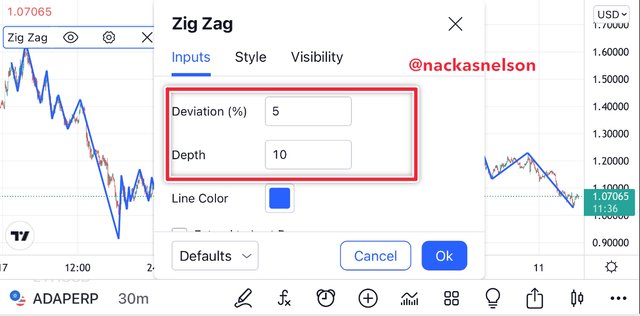
After this configuration, we should know that we have made the indicator to be less complex on signal and also not avoid or minimize vital information from the market. This will avoid price breaks from affecting the indicator signal or giving false information.
The implication of low depths is that we want to avoid noise and also we don’t use very high depths to avoid silencing activity. This task of configuration is very vital and plays a great deal in the whole process. It is always good to change the default setting provided you know how to use the indicator very well.


Using the zig zag indicator we can know a bullish trend and a bearish trend in long term, medium term and short term markets such as the intraday trading analysis. The zig zag indicator follows the price so much so that it becomes an imprint of market occurrence. So it’s probably easy for traders to use this indicator to figure out a price trend and necessary getting the breakout zones. So in a bullish trend reversal one can easily spot the beginning trend of a bear trend such that a good position can be taken. A bullish trend is made up of higher highs and higher lows while the bear trend is made up of lower highs and lower lows. If this is maintained for some time we’ll have a price harmony. To easily understand the trend we can use the zig zag indicator as a reference for determining the higher highs and higher lows or the lower lows and lower highs.
Taking a position means that the trade has been a certain opportunity identified such as a reversal or a trend continuation. If the current trend loses its momentum, it’s very usual that it will become weak and therefore lead in the opposite direction.
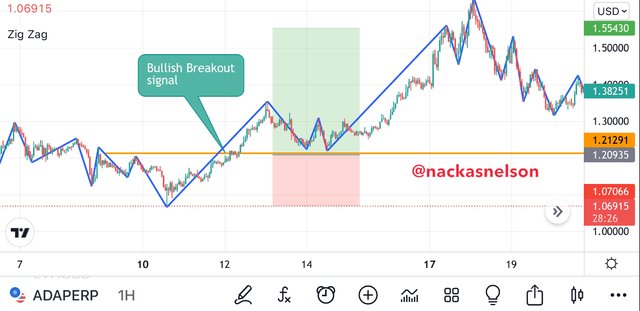
A long position can be taken when the zig zag indicator shows a higher low being broken to the downside such that we have a lower low instead of a higher low. In this case we wait until the new low makes a retracement and is unable to break the peak of the last high then we can make an entry.
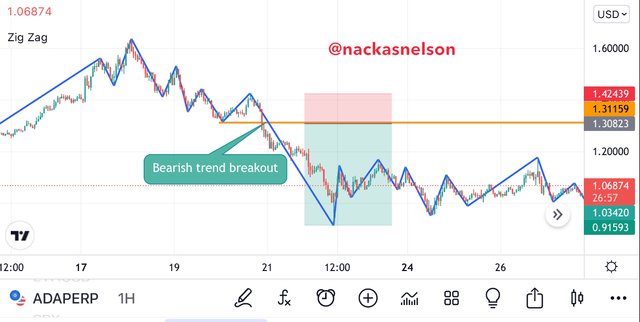
For a short position we wait for a lower high to be broken on the upside such that we have a higher high instead of the lower high. At this point we wait to see if the higher high will retrace to a lower low but if it continues by breaking the peak of the previous high, we make a Sell entry.


The fundamentals for technical analysis in trading are known to be the support and resistance levels where there is a certain price level where the asset trades and is unable to go beyond for a certain period of time. The zig zag indicator can be used to identify the support and resistance levels on a price chart. When this is identified, we can easily identify the motion of the market such that we can make bearish (short) or bullish (long) position entries. Below I will talk about how these can form on the price chart.
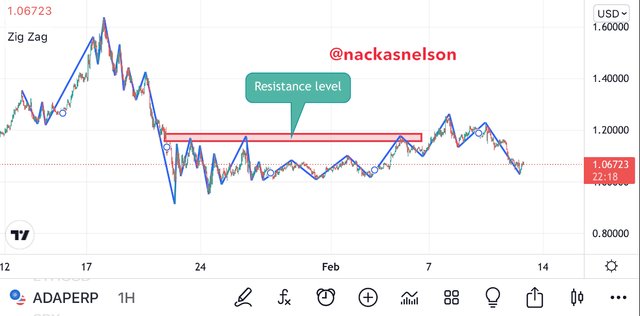
When prices reach a certain level and bounce back to the down side, that price level automatically becomes a resistance level. Upon any breakout from the resistance level, the market will see a bullish move or even an impulsive move to the north.
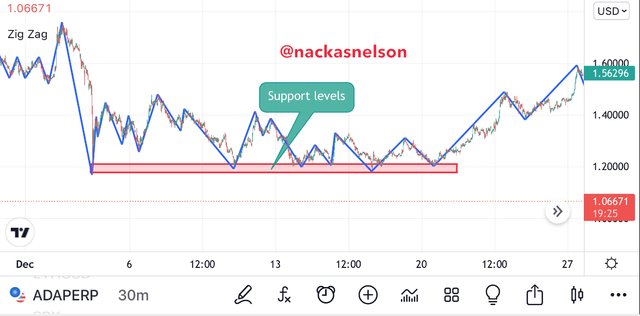
To identify the support level you have to look deep into the zig zag move. If the troughs of the zig zag indicator line appear to stay at a particular price level and seen that the price trades have to the upside all the time, we know that a support has formed at this price level. We mark such points and wait for possible market breakout moves.


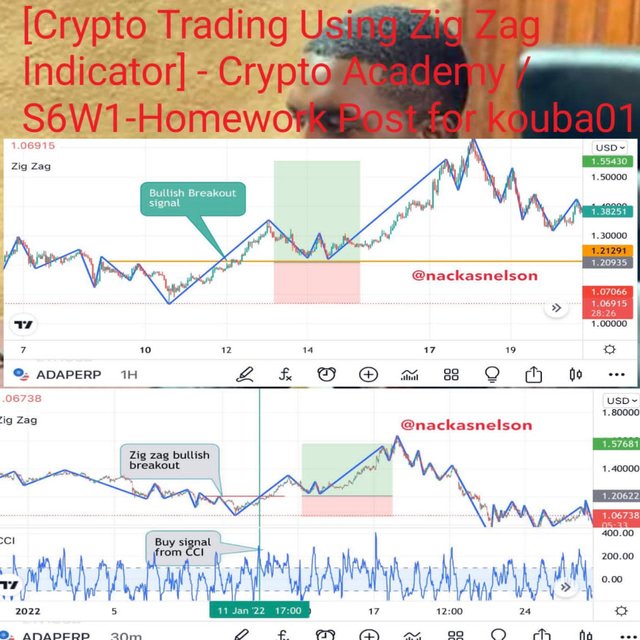
The CCI indicator is used to complements the zig zag indicator during identification of trends and trend breakouts in order to make entries. This indicator is just like the RSI indicator but works in the opposite direction. When the CCI is below the zero line it gives a sell signal while when it’s above the zero line it gives a buy signal. When both zig zag and CCI are applied in a particular trading analysis, they will provide a good result such that the trader has more confidence in the signals therein.
Using the zig zag and the CCI indicators in a confluence will give more guarantee to the trader in the technical analysis process. So when the zig zag says we have a bullish trend or bullish breakout, the CCI indicator will filter it and when the CCI aggrees to the zig zag and gives the same buy information, we take an entry with no hesitation.
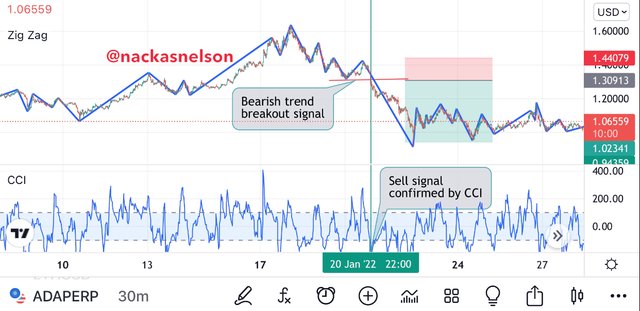
To identify or place a sell order, we have to make sure the CCI and the zig zag work in confluence such that whenever a short signal is given by one indicator and not confirmed by the other, we consider it false. When both indicators say we have a sell signal, we can take an entry at once.
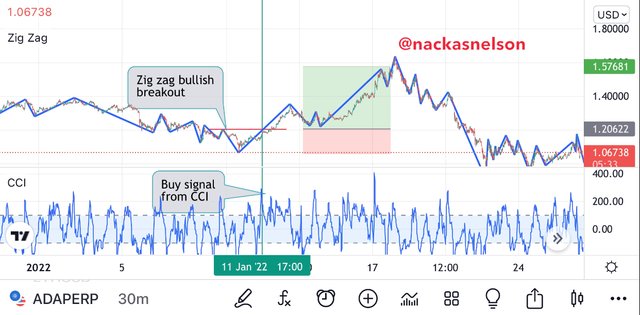
As can be seen on the screenshot above, the zig zag indicator and the CCI indicator have been used in confluence such that it provides the same signal which is a clear entry point.


Normally indicators are better when used in confluence with other indicators in order to silent false signals. To prevent such false signals, we have to add a filter indicator to make do away with the false signals and make only good and clear signals to be taken into consideration. In this case I will need a filter indicator to keep the signal free from false information. When the zig zag indicator signal is confirmed by another flirted indicator, then we can make an entry because we are sure enough.

The above screenshot shows the zig zag indicator in confluence with the Exponential Moving Avearge. When we add the EMA to a price chart already containing the zig zag indicator, we can easily identify trends and when they breakout. Knowing that placing two EMAs will give us an entry signal whenever both EMAs cross each other, the signal from the zig zag will be well complemented. In this case I will use the 50-period EMA and the 20-period EMA lines together with the zig zag indicator. This will prevent false signals from distracting the trader.
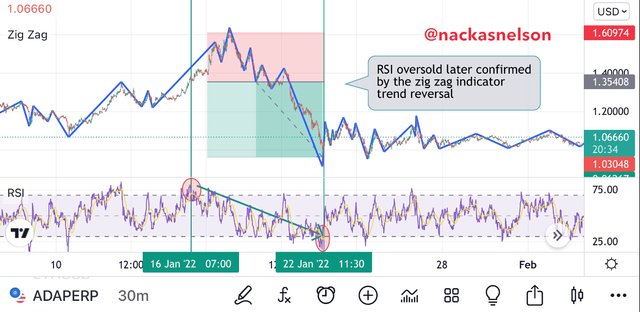
The above screenshot shows the RSI used in confluence with the zig zag indicator such that fasle signals can be prevented. Like I said in the other section that the RSI almost works the same as the CCI indicator even though both indicators act opposite in signals. Whenever the zig zag indicator shows a buy signal, the RSI should be in the oclversold region and the reverse is true. Therefore the RSI at the 20 level is considered an oversold and at the 80 level is overbought.


The zig zag indicator like others has its pros and cons so much so that it can be limited and also chosen over other indicators for specific analytical purposes. The signals from the zig zag indicator are not proactive but lagging and this is a basic disadvantage of the zig zag indicator.
| Advantage | Disadvantage |
|---|---|
| Silence unnecessary fluctuation in prices | lagging signals |
| Used in all time frames for technical analysis | the last point is never stable and can not be used in analysis |
| Came be used in confluence with other indicators | without filter indicators it can give a lot of false signals |
| It’s signals the least significant market move | an information can be gotten differently by different traders |
| Good for strong market trends | limited in trend identification signals |


The zig zag indicator is a trend identification indicator which can also be used in confluence with other indicators to filter fasle signals and reduce noise in the market. It is capable of identifying trend movements and breakouts such that it’s called or known as a trend following indicator. The ability of such workability comes with the way the indicator is configured to avoid loosing vital information from the market and also not closing or preventing the view of uncertain market movement.