
1. What is your understanding about Triangles in Trading. Explain all forms of triangles in your own words. (Screenshot required)
2. Can we also use some Indicators along with it Triangle Patterns? Explain with Screenshots.
3. Explain Flags in Trading in your own words and provide screenshots of both Bull Flag and Bear Flag.
4. Show a full trade setup using these Patterns on any Cryptocurrency chart. (Ascending Triangle, Symmetrical Triangle, Bear Flag)
5. Conclusion
Introduction
Greetings dear all; it is yet another day and I am extra happy to be here to get knowledge. Thank you professor @sachin08 for the lecture and I’ll move straight away to the homework tasks and answer the questions.
What is your understanding about Triangles in Trading. Explain all forms of triangles in your own words. (Screenshot required)
Triangles are commonly used technical analysis tools which consist of multiple candlesticks enclosed within two converging lines. These two converging lines form a triangle-like shape. Patterns are very important for every trader because, once they spot the trend, they could actually predict future outcomes hence more profitability which is actually the goal in trading. In market terms, triangles help to indicate the continuation of a bullish or bearish market.
Triangles in simple words actually indicate whether a particular trend will likely continue or not. The triangle chart pattern is actually formed by drawing two converging trend lines as the price moves. It is these trend directions that are used by traders as a signal to enter the market hence helping them to attain their objectives for example profitability. By placing your buy stop above the resistance level, it indicates that you are trading up a triangle. Similarly,by placing your sell stop below the support level, it shows you are trading down a triangle.
As the price action carves out a pattern, three triangle variations are identified . These are; ascending, descending and symmetrical triangles.
Ascending Triangle
These triangles actually indicate a bullish formation which anticipates an upside breakout. The top trend lines are relatively flat and illustrate the overhead resistance level. The bottom trend line on the other hand shows the upward market direction. As the trend continues, there is a progressive higher support level.
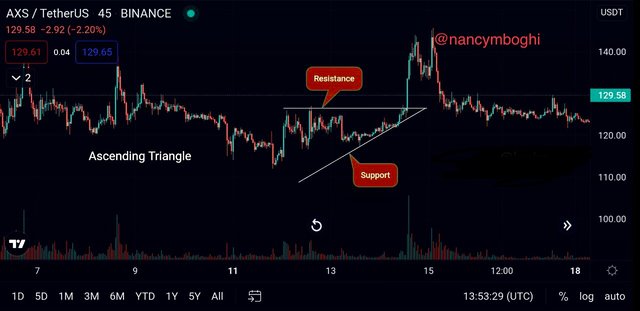
This pattern means that the buyers here are far more aggressive than the sellers. It is explained by the fact that prices continue to make higher lows.
Generally, ascending triangle patterns are known for being a reliable indicator for entering a long position.
Descending Triangle
These triangles actually illustrate the opposite of a bullish movement; they are bearish. Descending markets are characterized by a downward or descending upper trend line . Here, the button line shows a flat price while the top line shows a progressively lower resistance(downward movement). As the bearish nature starts taking control of the market, the price volatility greatly narrows(more certainty).
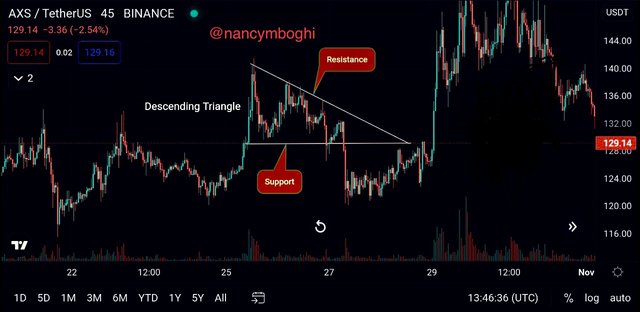
Here, sellers are more aggressive than buyers which is clearly seen as the price continues to make lower highs.
This therefore means that traders could enter with a short position so as to benefit from the further downward movement.
Symmetrical Triangle
Unlike ascending and descending triangles which show an obvious upward or downward movement, symmetrical triangles indicate market indecision indicating that we can expect either a breakout or breakdown. In other words it is a neutral pattern and doesn’t rely on any direction. As the name goes, the triangle can be seen after drawing two converging trend lines on a chart. These ranges have support and resistance moving closer together.
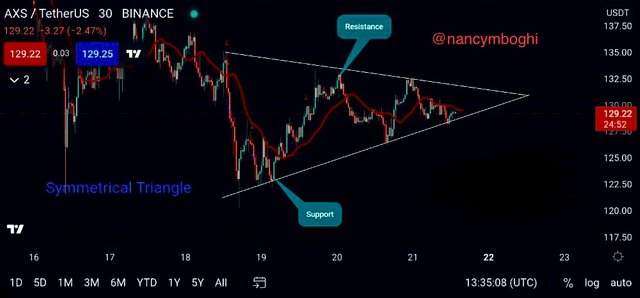
Though they are neutral, they often favor the market’s general direction. In simple words,a bearish trend for example before the market started to move into a symmetrical triangle most likely means another breakthrough. For a bullish trend, it most likely indicates another breakout.
Therefore, traders often open their positions when the price starts moving in one of the two directions once a symmetrical triangle has been identified.
Note that, it is extremely rare for symmetric triangles to be perfectly formed.
Therefore, traders should take their time in order not to invalidate wrong price movements or imperfect patterns. It is of utmost importance that they understand that Triangle analysis should be more about understanding what the market is actually communicating through price action.
Can we also use some Indicators along with Triangle Patterns? Explain with Screenshots.
In order to take entry in the market chart, traders also often use moving average(MA). Using this to identify trends is equally very important and of great value. It is actually a simple technical analysis tool which smooths out price data. It does this by creating a constantly updated average price. This average price is often taken over a given time period for example 20days, 30minutes, 40weeks and so on as the trader chooses. This strategy is good such that it can be tailored to any time frame so as to suit both long and short term investors and traders.
MA could be applied such that they identify trend direction as well as determine support and resistance levels.
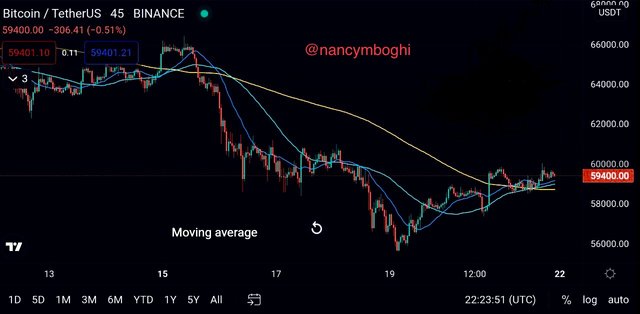
In order to properly make use of moving averages, one has to wait for the fast moving average to cross over or above the slow moving average. This indicates a buying opportunity showing the entry and exit point in a price chart pattern.
Explain Flags in Trading in your own words and provide screenshots of both Bull Flag and Bear Flag.
A flag is something that calls for attention; it is some kind of reminder to everyone who sees it. Flags in trading are price patterns that move in a shorter time frame counter to prevailing price trends observed in a longer time frame. In other words, they are continuation patterns which are formed when price trends instead move back from the predominant trend in a rather parallel channel. These continuation patterns actually allow and help traders to perform technical analysis which helps them in making sound financial decisions. The pattern of a flag is highlighted from the strong directional move called a flagpole and a slow counter trend move called the flag.
There is the Bull flag and the Bear flag. These are actually price patterns in the financial market which occur often over different or varying time frames. They are referred to as continuation patterns because of their tendency of occurring prior to the trend which preceded their formation.
Bull flag pattern
This pattern portrays a positive development. It is formed when the price takes another direction by going sideways. This sideways movement lowers the price action on weaker volume followed by a sharp new high on strong volume. In other words, a bull flag pattern is a continuation pattern which occurs as a short pause in the trend which precedes a strong price move higher.
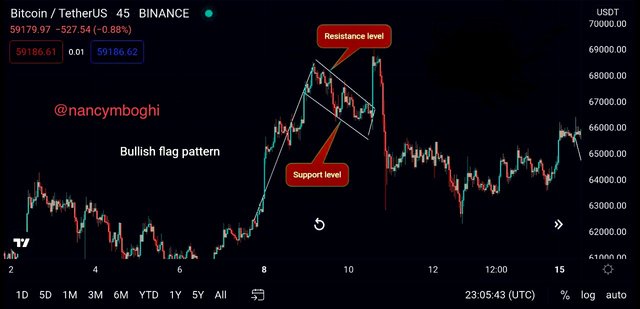
This pattern is mostly followed by traders because it is easily predictable and true .
This flag is sharp. It equally has a strong volume rally of either a stock or an asset which portrays a positive development.It occurs in an uptrend.
Bear Flag pattern
It actually looks like an inverted bull flag This on the other hand is a sharp volume decline that takes shape on a negative development when the price of an asset rediscovers itself by going sideways to higher price actions. This price action goes on weaker volume which is eventually followed by a sharp decline to new lows on strong volume. Inorder to identify this, traders would need to find a flagpole representing an initial decline. This decline however could either be steep or sloping slowly. Hence the bear flag identification can be done as a consolidation period wherein prices may retrace from the initial move mostly slowly channeling upwards. Traders however should wait for the price to follow a downward trend
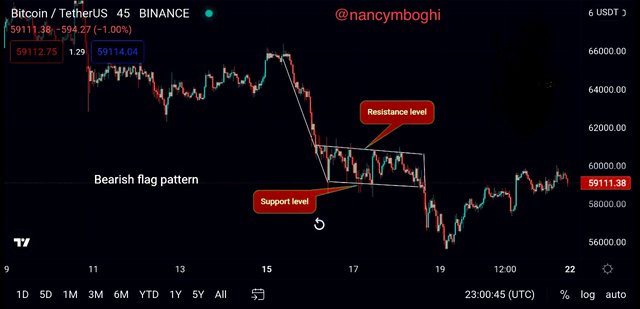
A bear flag is a sharp volume decline which portrays a negative development. Traders are encouraged to go short
Show a full trade setup using these Patterns on any Cryptocurrency chart. (Ascending Triangle, Symmetrical Triangle, Bear Flag)
Ascending Triangle
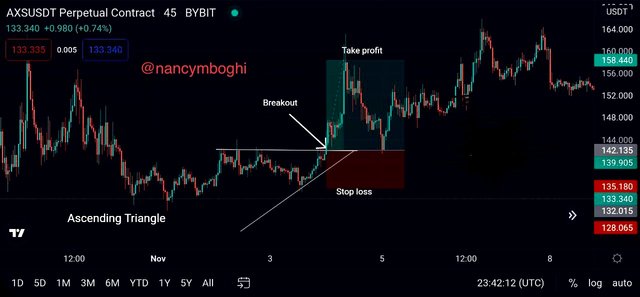
Looking at the chart above, it can be seen where I drew the trend straight line. This line serves as the resistance level and the upward line serves as the support level. Each time the trade hits the resistance line, the market reverses up to where there is a breakout line wherein I then take my entry. Hence, the market rises till it hits my profit.
Symmetrical Triangle
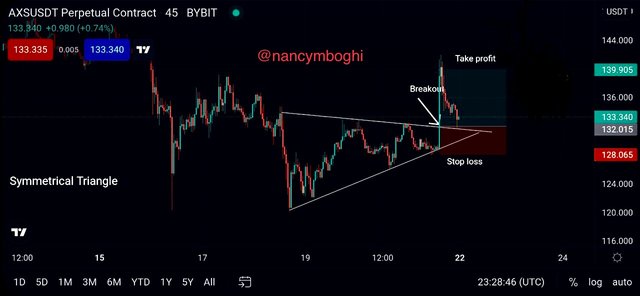
According to the chart above, the market was taking a bullish trend at first after which it came down, hit the support level and then went back up. Once there was a breakout, I used the symmetric triangle to make my entry. With this done, the market goes up and hits my take profit. Additionally, it can be seen that my stop loss is actually set below the support line.
Bear Flag
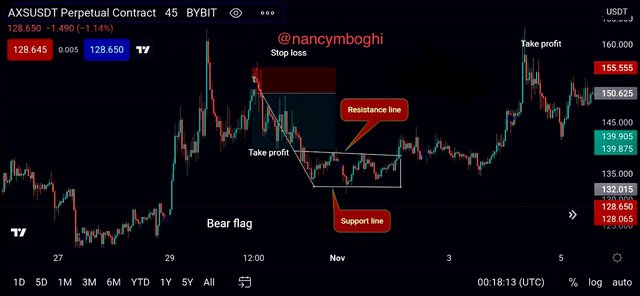
The bear flag above looks like a ranging market but it was actually formed after a massive downtrend in the market price. Note that, this is a future trading thus I am predicting a price fall after a bullish trend which means that I will go short. Equally my stop loss is set at the top confirming the price fall prediction and when it reaches my take profit, I will then execute.
Conclusion
Through the lectures and homework tasks, I have learnt a lot about Triangles and flags. I equally learnt about moving averages. It was a beautiful and challenging exercise as I answered the questions. Traders should try knowing about indicators so as to make good entry and exit points. These will lead to good trading decisions hence more profit. Thank you for this awesome lecture professor @sachin08
All screenshots gotten from Tradingview
Thank you for reading through.
CC
Professor @sachin08

Great!!!
Downvoting a post can decrease pending rewards and make it less visible. Common reasons:
Submit
Thank you
Downvoting a post can decrease pending rewards and make it less visible. Common reasons:
Submit