
Questions
1. Explain Rectangle Pattern in your own words.
2. How to identify Rectangles. Explain with Screenshots.
3. Can we use indicators with this pattern to get accurate results? Explain with Screenshots.
4. Explain Rectangle Tops and Rectangle Bottoms in your own words with Screenshots of both patterns.
5. Show full trade setup using this pattern for both trends. ( Entry Point, Take Profit, Stop Loss, Breakout)
6. Conclusion
Introduction
Greetings steemit crypto academy; it is always with joy that I am here to gain knowledge. Thank you professor @sachin08 for this awesome lecture and I’ll go through by answering the questions. Thank you.
1)Explain Rectangle Pattern in your own words.
It is a technical analysis pattern that is formed by horizontal lines showing significant support and resistance. It is formed as a trading range during a pause in a trend. A rectangle pattern is easily identified by two or more comparable highs and two or more comparable lows. Rectangles are successfully traded by buying at support and on the other hand selling at resistance or by waiting for a breakout.
Summarily; Rectangles are formed or occur when there is a movement in price between horizontal support and resistance levels. This pattern is actually an indication that there is no trend. This is because the price moves up and down between support and resistance with the support line established by at least two valleys “W” and the resistance line with at least two peaks “M”. Again it is worth knowing that the rectangle actually ends when there is a breakout hence the price moves out of the rectangle. And to crown it up, some traders buy at or near the support and sell at or near the resistance while others just wait for the breakout. Rectangles are alternatively referred to as consolidation zones, connection areas or trading ranges.
Below is a graphical illustration of my theory.
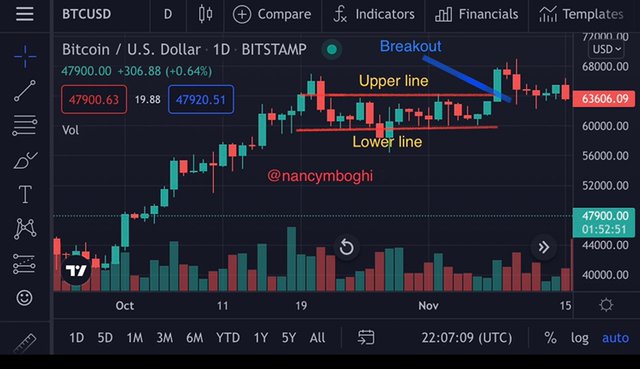
The upper side of a rectangle is known as the Top trendline while the lower part is known as the Bottom trendline. Because rectangles often show a ranging phase, the upper trendline shows resistance while the bottom trendline shows support.
2)How to identify Rectangles. Explain with Screenshots.
As mentioned above, it is easy to identify rectangles by two or more highs and lows. These are highs and lows which can be connected to form two straight lines which would make up the top and bottom of the rectangle.
One could easily find rectangles in the market by first of all finding any bullish or bearish trend. Once this is identified, we can observe for a rectangle either just before or after the trend. This is because the ranging phase usually exists before the breakout.
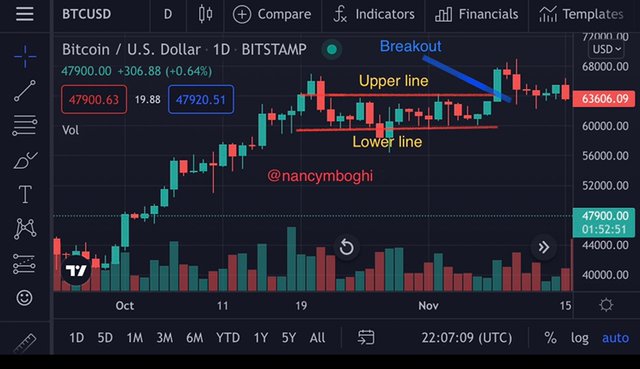
Very important to note is that while looking out for a rectangle, the upper trendline should be drawn such that at least two high prices should touch the resistance line and at least two low prices should touch the support trendline in the lower trendline.
3)Can we use indicators with this pattern to get accurate results? Explain with Screenshots.
Normally, it is not advisable to use only one indicator as the certainty of your results will not be guaranteed. Thus, other indicators can and should be used alongside rectangles so as to get accurate results.
I will talk about two other indicators that can be used with rectangle patterns.
- The RSI indicator.
For more accurate results, the RSI is used alongside our rectangle.
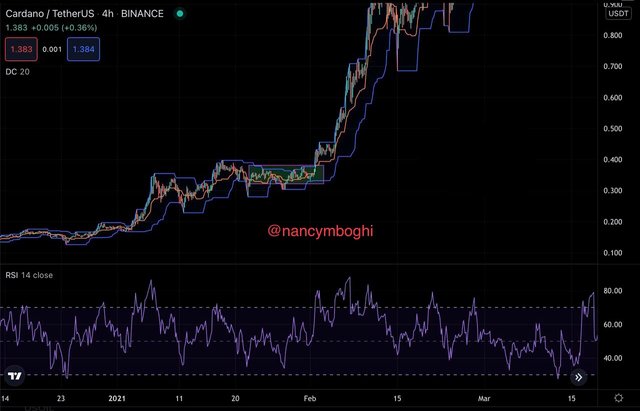
On the chart, we can see where the rectangle is forming as well as sideways candles of the RSI. This indicates that there is neither a bull or bear but will soon occur.
We can see RSI indicating a bull as a candle break the rectangle. With this, we can know our rectangle is not a false alarm
- Stochastic
Stochastic is another indicator that can be used alongside a rectangle for more clarity.
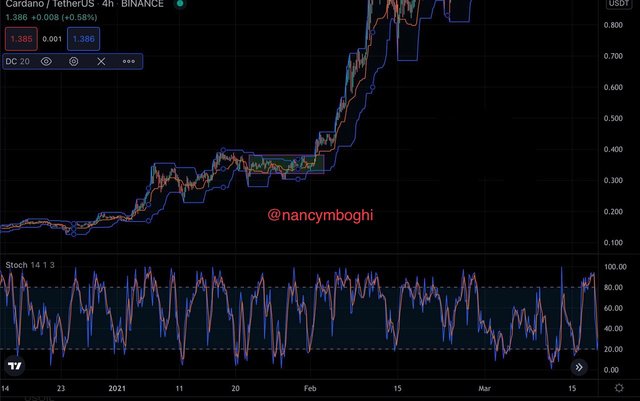
We can see that the stochastic is not really giving a clear signal as concerns a future bull or bear. However, it does give a short term intraday trading in a triangle pattern.
This again tells us that a rectangle whose candle forms sideway patterns could be useful for short term profits.
4)Explain Rectangle Tops and Rectangle Bottoms in your own words with Screenshots of both patterns.
There are two places on a trading chart wherein a rectangle pattern is identified that is either at the top or the bottom. The terms rectangle tops and bottoms come from this.
Let’s start with
- Rectangle Tops
A rectangle top is when prices enter the rectangle pattern from below. They are actually continuation patterns that develop either within or during an uptrend. If there is a downward break in a Rectangle top, it usually signifies a downtrend. And as the name goes, they are formed and found at the top of charts.
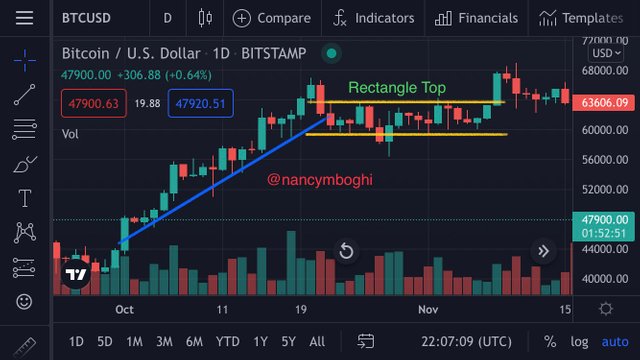
We expect price to break out from the bottom trendline when rectangle tops are formed. When this breakout finally occurs, it therefore means the bears are in full control of the price hence traders could either place a sell trade or close their buy positions.
- Rectangle Bottoms
A rectangle bottom is when prices enter the rectangle pattern from above. They are actually continuation patterns that develop either within or during a downtrend. If there is an upward break in a Rectangle bottom, it usually signifies an uptrend. And as the name goes, they are formed or found at the bottom of charts.
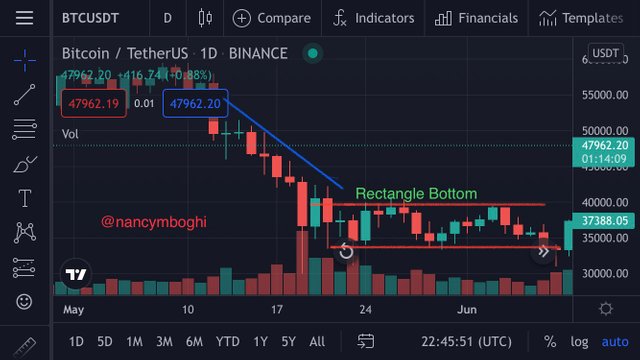
When the rectangle bottom pattern forms, we expect the price to break out from the top trendline. When this breakout finally occurs, it means that the bulls are in full control of the price therefore traders could either place a buy trade or close their sell positions.
5)Show full trade setup using this pattern for both trends. ( Entry Point, Take Profit, Stop Loss, Breakout)
- Buy Trade Setup
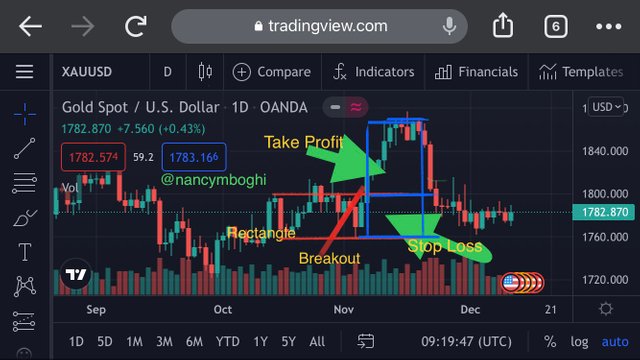
Looking at the screenshot above, we can notice a rectangle formed which touches each trendline three times. The point which breaks the resistance line becomes the entry point. Equally, we can take our entry, mark take profit level as well as stop loss level below the support line at the time of breakout.
- Sell Trade Setup
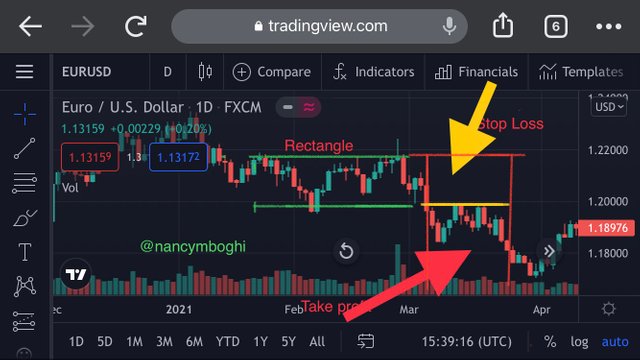
From the screenshot, we can identify a rectangle formed. When it breaks the support line, the point becomes the entry point. With the breakout, we can mark our entry, take profit and stop loss levels just above the resistance line.
6)Conclusion
To conclude, I would say I have learnt all about rectangle patterns. I can now identify rectangle tops and bottoms as well as their implications. I have equally learnt how rectangles can be used in a trade set up to enter the market, take profits, stop loss and breakout. An understanding of this together with other indicators will go a long way to guide my trading decisions for the best. Thank you dearly professor @sachin08 for this great knowledge.
Cc:
@sachin08
