
¿What is simply the MACD indicator?
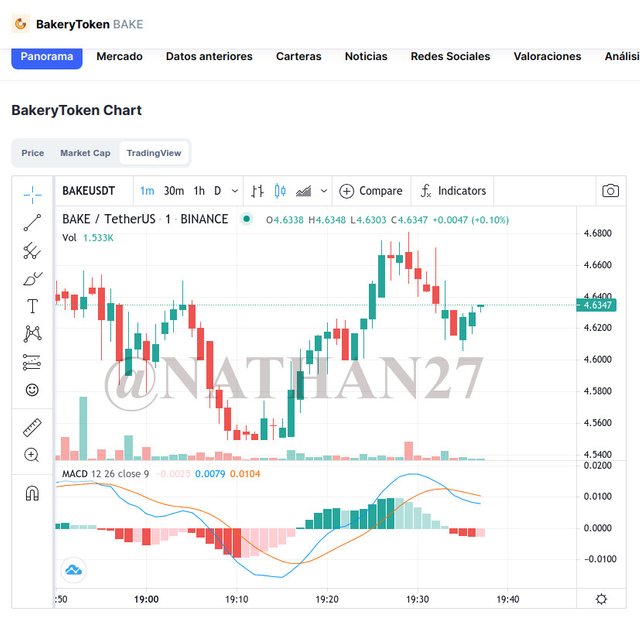
The MACD indicator It is an indicator used in the technical analyzes carried out by traders, in this indicator we can see the movement of the average between divergence and convergence of prices, and calculate with it the movement of the market, it is widely used since it has a great precision in its use, this indicator, especially like any indicator, works through time cycles, cycle 12 - 26 being the standard cycle in this technical indicator. In this type of indicator we can also detect signals of over buying and selling, that is why this indicator is one of the most versatile that exists.
This indicator has 3 basic tools.
The main line of the MACD: It is the Main line where it marks the average of the market movement
The signal line: It is a moving average slower than the main line of the MACD when it intersects the main line either up or down, it can be anticipated if there will be a change in trend.
The histogram: Here we can see if the price increases or decreases quickly. Apart from observing the market trends as implemented.
Is the MACD indicator good for trading cryptocurrencies?
This MACD indicator is one of the most used to analyze the markets and the cryptocurrency market is not an exception, since it has several signals from various technical indicators together, which make it possible to detect from a change in trend to values where they indicate the market momentum or setbacks and loss of strength. Apart from the fact that it has been used by Wall steet brokers for more than 30 years
Which is better, MACD or RSI?
The best technical indicator is decided by each person, now if we talk about the most complete it is clear that it is the MACD since they have so many uses, in which we can detect market trends, and changes in it, we can detect overbought levels and On sale, we can also see the force with which the markets exert, although in the RSI we can also see these data, and they are in fact more reliable in many cases, I would not opt for either of the two, I would apply both to achieve my analysis , since both were created with a purpose, that although they are very similar in one I see signs that in the other it is not possible, I would work with both.
How to add the MACD indicator to the chart, what are its settings, and ways to benefit from them? (Screenshot required)
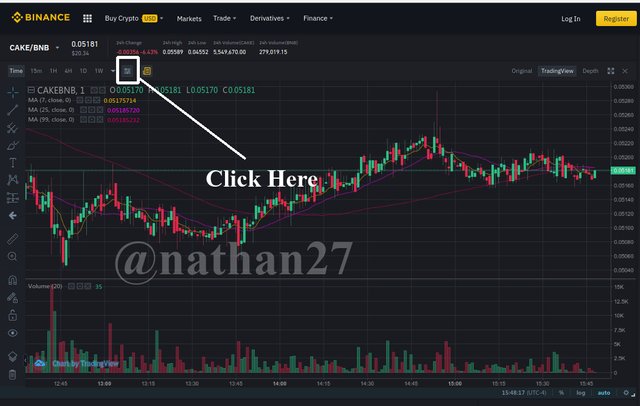
- Personally I use Binance to perform this type of reading since I can trade and it also has the advanced obtions that I need, in order to add the MACD indicator to the chart we have to follow the following steps in Binance.
1- Make a clip in tactical indicator.
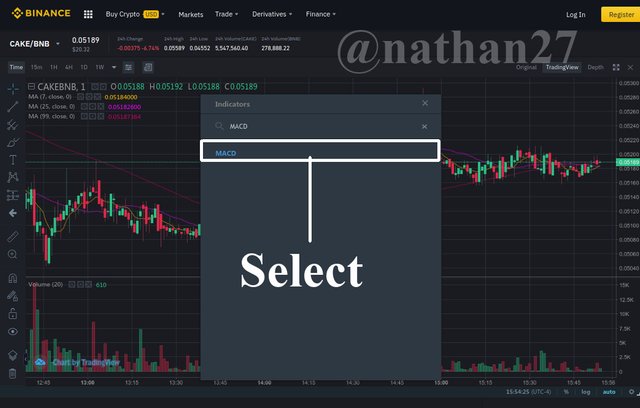
2- In the search engine Place MACD and then select it in the search list. just giving one clip is enough to add it. Be careful not to activate the clip several times since the indicator will open more than 1 time just by selecting it the first time, it is enough.
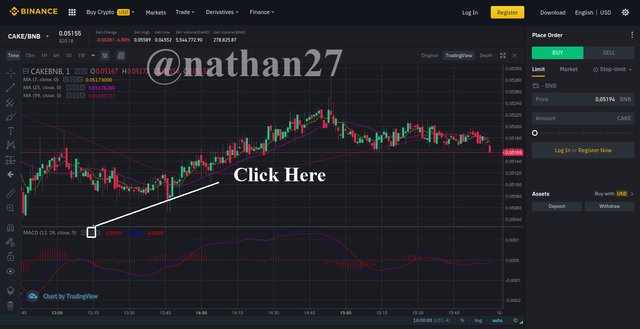
3- As we see in the lower part, the MACD indicator is already active to begin to carry out our analyzes
How to configure the MACD indicator
- On this occasion we are going to edit the indicator so that it adapts to our analysis and visual needs since I honestly do not like those colors that it has by default at all. To do this we need as a first step to clip the nut clip called Format. This is where we will apply both visual and technical settings.
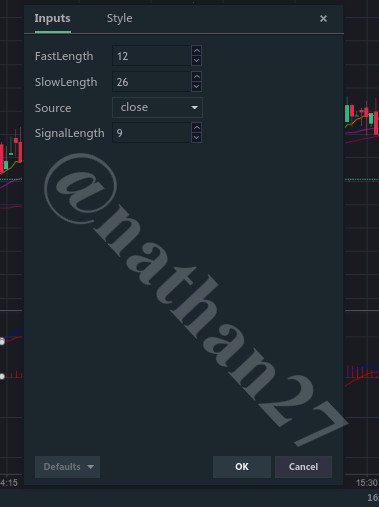
- In the data entry we are going to modify the following values that adapt to our strategy.
1- Fast Length: This refers to the Main line or the MACD line
2- Slow Length: This refers to the signal line that is also called the slow line. since it moves at a slower speed than the main line
3- In this area we will select the source of the signal, the most common to use in this section is the opening or closing source.
4- Singnal Length: Here is the default signal size, use 9
- Here we will configure everything that is the visual section for a correct observation of the lines, since by defects the colors are not very intuitive.
In this section we can modify the colors of each line and of the histogram, as well as select the elements that we can observe. It is precisely here where we can disable, for example, the histogram if we do not want to observe it, although personally it is more comfortable to have all the active callsigns since the analysis is done in conjunction with all the tools, of course there will always be someone who decides to work only with one tool.
How to use MACD to cross the MACD line and the signal line?
This MACD technical indicator shows us clear signals that can be seen with the naked eye, one of them is the crossing of the MACD or main moving average with the moving average called signal. When this crossing occurs, it is said that there is a change in trend since depending on the direction that these lines are heading, it can be said that there is a loss of market strength or what means that people stopped buying the asset in question, or that there is an increase in these forces, this increase translates to people buying.
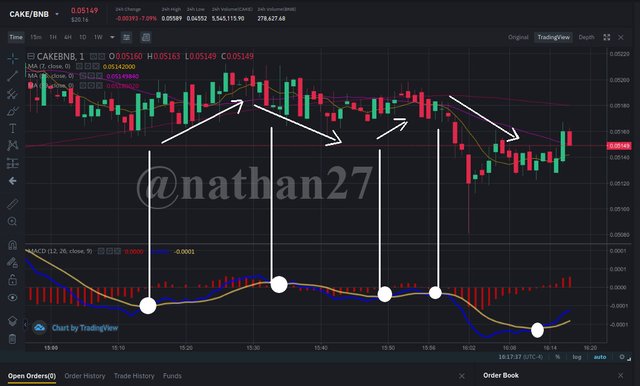
In the image above it is observed that as these two signals intersect, a change in trends occurs, and the price chart above confirms that this is indeed the case.
And how to use the MACD with the crossing of the zero line?
- This indicator focuses on the histogram and the force of sales or purchases that exist since when the MACD lines cross with the signal lines, it logically follows that the indicator must be at zero since it is at that moment when it is occurring a change in trend. Let's look at all of this with a graph.
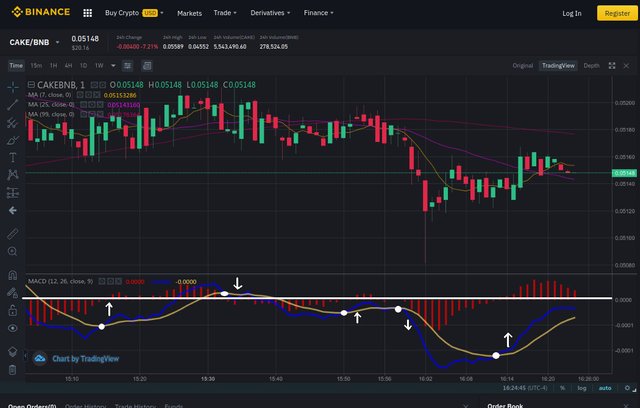
- In the previous graph we see how each time the signals cross the trend changes, and the sales forces in the histogram accompany these signals because if it is a downtrend and these signals cross the histogram shows how people begin to buy and shows in the oxilation of its bars how its indicators rise above zero, while if the strength of sales is lost and the upward trend changes to a downward trend, the histogram shows its bars below zero indicating that people are selling .
How to detect a trend using MACD?
This is easily visualized depending on the positions of the lines of the mobile measure markers since their position indicates the trends to understand this, let's explain each one of them.
- As we see the blue moving average represents the MACD average and is below the signal moving average, this is a clear indication that we are in the presence of a bearish trend. and the price chart does not check them.
- Bullish Trend: In this trend we observe the marker of the Mobile MACD average above the signal mark. Let's look at the graph.
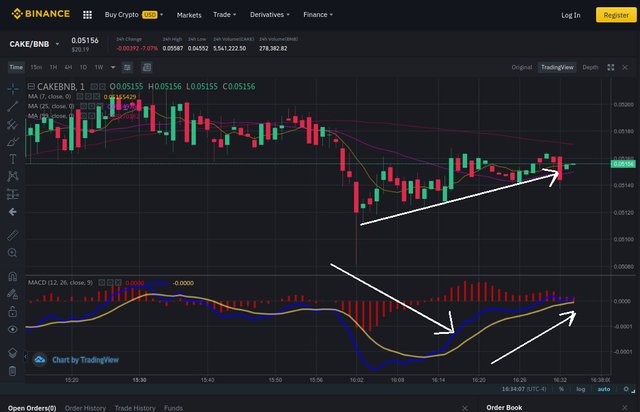
- As can be seen, the statement is correct since the MACD signal line is above the signal marker, and both in prices and in the MACD marking there is a clear upward trend.
And how to filter false signals? (Screenshot required)
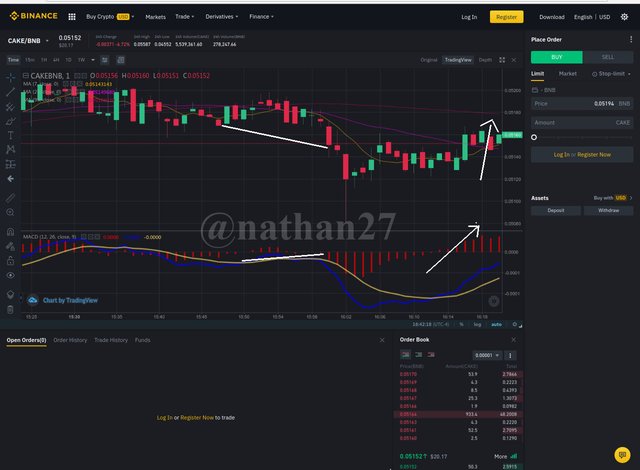
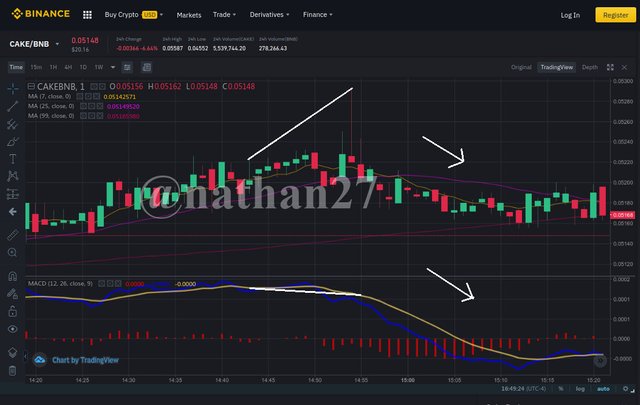
- There are signs that can confuse us which may indicate a wrong trend change, but there are ways to detect this type of trend change and it is through divergences, since as their word says there is a divergence between the trend of the prices and the trend of the MACD chart let us observe these divergences.
Bullish divergence.
Bearish Divergence.
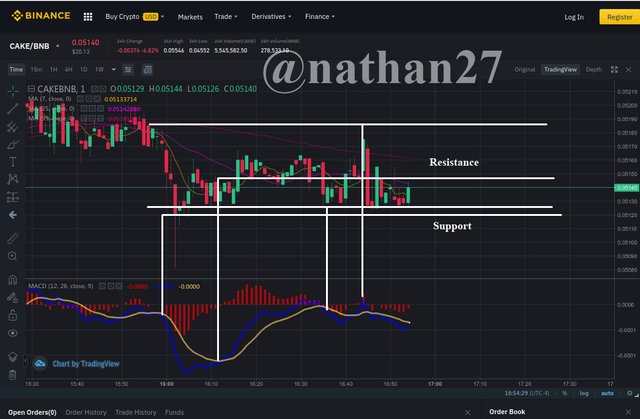
How can the MACD indicator be used to extract support and resistance points or levels on the chart? Use an example to explain the strategy. (Screenshot required)
- The way to obtain these points and levels of support and resistance on the chart is by observing the waves of the MACD signal since observing the maximums and minimum oxilations of these we can remove the major support and resistance lines and observing the crossing points of the lines give us information about the minor supports and resistance, let's look at a graph
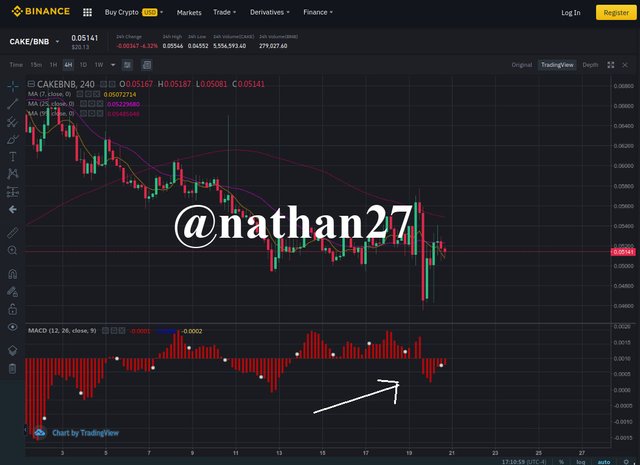
Check the chart of any pair and present the various MACD signals. (Screenshot required)
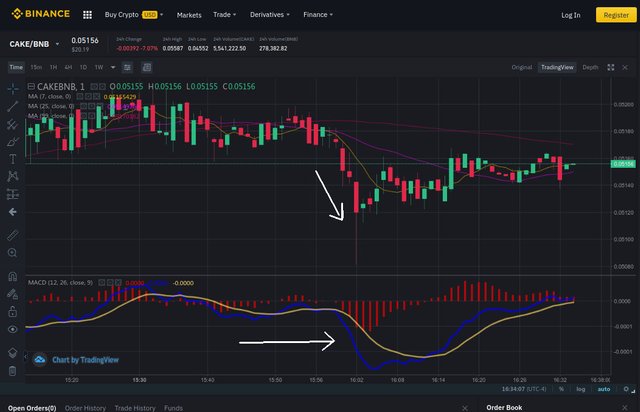
CAKE - BNB
The chart is set to 4 hours.
In the graph we show several intersections of the MACD line with the signal line and its various trend changes,
The price chart shows a downward trend but the MAC chart shows an upward trend which indicates that we are in the presence of a Bullish Divergence. which indicates that there will be a price increase and an increase in the purchasing power.
All this is confirmed right at the end of the chart since we observe another interception of the MACD lines and the moving average signal, which gives us to conclude that there is a change in trend from bearish to bullish and the price will rise in a few hours.
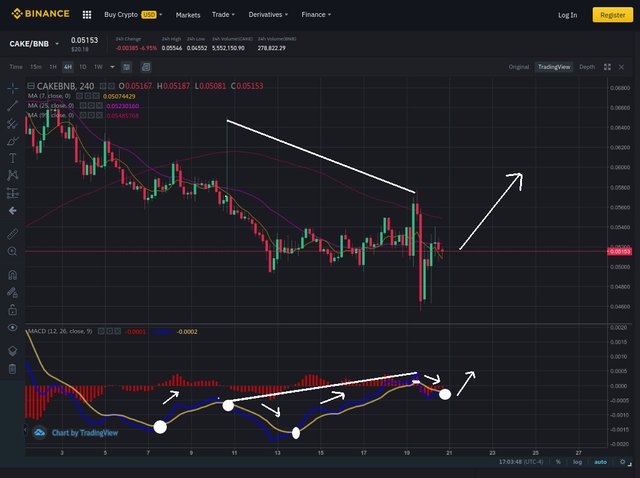
- To finish we see the histogam that shows that there has been a moderate sale, which may indicate that it has reached an oversold but moderate, although this indicator helps us a lot to observe these signals, it is better to rely on the RSI chart
Conclusion
CC:
@Kouba01


Hi @nathan27
Thanks for your participation in the Steemit Crypto Academy
Feedback
This is good content. Well done with your research study on the MACD trading indicator. Very well expressed in a clear and well-detailed format.
Homework task
8
Downvoting a post can decrease pending rewards and make it less visible. Common reasons:
Submit
Gracias profesor Saludos Desde Venezuela.
Downvoting a post can decrease pending rewards and make it less visible. Common reasons:
Submit