Today I will try to do the homework given by professor @reminiscence01. Alright let's try.
Explain the Japanese Candlestick Chart? (Chart screenshot required)
like the picture above I will try to explain the graph of one of the cryptocurrencies, namely Litecoin (LTC / USD). by taking the example of a candlestick chart. Previously we have studied a very interesting class from our professor, let's take a look at the graph above. in the chart above before we analyze we must know the basic concepts of candlesticks, namely, high, open, close, low.
reading candlestick charts is a reading of market activity carried out by sellers and buyers, so it can be said that we can predict the chart pattern when we want to change periods from bullish to bearish, and vice versa. There are other signs to make it easier for users to read the chart, such as the green chart body color indicating a bullish period, while the red chart body color indicates a bearish period.
I took the Litecoin chart based on the daily chart. so the chart is formed every day, so in analyzing the chart on May 29, 2021 the chart is in a bearish period (red candle body) so the opening price is above the closing price. while the highest price at that time was around $188 and did not last long while the low was around $157. and the market returns to normal when the price is on the body of the candle. and takes place on the next day on May 30, 2021 is in a bullish period (green candle body) so the opening price is below the closing price. the highest price at that time was $181 while the lowest price was around $154. and return to the normal price on the body of the candlestick. The body of this candlestick shows the price distance on that one day. This is all caused by the activities of sellers and buyers in the market.
so with candlestick charts if we understand the concept then it really helps us in trading because we not only see changes in the price fluctuations of a coin but we can predict the next price changes.
Describe any other two types of charts? (Screenshot required)
well I will try to explain 2 other types of charts besides candlesticks. as for I will explain about the Baseline Chart and Bars Chart.
- Baseline Charts
The baseline chart is the chart that is most easily understood by traders, because this chart provides very little information to be able to predict prices. This chart is only an interconnected line between the opening and closing prices, what distinguishes it from a line chart is that this chart has more information in the form of a middle line that can indicate when a trader should enter the market and exit the market the center line can be determined by a trader himself.
I think this graph is not suitable for technical analysis because the information provided is very lacking. Unlike candlestick charts which provide complete information so that a trader can predict the price accurately.
- Bars Chart
Bars Chart is a chart that is very similar to candlesticks because this chart provides almost the same information as the opening price, closing price, highest and lowest price, the only difference being the body of the chart. the body of the chart on the bars line is only a vertical line, while the candlestick is slightly fat.
but even though they have the same information, in my opinion candlesticks are the most suitable for trading because visually candlesticks are very easy to understand and very efficient for trading.
In your own words, explain why the Japanese Candlestick chart is mostly used by traders.
as we know there are many types of charts found on platforms or websites that are used to view and predict prices that will later be used for trading. I think Japanese candlesticks are very suitable for technical analysis. if we compare with other charts such as line charts do not provide complete information. or if we compare it with a bar chart, although it provides almost the same information as Japanese candlesticks, in appearance, Japanese candlesticks are superior.
Japanese candlestick charts are charts that provide information that is much needed by traders, by looking at these charts traders can certainly do careful planning. This chart also provides a view that is very easy for traders to understand, such as distinguishing colors between bullish and bearish periods or bull candles and bear candles so as to make the display more attractive and can distinguish them easily.
on the Japanese candlestick chart there is also very useful information for traders on each graph body such as open, close, low, and high prices so that traders can have enough information to determine what next steps are such as when to enter and when to exit the market.
so from a visual and graphic information this is a very complete graph. therefore traders really like to use this chart in technical analysis.
Describe a bullish candle and a bearish candle identifying its anatomy? (Screenshot is required)
Bullish Candle

edit from powerpoint
well I will try to explain the meaning of the description of the picture above and its location in the bullish trend:
- Open : this is the initial price in a certain period. in the bullish trend the open is below the closing price or under the body of candlestick
- Close : this is the closing price for a certain period. in the bullish trend the close is above the opening price or above the body of candlestick
- High : this shows the highest price in a certain time period
- Low : this shows the lowest price in a certain time period
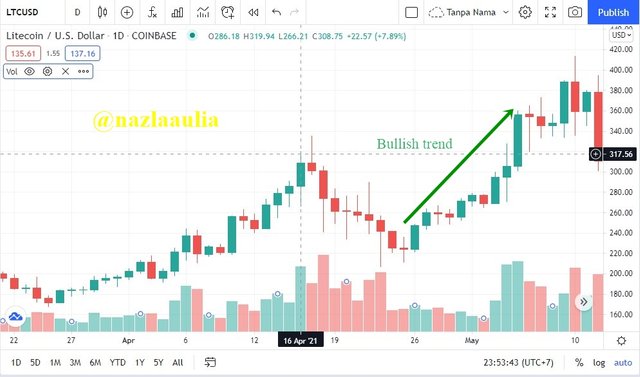
let's look at the bullish trend candlestick chart on the Litecoin chart:
From the description of the picture above, we can see that the bullish trend can be indicated by a graph that continues to increase upwards. or it can be said that the candlestick that has been marked in green appears repeatedly towards the top. so in the bullish trend there is an increase in the value of an asset.
Bearish Candle

edit from powerpoint
well I will try to explain the meaning of the description of the image above and its location in the bearish trend:
- Open : this is the initial price in a certain period. in a bearish trend, the open is above the closing price or is above the body of the candlestick
- Close : this is the closing price for a certain period. in the bearish trend, the close is below the opening price or under the body of the candlestick
- High : this shows the highest price in a certain time period
- Low : this shows the lowest price in a certain time period
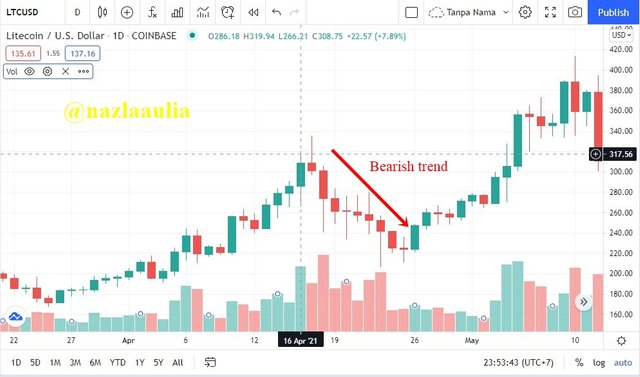
let's look at the bearish trend candlestick chart on the Litecoin chart:
From the description above, we can see that the bearish trend can be indicated by a graph that continues to decline downwards. or it can be said that the candlestick that has been marked in red appears repeatedly towards the bottom. so in a bearish trend there is a decline in the value of an asset.
Conclusion
Japanese candlestick charts are charts that are very suitable for traders to do technical analysis. Japanese candlestick charts provide very useful information before starting trading, not only that, Japanese candlestick charts also have a simple and easy-to-understand appearance for traders.
Thanks....
CC : @reminiscence01


Hello @nazlaaulia, I’m glad you participated in the 2nd week of the Beginner’s class at the Steemit Crypto Academy. Your grades in this task are as follows:
Observations:
That's correct. Candlestick chart displays the interaction and struggle between the buyers and the sellers.
Recommendation / Feedback:
Thank you for submitting your homework.
Downvoting a post can decrease pending rewards and make it less visible. Common reasons:
Submit
Thank you very much Professor.
Downvoting a post can decrease pending rewards and make it less visible. Common reasons:
Submit