Hello Everyone!!
I hope you are all well and I am going to start today's homework tax wishing you good health. I thank the professor @asaj so much for giving us the lesson of such a beautiful indicator. I have applied many types of indicators but I like Vortex indicator the most. Finding the buying and selling zone in trading is the most important task. Vortex indicator which makes it much easier. So let's start without exaggeration.

In your own words explain the vortex indicator and how it is calculated.
Vortex Indicator
The word indicator refers to indicating something. The vortex indicator is not the opposite, it helps us to understand the situation of any one crypto currency in the market. Let the matter be clarified through an example.

One of the two important points in the vortex Indicator +VI another one is -VI. Combination of the two elements give us valuable information. When uptrend VI+ cross above the downtrend VI- line its time to buy. On the other hand when we will find that VI- under the VI+ as well as trying to cross above VI+ that time refers buy signal. The color of these two trend lines has a rate of one and the other is blue. We can use any color if we want.
In short, The Vortex indicator is the indicator that consists of (VI+) and (VI-) and through which we can understand the market trend.
How To Calculate Vortex Indicator
If we want to calculate the vortex indicator, we have to look at a few things for example true range, parameter length, direction of the trend.
How to calculate the above issues given below.
First step
True Range or Actual range: Firstly, we have to subtrac from total lower value from the total available higher value. And then previous close will be substrated from current high and current low. After that we will get true range.
Actual value = Current available higher - Current available low.
Actual value = Current available high - Previous low.
Actual Value = Current available low - previous close.
Second step
Direction of the trendhere we will find out uptrend, and downtrend , when current high cross above current low it called uprend. On the other hand difference between current low and previous low refer downtrend.
Third step
Parameter length we can use any timeframe in vortex indicator. Accuracy is one of the main issues when it comes to timeframe. But I think good results can be obtained by reducing or increasing the time depending on its fluctuation. The timeframe should be reduced when there is less fluctuation and increasing the timeframe now when there is more fluctuation, good results can be expected. Over all 14 is valuable parameter length for vortex indicator. Or if it can be kept between 14 and 30 then good results output from here.

Is the vortex indicator reliable? Explain
I will tell you in my own word whether the Vortex Indicator is reliable from my trading experience so far. I do the fundamental analysis before trading and I give the most priority to technical analysis. The vortex indicator is part of a technical analysis. I tried to research the pros and cons about the indicator with my maximum effort. I would like to say from my trading experience that any type of indicator can give an idea about the market.
.png)
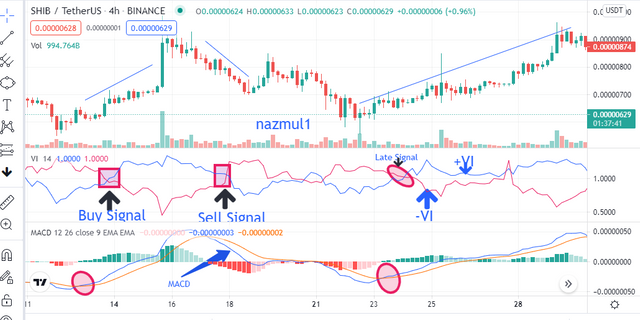
By looking at the uptrand and downtrend of any type of indicator we can just guess where its entry can be taken and where to exit from this market. I found a special similarity of the MACD indicator with the Vortex indicator. We analyze the market by looking at the cross of uptrend and downtrend lines in two indicators. I have gathered a different idea by comparing the two indicators. The buying and selling signal came in MACD before Vortex indicator. That is why I can say that vortex indicator less reliable than the MACD. Analyzing the chart of trading view, I saw that the buying and selling signal was correct. With so many examples, it is clear that yes, of course, the Vortex indicator is reliable if we use with MACD indicator. The combination of two indicators will give undoubtedly good results.

How is the vortex indicator added to a chart and what are the recommended parameters?
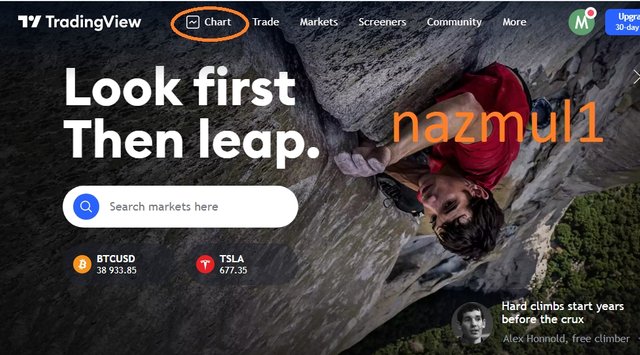
To answer this question, I will first visite the website of this trading view. Where we can very easily set up a vortex indicator to vote. First I will enter chart of this option.Then I will select a coin from here.
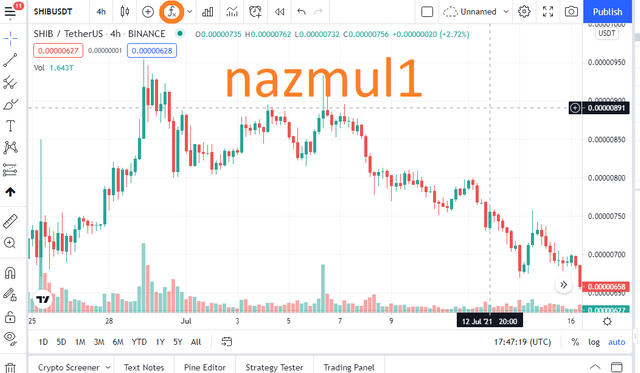
Secondly, I will click on the indicator option above.
.png)
Then I will go to the search option and search the vortex indicator. Then the indicator will be set.
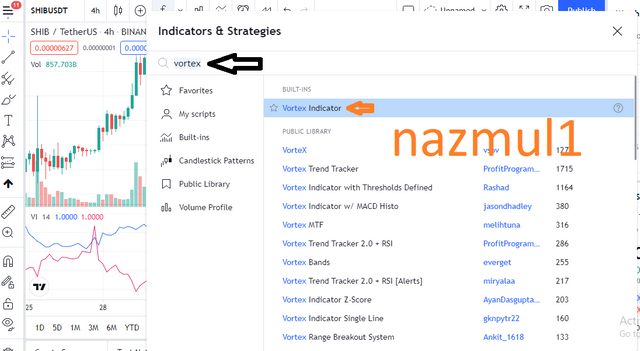.png)
Now I will set setting option which is need.
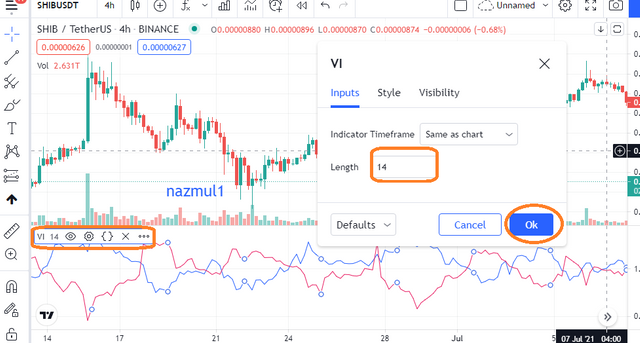.png)
Now go to the setting option of the indicator and change the color of the uptrend (+VI) and downtrend (-VI).
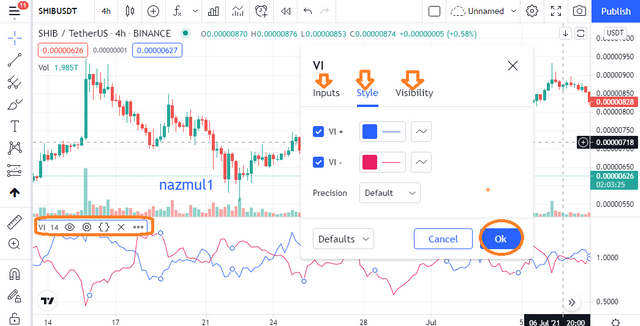.png)
as well as I will set up time frame. I will take the color as I like. I will make the uptrend (+VI) color green and the downtrend (-VI) color red. Then I will get desired result.
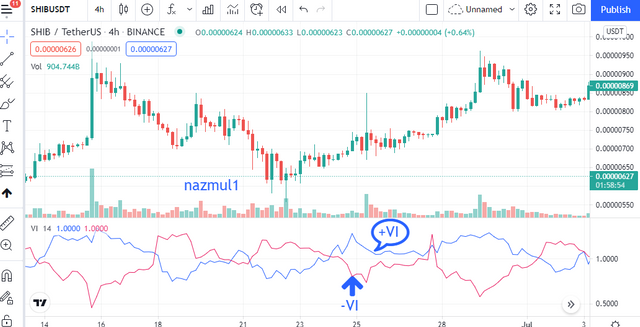.png)
Recommended Parameters
We can measure uptrend and downtrend the market with vote indicators in different timeframe. However, I think we can expect the best results in the Protect Indicator if the timeframe is set to 14 to 28. Because I got more accuracy in uptrend and downtrend during these timeframe. So we can use this periods.

Explain in your own words the concept of vortex indicator divergence with examples. (Screenshot required)
Vortex indicator consists of two lines one is uptrend (+VI) line and the other is downtrend (-VI) line. There is another indicator called MACD which also consists of two lines. I will combine the Vortex indicator with the MACD indicator and compare the divergence of the vortex indicator to you.
Bullish Divergece
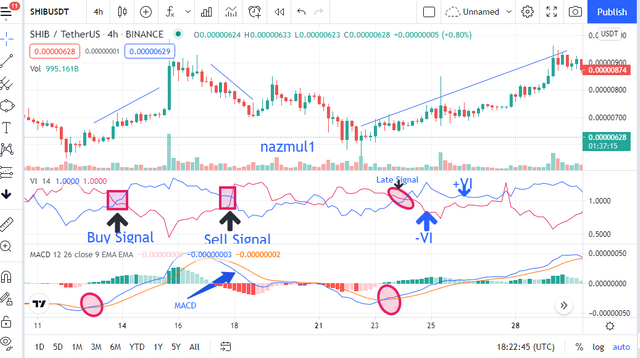
Here is a BTC chart where I have included both the MACD indicator and the Vortex indicator. The main feature of the two indicators is when one line crosses the other line up or down through it and the buying and selling single is found and through this the bullish and bearish situation is understood.
.png)
If we look very closely, we can see that two indicators have crossed in the marked part. The two indicators here are giving buying signals but the divergence between the two is that the MACD indicator gave the buying signal first and the vortex indicator later. With the period change in the Vortex indicator, its buying and selling signals tend to be a bit in that direction.
This divergence I have noticed very well in the bullish trend.
Bearish divergence
In bearish drivergence sense like bullish divergence, I have noticed that if you use two indicators, the result will be on the MACD indicator first and the signal on the vortex indicator will be a little late. In addition to using the Vortex indicator, you must expect good results if you use the MACD indicator.
Use the signals of VI to buy and sell any two cryptocurrencies.
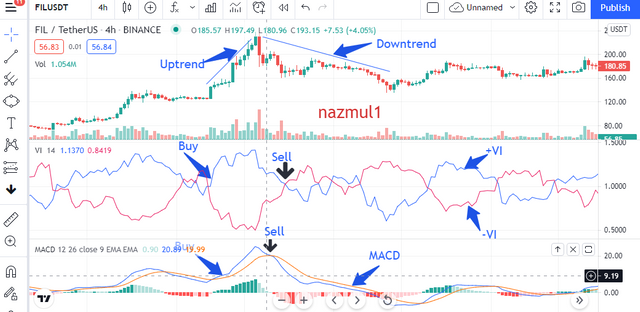
I want to use the first signal on the FIL coin and here I will show where to buy and where to sell.
.png)
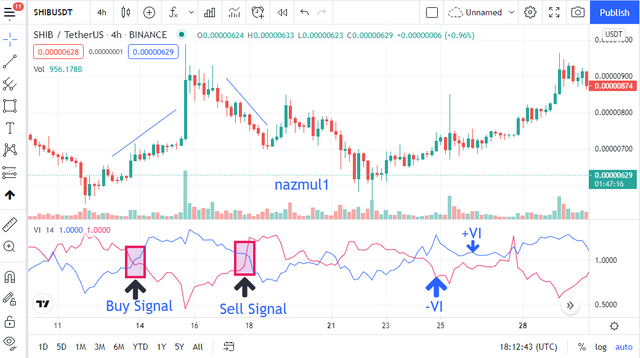
Secondly Now I will highlight the buying and selling position of the SHIB coin through vortex indicator.
.png)

Conclusion
This was a very important lesson for me. Because here I have learned what a vortex indicator is and how to calculate it. And here I have learned more about how to apply Vortex Indicator in tradingview.com. I have compared the indicators with the signals of other indicators and gained a good knowledge from there. This lesson is very enjoyable and instructive. Many thanks to Professor for sharing such an important point with us.

Best Regards
@nazmul1
Cc:
@asaj
Hi @nazmul1, thanks for performing the above task in the sixth week of Steemit Crypto Academy Season 3. The time and effort put into this work is appreciated. Hence, you have scored 6 out of 10. Here are the details:
Remarks
This work could use more depth and originality. Also, you did not provide a chart of bullish divergence and you did not perform the last task as suggested.
Downvoting a post can decrease pending rewards and make it less visible. Common reasons:
Submit
Thank you sir. Next time I will try my best
Downvoting a post can decrease pending rewards and make it less visible. Common reasons:
Submit