
1- Introduce Leverage Trading in your own words.

When we want to own a coin, we buy that coin through spot trade. And we can take profit from these coins when the market for these coins grows. There is not much risk in this because even if the price goes down for some reason if you do not sell here, you will not suffer any loss. When the price goes up, you can withdraw your profit from here. When you trade in this way, you can trade exactly as much as your capital.
But there is a difference in leverage trading. Here you can trade for more profit than your capital. I think leverage trading is a blessing to a professional trader and a curse to those new traders who have little idea about leverage trading. Only those who are skilled in technical analysis and have a good idea about the market can make a good profit here.
Simply, trading that can be done by borrowing money is called leverage trading. That means if you have $100 you can trade it for $1000 with 10x leverage here.

2- What are the benefits of Leverage Trading?

There are many benefits to Leverage Trading. Only those who have a good idea of the market can make a good profit. Let's see the benefits of leverage trading.
- I have said before that here you can trade with borrowed money. Only the benefits of leverage trading are available. This means that you can trade with more amount than your capital. You have $15. In the scenario, you can open trade $150 by 10X leverage.
- Here you can borrow capital so you can earn more profit in less time than Sports trade.
- Leverage trading is mostly used in scalp trading where traders open trade for short time.
- With less capital, a trader can trade on more than one asset through this leverage trading and a trader is being more profitable.

3- What are the disadvantages of Leverage Trading?

We have already learned about its advantages but it has some disadvantages which we will discuss now risk.
- Leverage traders must be skilled. If a trader trades leverage without acquiring skills, the fund will be at great risk. This means that it is very difficult to trade without skills.
- When a trader opens a trade and that trade goes against his idea, he has to face a big loss. There is also the possibility of losing the capital of a trader which can make one the proletariat.
- It is very risky and the fund of the trader can be liquidated.
- A trader faces a high trading fee for leverage trading. It is one of the big disadvantages of leverage trading.

4- What are the Basic Indicators that we can use for Leverage Trading? (Need brief details for any essential Indicators and their purposes)

I think where there is more risk there is more opportunity to profit. The crypto market is a volatile market and the price here is much more fluctuating. Here is an example of a skilled trader making huge profits like an incompetent trader losing funds. So you have to have a good idea about the market and have the skills to do market analysis. We use different indicators for market analysis. Today I will present to you some indicators used in leverage trading. So let's see those indicators.
Exponential Moving Average
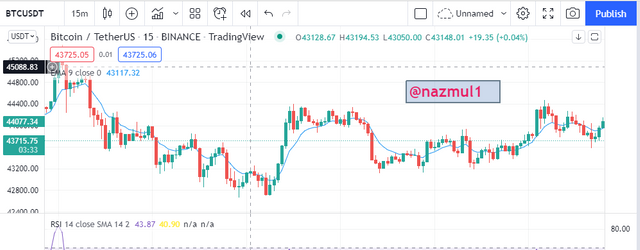
Determining trends is an important part of leverage trading. EMA is a basic indicator that is used for identifying trends for leverage trading. Let's find out how a trader can understand the market trend with the EMA indicator.
After adding the EMA indicator, if we look at the chart, we can see that when the candlestick pattern will be at the top and the EMA will be at the bottom so we can take this uptrend. Here, if a trader opens a buy position, he can benefit. On the other hand, when the candlestick pattern crosses the EMA and starts moving upwards, we can imagine it as a downtrend. In this situation, a trader's shoulder opens a sell position. Let's see a screenshot for a better understanding.
Ralative Strenght Index
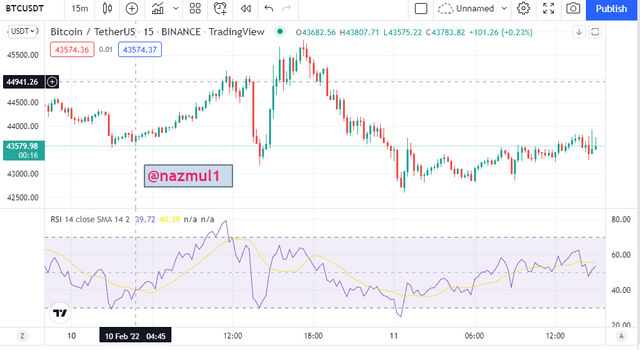
You are all aware of the RSI indicator. It is a widely used and very popular indicator. It plays an important role to identify trend reversal and from the idea of trend reversal a trader can make a good profit, as well as he or she can avoid losses. So let's take a look at how it works and its mechanisms and how we can use it in leverage trading.
RSI is a volume-based indicator and it depends on the volume. It is a well-known fact that the market has an important relationship with the volume and this is what a trader needs to know. It's default setting has two areas, one is 70 and the other is 30. When the RSI indicator crosses the seventy line that is above it, it is considered as overbought. We also count it as oversold when the indicator crosses the area given below 30 and goes downwards. When we can identify trend reversal through RSI then we can gain a good profit from that market. Lets see a screenshot below.
Parabolic SAR
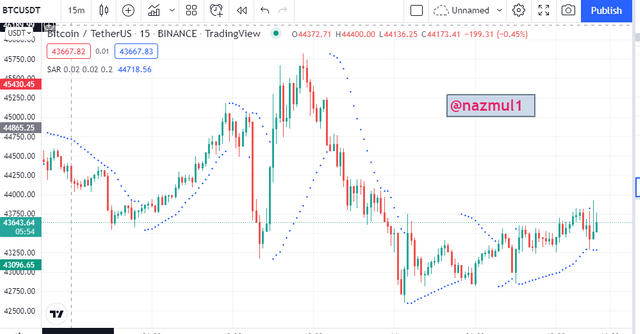
Now I am going to share another basic indicator to perform leverage trading. Parabolic SAR is an indicator that gives us information from the trend. We will see many dots when we add this indicator to the chart. Let's discuss how to identify the trend by using Parabolic SAR Indicator.
As I said before it is a trend-based indicator and it is made up of many dots. When these dots are above the chart, it gives a hint of our bearish trend. The bullish trend is just the opposite when the dots are at the bottom of the chart so we can think of it as a bullish trend. In leverage trading, a bullish trend gives us a profit when we will take buy entry. In bearish trend gives us a profit when we will take sell entry.

5- How to perform Leverage Trading using special trading strategies (Trading Practice using relevant indicators and strategies, Screenshots required)

Technical analysis plays a very important role in leverage trading. In the answer to the question, I will share a strategy for leverage trading by technical analysis. Firstly, to perform the answer I will change my chart and I will add Heiking Ashi Chart. The timeframe is also important here I will add which timeframe is suitable for my trading strategy. Let's see the screenshot below.
Buy Entry
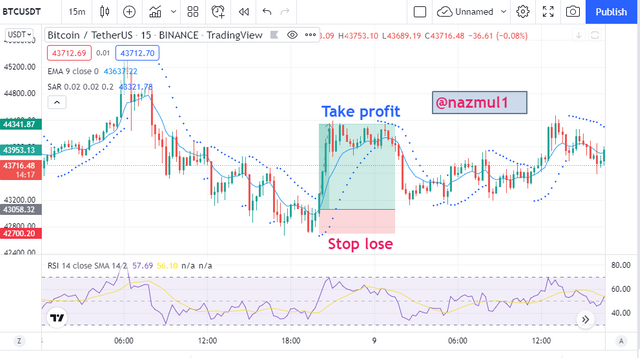
We need a suitable time and signal for a buy entry. I have added three indicators here, one is RSI and the other is EMA and the other is Parabolic SAR. Since I will take the buy entry, it must keep the chart above the EMA. And then I will notice the Parabolic SAR indicator. If the dots of parabolic indicator are below we can take buy entry and I will confirm the trend by RSI. I will take the buy entry if all the tools give me bullish.
Sell Entry
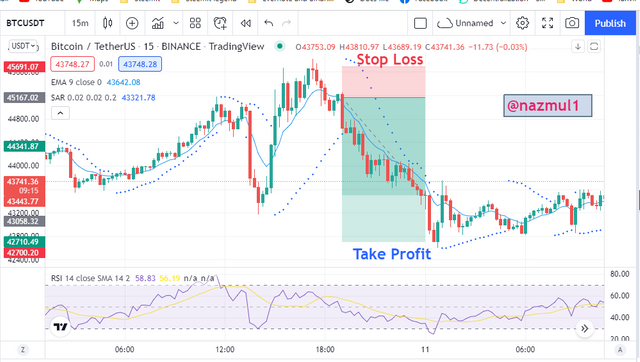
For the sell entry, I also set up three indicators so that our sell entry becomes accurate. I will take the sell entry when the dots will be located above the parabolic SAR. Secondly, I will see the EMA indicator. When the EMA is above any chart, it indicates the sell position. So I will notice if the candles in my candlestick pattern are above or below the EMA. If you can take it, I will keep an eye on RSI to see what kind of message it is giving us. After confirming the signal from each indicator, I will open the sell entry trade.

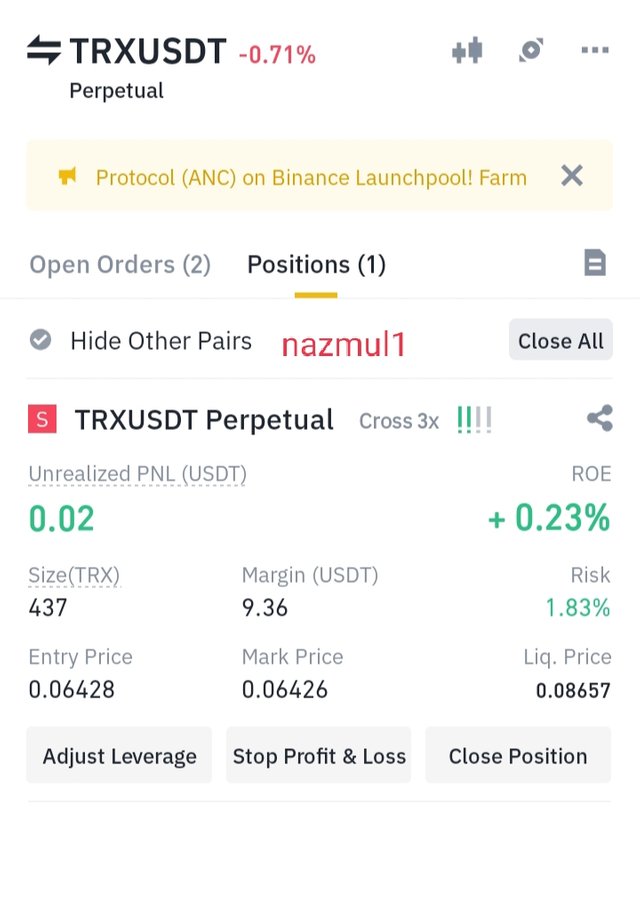
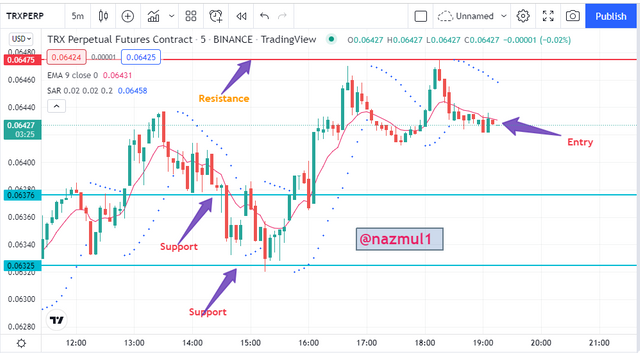
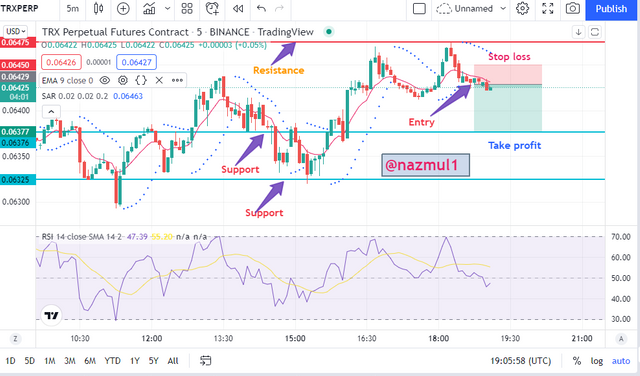
6- Do a better Technical Analysis considering the above-explained trading strategy and make a real buy long or sell short position at a suitable entry point in any desired exchange platform. Then close that buy or sell position after appearing trend reversal signal from the Parabolic SAR indicator. Here you can also close your Buy or Sell position using any other desired Trading Method in addition to the signal coming from the Parabolic SAR indicator. However, here you must prove that trading method as a reason for closing your position. (Usually, You should demonstrate all the relevant details including entry point, exit point, resistance lines, support lines, or any other trading pattern. Use at least 2X leverage and no more than 10X )

