QUESTIONS
+ ☆1》EXPLAIN THE JAPANESE CANDLESTICK CHART? (ORIGINAL SCREENSHOT REQUIRED)
+ ☆2》IN YOUR OWN WORDS, EXPLAIN WHY THE JAPANESE CANDLESTICK CHART IS THE MOST USED IN THE FINANCIAL MARKET
+ ☆3》DESCRIBE A BULLISH AND A BEARISH CANDLE. ALSO, EXPLAIN ITS ANATOMY. (ORIGINAL SCREENSHOT REQUIRED)
EXPLAIN THE JAPANESE CANDLESTICK CHART? (ORIGINAL SCREENSHOT REQUIRED)
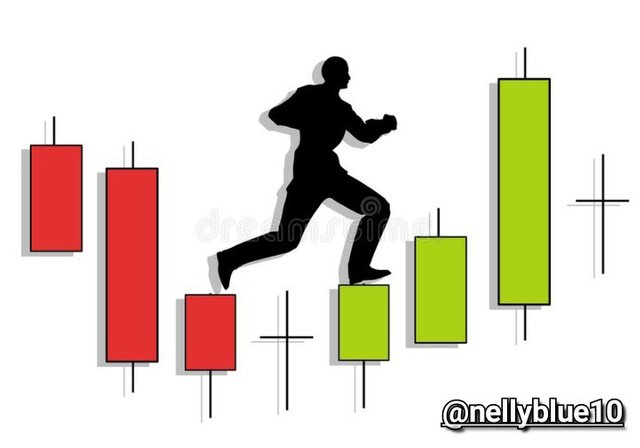
The Japanese candlestick which is likewise known as the Candlestick chart is like an apparatus or equipment which is been used by professional traders to perform technical analysis on a particular crypto asset, with the assistance of this Japanese candlestick chart this professional traders can accurately predict the crypto market price actions or the chart phycology. this useful equipment was innovated and identified by a man named Munehisa Homma,》Munehisa Homma is a rice trader who is based in Japan.
Munehisa Homma saw the necessity for this useful equipment as a useful resource for his market rate analysis and experiment.
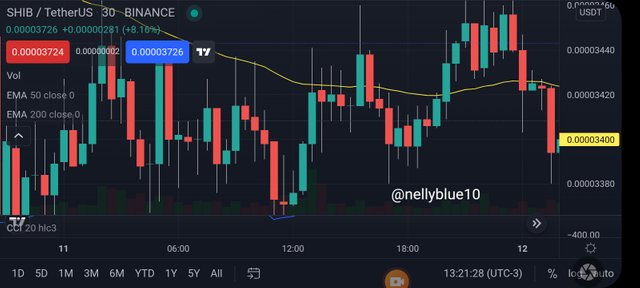
Nowadays, the crypto/ forex Trading procedure has been less difficult considering the good use of the candlestick charts, because it assists as a digital useful resource to traders according to the decision they made. Generally, this candlestick in every chart just as it implies 🕯️{candlestick} the candles appear in two colours which is green and red, these two colours Indicates either High or Low volatility that occurs within a cryptocurrency on a specific time frame.
- HERE IS A JAPANESE CANDLESTICK CHART[A SCREENSHOT OF MINE]
☆2》IN YOUR OWN WORDS, EXPLAIN WHY THE JAPANESE CANDLESTICK CHART IS THE MOST USED IN THE FINANCIAL MARKET
From my knowledge, The major reasons why this Japanese candlestick chart is normally used, It simply because it accurately offers the investors or traders the feasible and well-detailed cognition with the assist of the open》 low》close》high》 so with the assistance of the Japanese candlestick chart this investor can easily read or understand the crypto market price behaviour. These Candlestick charts also permit them to make suitable decisions and management in their investment to view the opportunities or the possibilities for exiting the market or entering the market to gain profit rather than losses.
The excellent part behind this Japanese candlestick chart in peculiarity of its awful sides, it cant be overemphasized due to the fact that it perfectly works in offering a complete data analysis along with its digital useful resources in every cryptocurrency or chart assessment like said earlier.
☆3》DESCRIBE A BULLISH AND A BEARISH CANDLE. ALSO, EXPLAIN ITS ANATOMY. (ORIGINAL SCREENSHOT REQUIRED)
BULLISH CANDLE
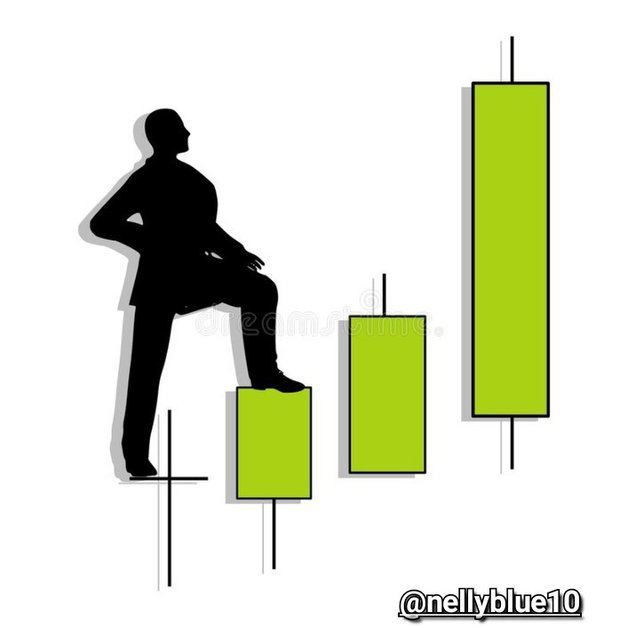
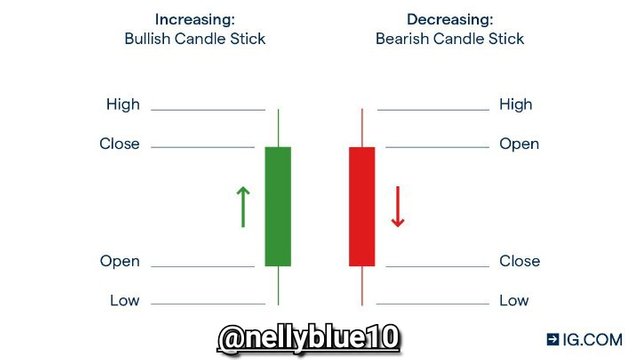
The Bullish candlesticks are normally noticed during an uptrend movement in every cryptocurrency market price. This Bullish Candlestick normally reveals itself after a downtrend movement of a specific coin, when it occurs, the signal of buyers taking control of the market price will intact kick-off, therefore, causing the assets to increase in price.
ANATOMY
This candlestick incorporates or contains four specific parts, and they are Open》 Close》 High》 Low》every one of them as their names imply, they illustrate the distinct point throughout price movements.
| PARTS | IN BULLISH / BEARISH CANDLES |
|---|---|
| OPEN | This parts clearly indicates the start-up price of any selected cryptocurrency. |
| CLOSE | This part simply indicates the ending price or rate of a selected cryptocurrency chart at a specific time frame. |
| HIGH | This parts simply indicates the highest or the greatest price of a specific cryptocurrency according to it time frame. |
| LOW | This part simply displays the lowest or the deepest price of any cryptocurrency according to its time frame. |
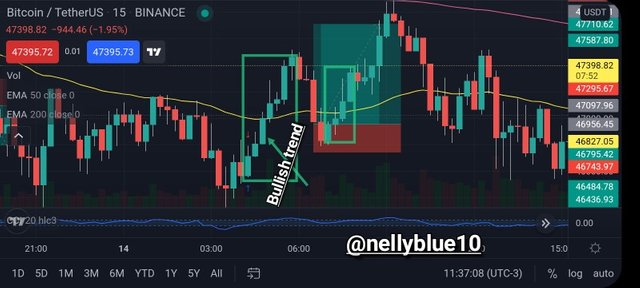
HERE IS A CLEAR EXAMPLE OF A BULLISH CANDLESTICKS
this screenshot down below shows an uptrend movement in Bicton/Tether [BTC/USDT], dough it has been trade already, but it went up as I predicted.
BEARISH CANDLE
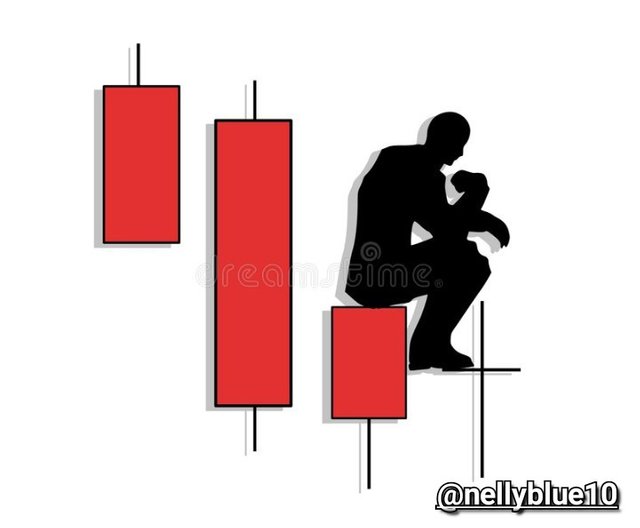
The Bearish candlesticks are normally noticed during downtrend movement in every cryptocurrency market price. This Bearish Candlestick normally reveals itself after an uptrend movement of a specific coin, when it occurs, the signal of sellers taking control of the market price will intact kick-off, therefore, causing the assets to decrease in price.
ANATOMY
In conformity with the opposite parts cited above, In these bearish candlesticks, a close occurs under the preceding openings while the last green candlesticks wash out withinside the bearish length,
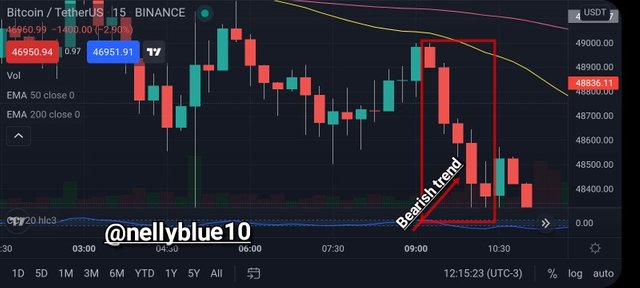
HERE IS A CLEAR EXAMPLE OF A BEARISH CANDLESTICKS
this screenshot down below shows a downtrend movement in Bicton/Tether [BTC/USDT], dough it has been trade already, but it went up as I predicted.
CONCLUSION :
The Japanese candlestick chart is been used by professor traders to perform clean trading strategies, helping them to monitor a specific asset price and all this was possible with the full assistance of the bullish and the bearish candlestick. thanks a lot, dear professor @reminiscence01.
