
Good day my good friends, hope we are all doing great. Great to have steemit crypto academy back for the season 4. I am writing on the homework task of @sapwood as he teaches on the topic On-chain Metrics.

What is a HODL wave, how do you calculate the age of a coin(BTC, LTC) in a UTXO accounting structure? How do you interpret a HODL wave in Bull cycles?
What is a HODL wave
A HODL wave is a wave that shows the last time bitcoin was moved to another wallet within a particular period of time. This wave helps us to determine the reactions of buyers and sellers in the market. Just like the acronym HODL implies, which refers to holding and asset over a long period of time, HODL wave is used to ascertain the quantity of an asset that have not been moved out of a wallet based on their unspent transaction output.
The length of time the crypto asset has stayed in a particular wallet without be transferred is referred to as the age of the coin and not when it is mined or founded.
The HODL wave makes use of 3 different colours to show the value or quantity of an asset that have not been transferred within a particulat period of time.
The colors which are set as default colors in the wave charts are
● Red, Yellow and Orange - These are referred to as warm colors an indication of transaction recently conducted in an asse or been moved to another wallet.
● Light yellow, Green and blue - They are referred to as cooler colours. These are an indication of no activity, movement or transaction conducted with regards to a particular asset.
So the HODL wave occurs when a large number of people hold their coins over a period of time. This holding of the coins leads to the short supply of the asset in the market thus creating demand. The longer they hold the coin, the longer the age of the coin as it stays unmoved in a particular wallet. At that point in time, there seem to be no movement or transaction with respect to that asset, no spikes, looks as if the coin is in accumulation stage.
How do you calculate the age of a coin(BTC, LTC) in a UTXO accounting structure?
Just like I mentioned earlier, the age of the coins refers to the time when a crypto asset is held in a particular wallet address without being transferred to another one. So it is calculated based on UTXO( Unspent Transaction Outputs) accounting principles.
The more the coins are held or unspent for so long in an address, the more the age band is created and is continually expanding thus forming the HODL wave. The age bands are represented by the HODL wave colours and continues changing from warmer colours to cooler colours as the Hodling of the coins continue without being transferred.
The age bands can range from 24 hrs to 10yrs. The 10 yrs age band is only applicable to BTC, since it is the only coin that have stayed up to that number of years and even more.
The screenshot below illustrates it further.
How do you interpret a HODL wave in Bull cycles?
I have mentioned earlier that age can span from the most recent age bands of about 24 hrs- 10yrs. In a bullish cycle, The more these coins continue to be in these wallets without being moved, the more the age expands or increases thus forming an older age band. This simply implies that the UTXO is very low. The percentage of the unmoved coins within a period is high. Because these coins are held for a longer period in these address and they gradually age into the next band, it will lead to scarcity of the coin in the market, supply will decrease, which translates into a serious demand for the coin or asset.
During this situation, the law of demand and supply applies, "the higher the demand the higher the price". Thus leading to a bullish rally for the coin as there are more money chasing the coins.
From the picture we used in the age question, we can see that at the light yellow level, there were less spikes indicating a gradual aging of the coins held in that zone or band to the next band. Thus from that next band, we did not see any spikes within the chart, implying that almost all the coin held in these wallets were not moved or transacted for those number of years. This led to the bullish rally experienced so far in bitcoin assets.

Consider the on-chain metrics-- Daily Active Addresses, Transaction Volume, NVT, Exchange Flow Balance & Supply on Exchanges as a percentage of Total Supply, etc, from any reliable source(Santiment, Coinmetrics, etc), and create a fundamental analysis model for any crypto[create a model for both short-term(up to 3 months) & long-term(more than a year) & compare] and determine the price trend (or correlate the data with the price trend)w.r.t. the on-chain metrics? Examples/Analysis/Screenshot?
Daily Active Addresses,
Every blockchain has its addresses. However the number of addresses which a blockchain have determines the viability and how active the blockchain is. So the bigger the number of unique addresses owned by various users within the blockchain, the more the usefulness or adoption rate of the network or asset.
So the daily active price is a reflection of active asset addresses in relation to the price movement of the asset. The more active addresses a token have, the more value or utility the token have. Thus we can see that the number of active addresses influences the price movement of an asset. Little wonder, so many icos, idos and airdrops are done by various crypto companies to ensure there are as many holders of their coin as possible.
Short term analysis -3 months
Now let us use the diagrams below to analyze.

source
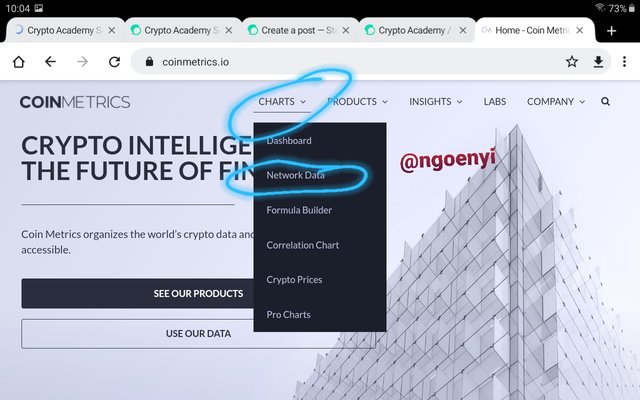
Log in with coinmetrics.io
source
Select chart = select network data = click on new chart layout name = type in your chart name.
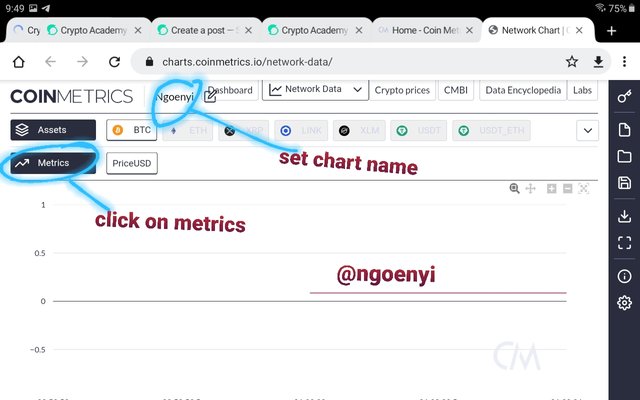
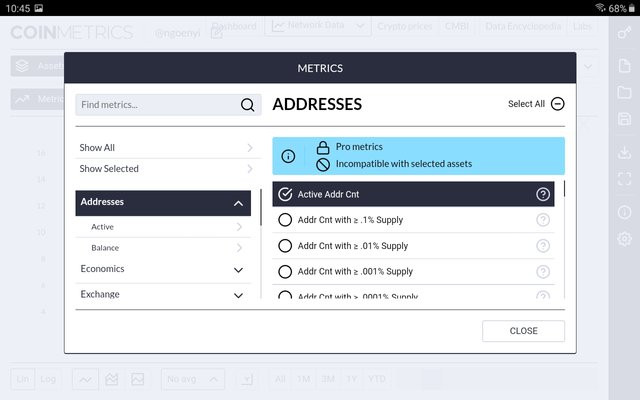
Then click on metrics, select addresses and then choose Active addr Cnt.
source
Then go below and select the time period and the type of chart you want.
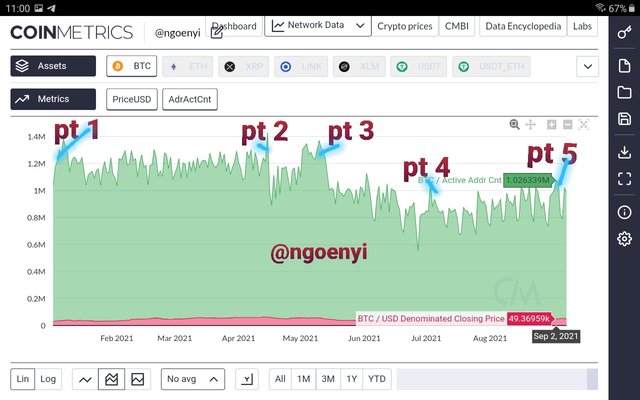
For a three month analysis, let us use the table below derived from the chart above.
| Points | date | no of addresses | btc price USD |
|---|---|---|---|
| P1 | Jan 6 | 1.344m | 36.643k |
| P2 | April 15 2021 | 1.36649m | 63.23k |
| P3 | may 10 2021 | 1.315m | 55.9k |
| P4 | July 3 2021 | 1.027m | 34.588k |
| P5 | Sept 2 2021 | 1.02633m | 49.3695k |
We can see that from Jan 6 2021 to April 15 2021, the number of active addresses increased tremendously as price of the asset also increased.
Also, from April 2021 down to July and Sept 2021, we also notice a sharp drop in the number of active addresses. This also correlated with the downward trend in price of asset within that particular period.
So from the 3 months analysis done, we can deduce that the number of active addresses is directly proportional to the price of the asset. Increase in active address = increase in price of an asset.
Long term analysis - 2 years
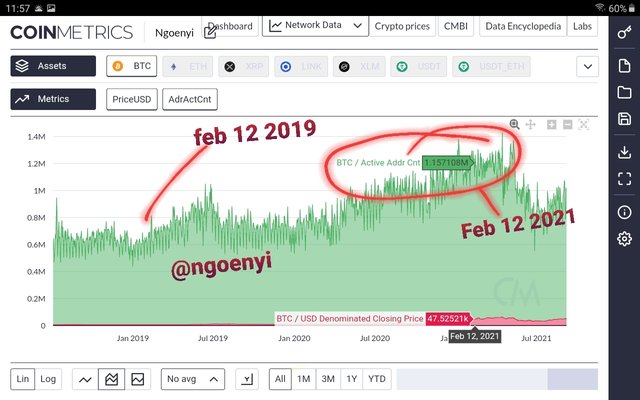
When analysing BTC on long term basis, we saw that on Feb 12, 2019, the number of active addresses was 809.914k while the price was at $3,587. However as at Feb 12, 2021 the active addresses became 1.157108m while the price of BTC was at $47.525k. There was a serious percentage increase in both the number of addresses and the price of Bitcoin.
So we can conclude therefore, that total active addresses is directly related to price movements.
NVT Ratio
NVT Ratio is calculated by dividing the daily market cap by the daily transaction volume of the asset. This is used to determine the usefulness of the asset.
So the higher the NVT ratio, the more over valued the asset is and the lower the NVT ratio the more undervalued it is. This can be used to know when a trend is about to reverse and possible market entry points.
So this indicator helps us to know the actual network value of an asset.
NVT ratio analysis on short term chart(3 months)
We already have our coinmetrics on, so we go back to it.
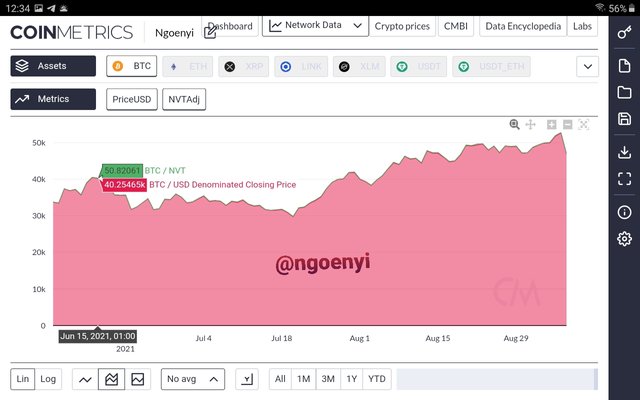
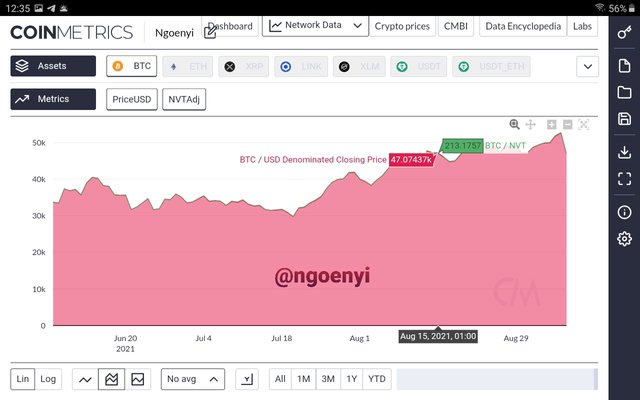
From chart 1, we see that on June 15, 2021, the price of BTC was $$40.25k and the NVT ratio was 50.820. However, after a 3 month period the NVT increased to 213.17 while also Bitcoin price increased to $47.07k. So this shows that the asset was undervalued as at June 2021, and now had its actual network value by August of the same year.
NVT ratio analysis on long term chart(2 years)
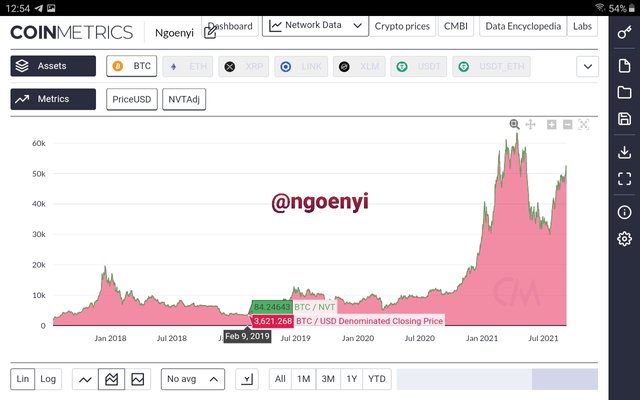
On a long term analysis, we saw a different analysis for Bitcoin. As at Feb 09, 2019, the NVT ratio was 84.246 while the price of Bitcoin was $3.621k.
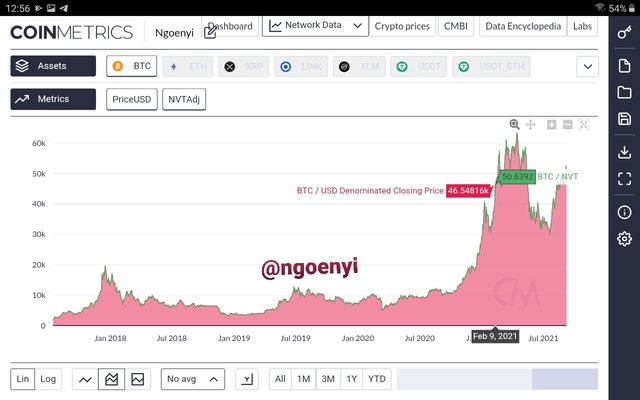
But at a corresponding time in 2021, the NVT ratio was 50.639 while the price of bitcoin became $46.5481k. The NVT decreased on a longterm basis owing to the volume of transaction on the blockchain. However, in this case, it would not imply that the coin is undervalued, rather, that the price to earning ratio of the coin has reduced. So for investors, it may not be the best asset to invest in, with respect to returns on investment.
So on a short term basis, the NVT ratio was increasing, signifying the asset to be a good one for investment on short term. But on long term basis it is not suitable for longterm investment. There may be other coins that have a better long term NVT ratio for long term investment.
Transaction Volume(usd)
Transaction volume(usd) on short term (3 months)
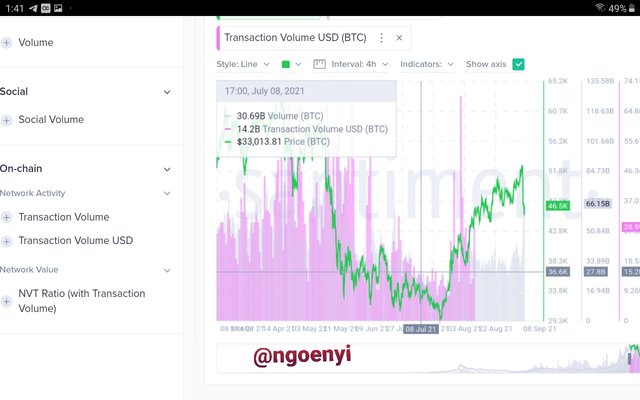
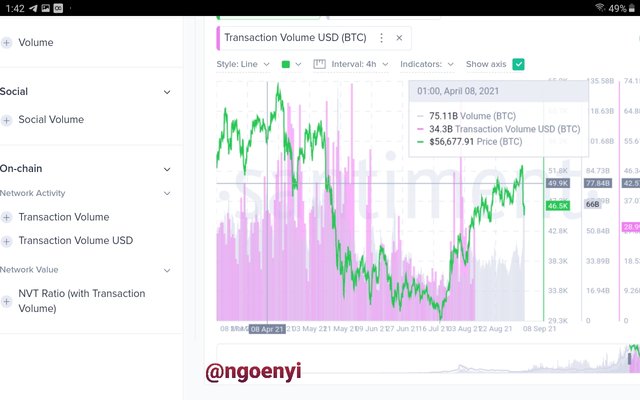
On a short term basis, on April 8 2021, the BTC price is $56.677k while the transaction volume is 34.3B while the BTC volume is 75.11B. On the other hand on July 8, three months after, the BTC price reduced to $33.013k, the transaction volume also reduced to 14.2B while the BTC volume decreased to 30.693B.
Transaction volume(usd) on Long term (1- 2 years)
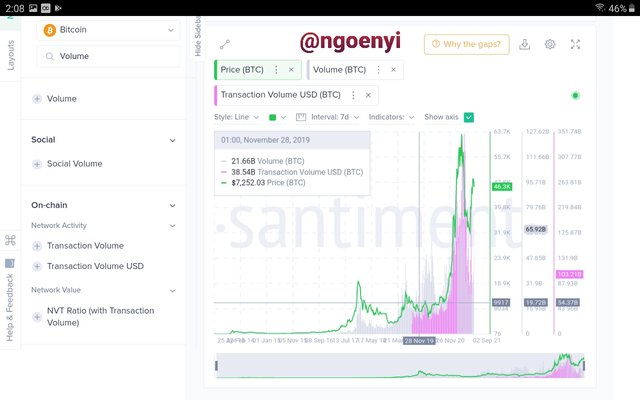
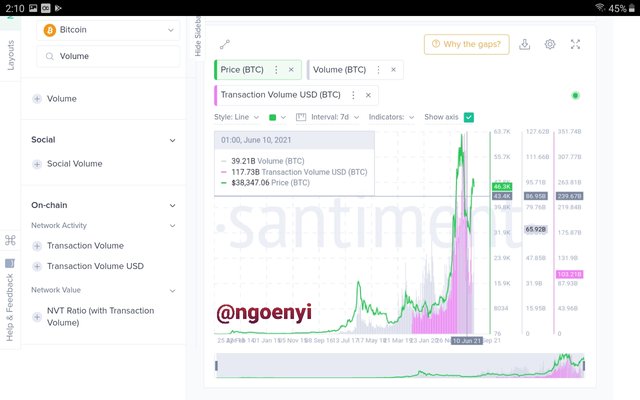
From chart 1 above, on Nov 28, 2019, the BTC VOL was 21.66B, the transaction volume was 38.54B and the price of BTC was # 7,252k. However, on June 10, 2021, BTC increased to 39.21B, the transaction volume increased to 117.73B while the price was at $38.347k.
The transaction volume is seen beside the charts above.
So from the explanation given, the transaction volume, transaction volume in usd, BTC volume increased as price increased. So volume have a direct correlation with price.
Exchange Flow Balance
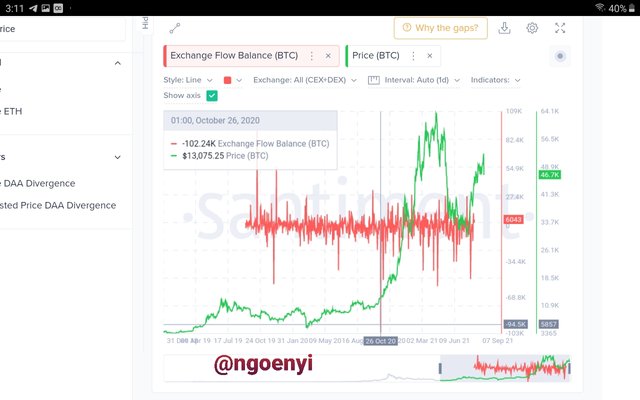
Exchange flow balance is an on-chain metric that calculates the values of coins or tokens that moves in and out of an exchange wallet at a particular point in time. When the value of coins that entered the wallet exchange is greater than the value that left the exchange wallet, the value will be positive. However, if the value of outflows from the exchange wallet is bigger than that of inflows, the value will be negative.
So when there are large movement of coins into exchange wallets, there is every possiblity of a bullish rally or vice versa.
Exchange Flow Balance on long term basis(2 years and above)
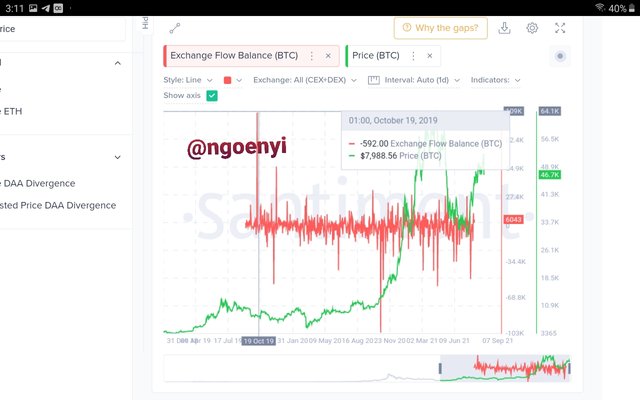
From the chart 1, we can see that as at October 6, 2019, when BTC price was $7,988.16k the value of exchange Flow Balance was -592. And on October 26, 2020, when Bitcoin price was $13,075.25, The Exchange flow balance was -102.24.
In both scenarios, the Exchange flow balance were all negative, indicative of the massive outflows from the exchange wallets to decentralized wallets. Apart from those two major spikes, it has traded within $23k to $42k price range.
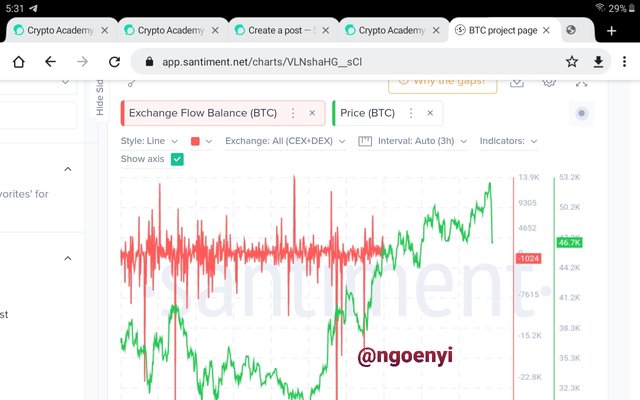
Exchange Flow Balance on short term ( 3 months)
From the above chart, on short term basis, there have been massive spikes down, which is indicative of massive withdrawals from exchange wallets. This happened with the period of june 2021 to early August 2021. This correlates to the massive dumpings we had within that period, the price went down as far as $25k. You can also notice that the exchange flow balance was also in negative.
Supply on Exchanges as a percentage of Total Supply
When there is supply or inflow of coins into exchange wallets, this increases the total supply of coins, thus affecting the value of the coins.
An increase in the supply on exchanges(% of total supply) leads to a decrease in price of an asset and vice versa. So the price is inversely proportional to the Supply on Exchange(% of total supply)
Supply on Exchanges as a percentage of Total Supply on short term basis.
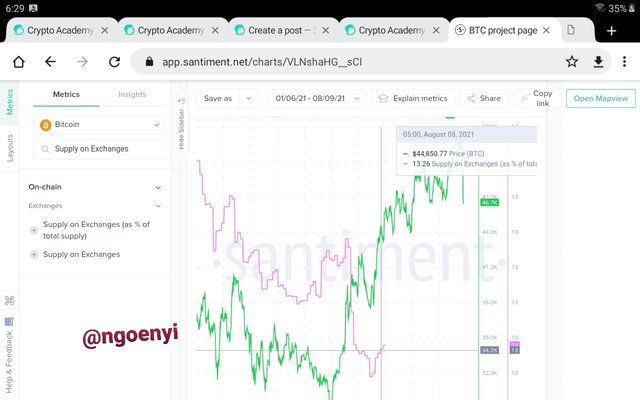
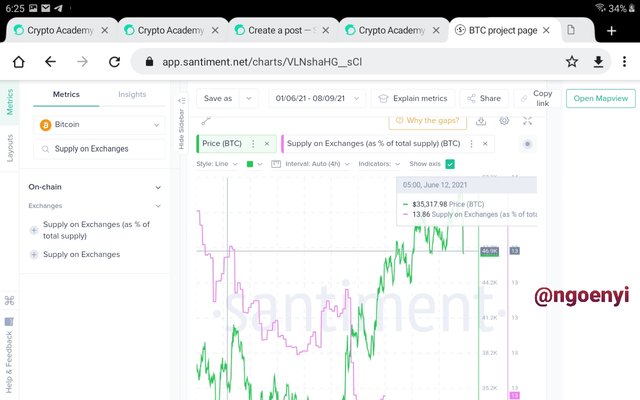
The above charts refers:
On the 12th of June 2021, the Supply on Exchanges(% of total supply) was 13.86% and the BTC price was $35.317.96. However on the 8th of August 2021, the Supply on Exchanges(% of total supply) was 13.26% while the price of Bitcoin was $44.850. So we can see in this short term analysis, an increase in one will lead to decrease of the other and vice versa.
Supply on Exchanges as a percentage of Total Supply on long term basis.( 2 years)
On the 19th of Sept, 2019, the Supply on Exchanges(% of total supply) was 14.30% while the price was at $10.266. Almost 2 years after on June 21st, 2021, the Supply on Exchanges(% of total supply) was 13.67 while the Bitcoin price was at $31.676.89.
This once more confirms that they are inversely related to each other.

Are the on-chain metrics that you have chosen helpful for short-term or medium-term or long term(or all)? Are they explicit w.r.t price action? What are its limitations? Examples/Screenshot?
A summary of the on-chain metrics analysed have shown that it could be used for more particularly long term investment purposes. Since most at times investors are looking for a more confident way of analyzing the market, on-chain metrics provides the answer. It works more clearly on long term basis. The long term analysis using on-chain metrics gives a clear signal on the direction of the market.
However, it does not produce clear signal when used for short term or medium term signal. As it provides unclear directions in the market.
Some of the on-chain metrics are directly correlated to the price of a coin while others are inversely correlated. So the usage of a particular on-chain metric is highly dependent on what the investor or trader wants to do. Additionally, we noticed that most of the on-chain metrics obeys the principles of the the law of demand and supply, eventually supporting the logical movement of prices.
On-chain analysis is an approach based majorly on the fundamentals of a coin rather than on sentiments, public opinion or technical analysis. It can be used to ascertain the historical trends of coins, comparing them together and identifying which one is overvalued or undervalued
Limitations
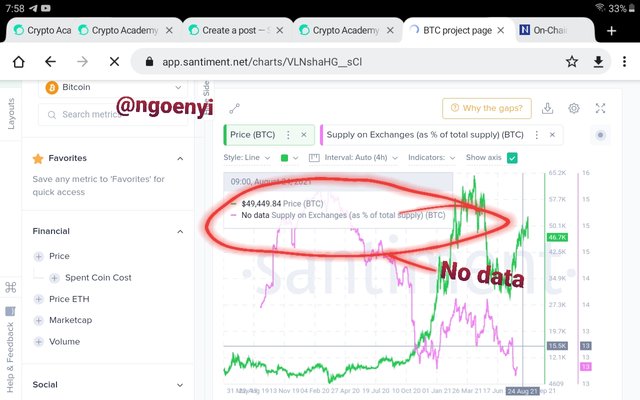
Despite the advantages of on-chain analysis, it does have its own backdrops. This form of analysis is still in its developmental stages, no wonder during the write up, no historical data was found or seen for years back, even for current periods.
source
No data for this.
Another major problem is that blockchains have different purposes and are not equal. Thus several interpretation can be made when a particular metric is used to conduct analysis on those coin that have these inequalities.
Like i have also explained before, this form of analysis can not be used by short term traders since its signals are only for long term market cycles.
Conclusion
It has been a great experience learning about another form of analysis, which could be used to analyze my coins, those that I am interested in to invest in and trade. Presently, not all coin can be analysed using on-chain analysis, but I am certain that in the future, further developments would be made to make it more proficient.
Great thanks once more to my honourable professor @sapwood for his wonderful lecture.
Hello my dear professor @sapwood, please come and grade my homework task
Downvoting a post can decrease pending rewards and make it less visible. Common reasons:
Submit