
We all know that the world of cryptocurrency is very volatile and also comes with the opportunity of making money.
There are various tools employed in order to predict the price of Bitcoin, on which the prices of most alt coins depend. Such predictions give them a better insight into the market and to trade when they will maximize their profit.
The hints will guide me as I explain these tools.
Explain in your own words the Stock to Flow Model, what is its function?
The stock to flow model is a tool used by Bitcoin analyst to determine the level of scarcity of Bitcoin and be able to predict its likely future price movement.
This tool was developed by an unnamed and unknown man. That is to say that he is faceless like Satoshi. He does not have an identity.
It determines the scarcity of Bitcoin by checking the supply of Bitcoin with current inflows of Bitcoin into the market over a period of time. Having gotten these data, it calculates the ratio of the circulating supply with the annual inflows.
This will now enable the user of this tool to know the level of Bitcoin scarcity and the potential price range.
Thus with this information, Investors will be able to make informed decisions as to the price at which they can invest in Bitcoin.
S2F ratio is calculated by using the current circulating supply and the total annual new supply of Bitcoin. You will now divide the circulating supply by annual newly issued supply of Bitcoin.
The result gotten gives us an insight to what we should do. So the higher the ratio implies that Bitcoin is becoming more scarce. Hence, following economic theory, the more scarce a product is, the more the price will increase.
This tool works best when it is used with the halving event, of which the rate at which BTC is supplied into the market can be fully determined. This 4 year reduction in the mining fee benefits of BTC leads to an increasing reduction in the supply of Bitcoin.
So the higher the stock to flow ratio. The higher is Bitcoin scarcity and probably the increase in its price due to its perceived value.
So the stock to flow charts is a representation of the relationship between scarcity and price.
There are other factors that can affect the result the stock to flow ratio tool gives apart from bitcoin halving.
These are :-
° Market demand of the token
° The level of adoption and awareness of the token.
° the prevailing market sentiment
° The effect of the regulatory structure on the token.
° General economic factors
° The level of technological developments surrounding the token.
° Then we also have some other external factors like security infractions, hackings and geopolitical activities.
What would be the advantages and disadvantages of the Stock to Flow Model?
The advantages are
it is very easy to use. Most people in the crypto space can easily know the circulating supply and the rate of new issuance. Thus making its calculation very easy.
It helps to create Intrinsic value for BTC. There is no one that can successfully determine the value of BTC since it is not used in production. Hence, with the S2F (stock to flow ratio tool), it provides an easy way of determining it's value just like gold.
It provides investors and traders with insight on when to invest so as to maximize their profit.
Since BTC price controls prices of other alts, it helps them to know the prevailing market sentiment.
° One of the disadvantages is that it does not put into consideration the effect of demand on BTC token. It uses circulating supply and rate of new token issuance on an annual basis.
Demand is key in every market and helps in playing out the dynamics of demand and supply. So S2F does not consider whether there will be any demand for BTC.
° S2F does not put into consideration any other extenuating circumstances that are very rare, unpredictable and unforeseeable situations which can lead to a crash in price of BTC. Things like DDOS attack, 51% attacks and even regulatory shutdown can affect BTC.
° In every market, there are people who are likely to sell with any little increase in price. This causes volatility and a lot of police fluctuations in the market. It can make the predictions of the S2F not to be true since it did not include this factor as it tries to predict price.
Make an analysis of the Stock to Flow graph, https://www.lookintobitcoin.com/charts/stock-to-flow-model.

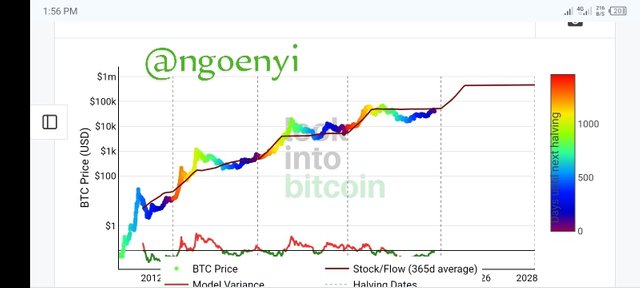
The above is an example of stock to flow Bitcoin chart. The stock to flow ratio is the brown colour single line, while the price of bitcoin are the dots that is above or below the stock to flow ratio line.
Going by my explanation of the S2F tool, we can deduce from the chart that it's prediction regarding Bitcoin price have almost been as predicted.
We also noticed that the S2F ratio line is always increasing or getting higher . This is because of the scarcity of Bitcoin caused by the halving events. That is why we will never see the line coming down. Thus with this chart, we can be able to know if not precisely, the future price of Bitcoin after halving which will be to close to $100k
The number of days before the halving are represented by the coloured dots which is matched to the vertical bar by the right to show the stage we are in before halving.
So going by that, the coloured dots following the S2F ratio line is dark blue. This indicates that we are just few tens of days before BTC halving.

We also have another tool added to the chart to show us the differences between actual price and the model's price (S2F PRICE). This is located at the bottom of the chart.
At any point in time when the actual price is higher than the S2F ratio price, the dotted lines being above the S2F ratio line, the tool turns red, but when the reverse is the case, it turns green.
So right now, from the interaction between price and the ratio line, we can see that soonest, the actual price represented by the dots will cross over the ratio line and upwards, more especially as we are close to BTC halving, the dips in prices we are experiencing now may be the last ones.
Can this model be applied to STEEM? Give reasons why this Stock to Flow graph model can or cannot be applied.
From a personal point of view, I don't think that it is possible to apply this to STEEM. There are several reasons why I say so.
° The consensus Mechanism used by BTC is different from that of Steem. BTC uses Proof of Work Consensus algorithm while Steem uses Delegated Proof of Stake.
° Their reward systems differs.
° The rate of block production between the two coins also varies
° Bitcoin is viewed as digital Gold and thus held in high esteem by investors. In fact in some areas, it is viewed as a blue chip investment
- the process, rate of mining and issuance of new token for steem is quite different from that of BTC.
° BTC's level of decentralization is much higher than that of steem. With this comes a model that ensures constant scarcity over time which the Steem coin does not have. This BTC halving can be said to be its credible monetary policy.
° It is difficult to ascertain the quantity of Steem coin that can be mined every day but this can be easily known in BTC
Conclusion
The S2F ratio can be used by investors and traders alike. Like we have noted, it helps them to know BTC's current status and the best time to invest in it.
Since BTC drags most altcoins with it, it can be used to discern market sentiment to an extent.
Thank you all for reading through. @starchris @sahmie and @steemdoctor1, please come and take part in this week's contest. Success in advance to you all!

This is my introductory post here

Thank you, friend!


I'm @steem.history, who is steem witness.
Thank you for witnessvoting for me.
please click it!
(Go to https://steemit.com/~witnesses and type fbslo at the bottom of the page)
The weight is reduced because of the lack of Voting Power. If you vote for me as a witness, you can get my little vote.
Downvoting a post can decrease pending rewards and make it less visible. Common reasons:
Submit
!upvote 40
💯⚜2️⃣0️⃣2️⃣4️⃣ Participate in the "Seven Network" Community2️⃣0️⃣2️⃣4️⃣ ⚜💯.
This post was manually selected to be voted on by "Seven Network Project". (Manual Curation of Steem Seven). Also your post was promoted on 🧵"X"🧵 by the account josluds
Downvoting a post can decrease pending rewards and make it less visible. Common reasons:
Submit
the post has been upvoted successfully! Remaining bandwidth: 160%
Downvoting a post can decrease pending rewards and make it less visible. Common reasons:
Submit
Your post has been rewarded by the Seven Team.
Support partner witnesses
We are the hope!
Downvoting a post can decrease pending rewards and make it less visible. Common reasons:
Submit
Thanks 🙏 ma'am for this break down.
As a trader, it's mandatory to analyze the market well which in turn helps to possibly predict the future movement.
The Stock to Flow model is undoubtedly a great tool for this job.
I love the clearer steps of how to work as you've provided, this pretty help determine the availability of commodity and the scarcity, supply of it.
Your advantages and disadvantages of the model given is so educational and I've so learn and understand alot from it.
Checking your analysis to the graph 📈 of questions 3, it so perfect and got my mind blowing.
All I can say is I've learned so much today
Good luck 🤞 ma'am on the challenge.
Downvoting a post can decrease pending rewards and make it less visible. Common reasons:
Submit
That's the idea of this engagement, for learning. I am glad that you have found my entry valuable. Hope to read your own entry soon. The more you carry out these assignments, the more you get to learn.
Thank you for your comment
Downvoting a post can decrease pending rewards and make it less visible. Common reasons:
Submit
Noted
Downvoting a post can decrease pending rewards and make it less visible. Common reasons:
Submit
TEAM 5
Congratulations! Your comment has been upvoted through steemcurator08.Downvoting a post can decrease pending rewards and make it less visible. Common reasons:
Submit
Greetings mam,
Thats really informative post I really love to read it you talk about the aspects of S2F in a great way. And also about your points on STEEM as you are the one of the old user of the STEEMIT os there are a lot of things to learn from you.
Downvoting a post can decrease pending rewards and make it less visible. Common reasons:
Submit
@ngoenyi Your detailed breakdown of the Stock to Flow Model is impressive ! I appreciate how you have explained its function advantages and limitations in such a clear and accessible way. The analysis of the S2F graph is on point and your insights on its applicability to STEEM are thought-provoking. Best of luck in the contest!
Downvoting a post can decrease pending rewards and make it less visible. Common reasons:
Submit
my X share
Downvoting a post can decrease pending rewards and make it less visible. Common reasons:
Submit
Your explanation of the stock-to-flow model provides a clear understanding of how analysts use it to assess Bitcoin scarcity and predict future price movements.
It's fascinating to see how this faceless model, much like Satoshi, calculates scarcity by considering the circulating supply and annual inflows of Bitcoin.
The concept of scarcity influencing price aligns with economic principles, making it a valuable tool for investors to make informed decisions. Thanks for breaking down the workings of the stock-to-flow model in a concise and informative manner.
Downvoting a post can decrease pending rewards and make it less visible. Common reasons:
Submit
Thank you. I am glad that this model exist and that with it, analysis can be made with certain level of accuracy. I appreciate your valuable comment
Downvoting a post can decrease pending rewards and make it less visible. Common reasons:
Submit
Weldon dear, you've written well
Downvoting a post can decrease pending rewards and make it less visible. Common reasons:
Submit
I'm truly blown away by the incredible depth and detail you put into your breakdown of the Stock-to-Flow Model. Your explanation of its function, advantages, and limitations was absolutely top-notch. You managed to make a complex concept so clear and accessible, which is no an easy feat. Your analysis of the S2F graph was incredibly accurate, and I found your insights on its applicability to STEEM to be truly thought-provoking.
It's evident that you've invested a lot of time and effort into studying and discussing the Stock-to-Flow Model, and your expertise shines through in your explanation. Your analytical skills and ability to grasp complex concepts are truly commendable. I have no doubt that your knowledge and insights will continue to propel you forward in your field.
On a more personal note, I hope that diving into the Stock-to-Flow Model and exploring its application in cryptocurrency has provided you with a first hand knowledge on how Scarcity works.
Keep up the incredible work, Your dedication and passion are inspiring. Wishing you continued success in all your endeavors.
Downvoting a post can decrease pending rewards and make it less visible. Common reasons:
Submit
@ngoenyi ma'm
There is no doubt that there are various tools used to predict bitcoin, most of the altcoins depend on them, thus the predictions help them gain insight into trading in the market. The v-flow model is a rule that determines the scarcity of Bitcoin, which was developed by a rare person and nobody knows about it. It was discovered in 2019, but whoever traded it from 2009 to 2020. All of his predictions have come true and if others talk about it, you have promised us about his tools. The main reason is that this tool is developed only for Bitcoin. Other you post is admirable and I pray you always win this contest because of the different title given in it. He has explained us all his topics in a very clear way and best wishes for the competition God Hafiz.
Downvoting a post can decrease pending rewards and make it less visible. Common reasons:
Submit
Hello my dear friend you are post is always being inspiration to read so simple and easy to understand so when ever I see your post I get in a motivation to see your post and the one you are talking about the advantages and disadvantages and I think you are absolutely right that it is very simple and easy to use but there are a lot of draw back of it and when you have talk about implification of it as steem I must agree with you that you are right the production rate is entirely different between these two and you have right really good post have best of luck
Downvoting a post can decrease pending rewards and make it less visible. Common reasons:
Submit
Hello dear friend greetings to you, Hope you are having good days there.
You said that this, stock to flow model is a technical tool we use Bitcoin analysis . Many analyst use it to determine the level of scarcity of Bitcoin and be able to predict its likely future price movement.
It works by determining the scarcity of Bitcoin by checking it's supply of Bitcoin with current inflows of Bitcoin into the market over a period of time. Using that data we can predict BTC future price.
The best post dear, best wishes for the contest.
Downvoting a post can decrease pending rewards and make it less visible. Common reasons:
Submit
Ciertamente el nivel de escasez es algo que se puede medir en BTC por tener un stock conocido u oferta limitada y un flujo o suministro fijo. Esto permite aplicar el modelo de S2F para el cual fue diseñado y dependiente exclusivamente de la escasez.
Estoy de acuerdo en que esta escasez se aprovecha mejor en el halving de BTC y cada vez que ocurre en 4 años afecta el precio controlando la inflación y estabilizando la oferta.
Comparto tu opinión de que este modelo no puede aplicarse a STEEM por tener diferencias relevantes con el BTC como el mecanismo de consenso, sistema de recompensa, tasa de producción no es fija, no es una reserva de valor, el nivel de descentralización menor, no tiene mecanismo de reducción a la mitad, etc.
Hiciste muy interesante el contenido con explicaciones fáciles de entender.
¡Saludos y éxitos!
Downvoting a post can decrease pending rewards and make it less visible. Common reasons:
Submit
Hey boss
It gives me so much pleasure and honor whenever I see you article on steemit, I've been an inspiration to so many content creators on steem blockchain. Mama thanks for inviting me but you spelt my name wrongly that's why I didn't see it.
Thanks for sharing l, wishing you success please engage on my entry too https://steemit.com/hive-108451/@starrchris/eng-esp-steemit-crypto-academy-contest-s15w2-stock-to-flow-model-or-or-modelo-stock-to-flow
Downvoting a post can decrease pending rewards and make it less visible. Common reasons:
Submit