INTRODUCTION
What Is A SuperTrend Indicator?
This is that indicator that helps one to still take a sell or buy when the market price has crossed the levels where you are supposed to take a trade either buy or sale. Ordinarily ,it is not advised to enter a trade in a running market. But does that mean that one has missed out entirely? In this situation, supper trend will come in to help us still take a trade despite the fact that the market is in a running trend. supertrend can show one the current trend direction.
It is true that in all indicators, there is no 100% accuracy, most of them can be misleading. in supertrend, it also not 100% accurate but it can give near accurate indication if one patiently follows it.
suppertrend employs ATR ( Average true range) in its calculation which considers the volatility of the market and it is adjusted using the multiplier setting which helps to determine the sensitivity of the indicator. this is the reason why if one understand how supertrend works, he can always rely on it in a trending market.
Show how to set SuperTrend on Chart and what are its settings need to configure.(Screenshot Needed)
Just as I have discussed above, supertrend indicator uses ATR in its calculations. Supertrend is calculated using 2 parameters which are period and multiplier. The default setting for the values used while constructing a superindicator are 10 ATR or period and 3 for multiplier.
The ATR indicator is what shows the level of price volatility. the degree of price volatility
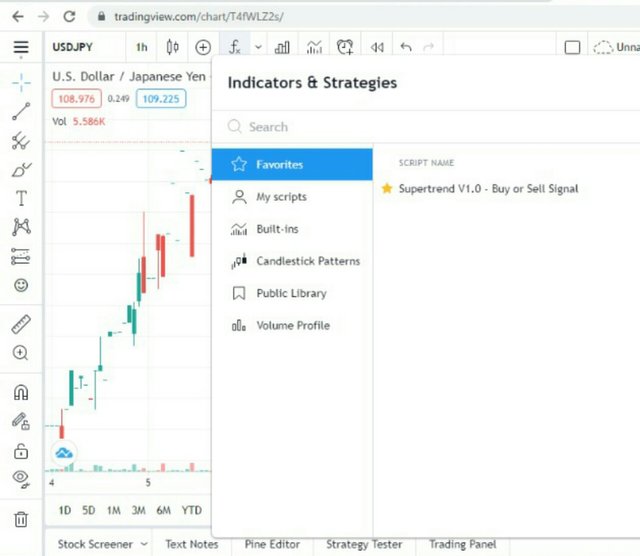
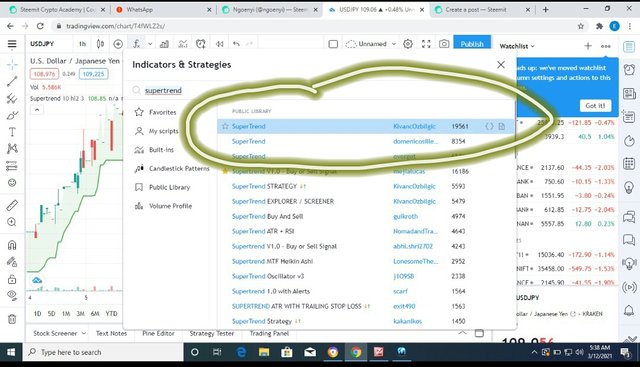
To set supertrend indicator to your chartview, you will need to go to the go to the trading page, then go to indicators and strategies, when it opens, type supertrend and choose from the options displayed.
USD/JPY chartview indicators and strategies

USD/JPY chartview showing where to type in supertrend
USD/JPY chartview indicating the supertrend to be chosen
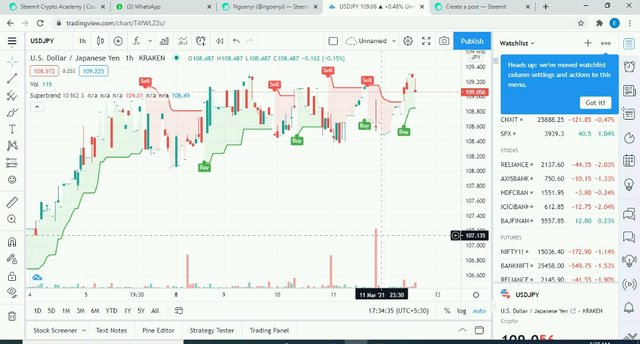
Once you select that, it will appear on your chart as in below
This is when the supertrend is selected, you can already see it indicating buy and sale
.
How SuperTrend Shows Buy-Sell Indications? (Screenshot Needed)
You can notice the buy in a downtrend indicator when it closes above the price while a sale is noticed when it closes below the current price .
This is USD/JPY 1 hour candle chart with supertrend that shows buy and sale indications

The red circles show points where one can take a sale while the green circles show buy indications
When We can place a Buy Trade with the help of SuperTrend Indicator? (Screenshot Needed)
This is USD/JPY 1 hour candle chart with supertrend
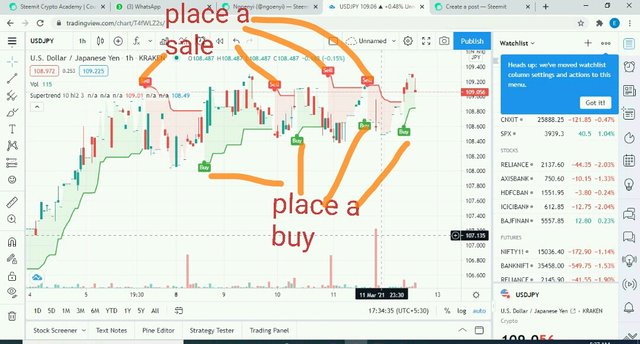
From the screenshot above, you can see the areas clearly marked for buy and sale. Those are where one can place trades in a supertrend indicator
When we can place exit/square off, sell order with the help of SuperTrend Indicator? (Screenshot Needed)
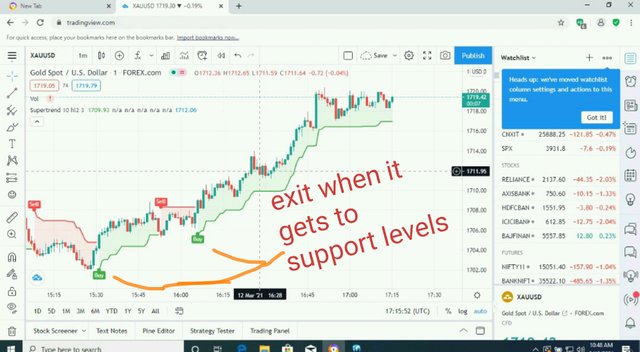
We can place exit or square off, sell order with the help of supertrend indicator when the price gets to the support line as shown in the screenshot below
XAUUSD chartview in a one minute time frame with supertrend indicating when to square off trade
How false indications look in SuperTrend Indicator? (Screenshot Needed)
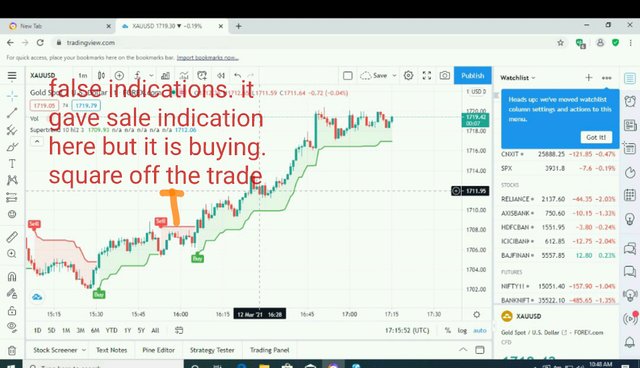
Exactly what you see on the screenshot below is how false indications look. As if it will sale but suddenly starts buying.
XAUUSD chartview in a one minute time frame with supertrend indicating how false indications look
According to your view what Stoploss you will suggest?
From my own view and as a beginner with small equity, I will suggest that I put my stop-loss in the second support level in a sale trend and then in a Buy trend, I will put my stop loss in the second resistance level.
Conclusion
From the above write up, i have been able to explain what supertrend indicator means, how to set it up in a chart view, how it indicates a Buy and a sale, when to buy and sale, when to place exist and when it shows false indications. Thank you all for going through. @steemitblog and @stream4u, here is my homework task submission.
CO: @steemcurator01
Cc : @steemcurator02
Cc : @steemitblog
Cc : @stream4u
This is my introductorypost here
my twitter link to this task
Downvoting a post can decrease pending rewards and make it less visible. Common reasons:
Submit