A lovely day to you all my friends. Great to be with you all once and thanks to steemit for another week of crypto academy.
I am writing on the homework task of @fredquantum who taught us on the topic Trading Crypto using Aroon Indicator

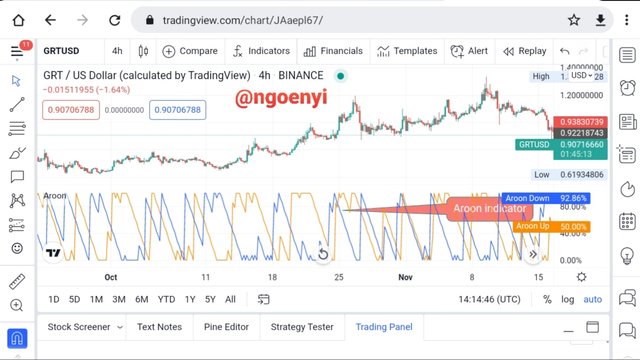
Explain Aroon Indicator in your own words? What are Aroon-Up and Aroon-Down? (Show them on Chart).
Aroon Indicator
The Aroon indicator is one of the famous indicators used for trading all over the world. It was developed by renowned man known as Tushar Chande. It helps traders to ascertain if price is in either upward trend or downward trend or if it is ranging.
With the help of this indicator, a new trend can be discerned right from the start and the ranges of various trends can be known.
It helps a trader to study and understands the price behaviour of an asset over a period of time, equipping him with necessary information on when to enter or exit a particular trade.
It is worthy of note that the strength of a trend is measured between the ranges of 0 to 100.
So the Aroon Indicator monitors price momentum considering the lows and highs and how far price have moved in relation to prices in the past.
Two pointers are used to read and understand this Aroon indicator. They are the AroonDown and AroonUp indicators which are used together and called Aroon indicator.
Most Aroon Indicator always have a default period of 14. When you use a lower period, the indicator generate more waves and various false signals while when a longer period is used, it smoothens out the various signal and generate a more accurate and reliable wave.
Some of the Aroon indicators have only a single oscillating line that picks out trends and measures it on a scale of 100 to -100.
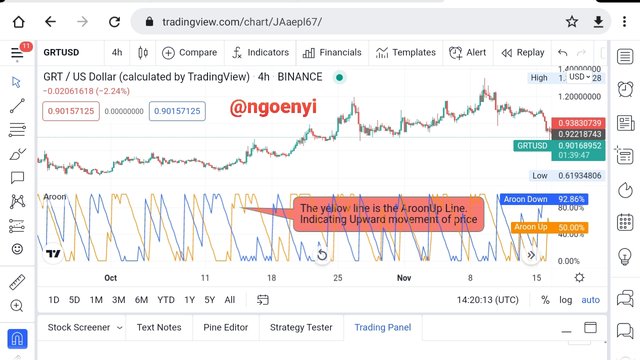
AroonUp
AroonUp pointer help us know the length of time that an asset have recorded a new high within a specific period of time. When the most current bar is the highest in price with the defined specific period before it, the value of the AroonUp will be 100. Being at 100 implies that it is the new high within that period and that the upward trend is still very strong.
So it measures the strength of the upward price movement of the asset on the scale of 0 to 100.
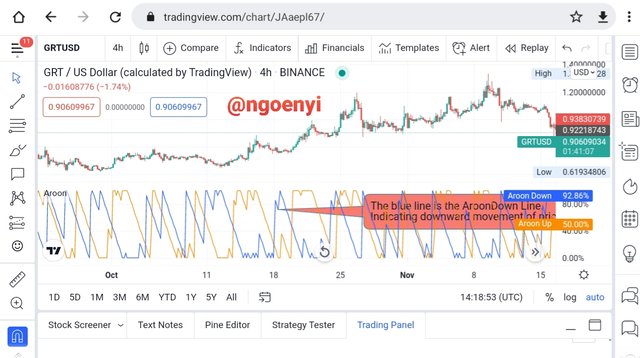
AroonDown
This measures the strength of the downward movement of price of an asset on the scale of 0 to 100. The higher the value, the stronger the downward trend. So in effect, it measures the strength of a downtrend.

How is Aroon-Up/Aroon-Down calculated? (Give an illustrative example).
● We calculate AroonUp by determining how many periods since the last specific period high. Then subtract this from the specified period, divide the result by the specified period and multiply the answer by 100.
We also calculate the AroonDown by finding out the number of periods it took since the last specified period low, then subtract it from the specified period. Divide the answer by 25. Finally multiply the answer by 100.
● Then subtract the value of AroonDown from AroonUp to arrive at the Oscillator value
● Go through the same process every time the periods ends.
The AroonUp or AroonDown can be calculated using the formular below.
AroonUp = [(specified period - periods since specific period high )/specified period]× 100)]
Let us now calculate AroonUp using some estimated figures.
Assuming that our specified period of consideration is 25 days, and the periods since 25 period high is 2(this implies that a new high was formed two days ago) . Applying that to our formula of AroonUp
AroonUp = [(specific period - periods since specific period high )/specified period]× 100
AroonUp = [(25 - 2)/25] × 100
AroonUp = 0.92 × 100
AroonUp is = 92
For AroonDown, we use the formula below.
AroonDown = [(specified period - periods since specific period low)/specific period] × 100
Using figures to illustrate that, assuming that our length is 25 periods and the period since the specific period low is 1(this means that a new low was reached one day ago), then the AroonDown will be calculated as follows
AroonDown = [(specified period - periods since specific period low)/specific period] × 100
**AroonDown = [(25-1)/25] × 100
AroonDown = 0.96 × 100
AroonDown = 96

Show us the Steps involved in Setting Up Aroon indicator on the chart and show different settings. (Screenshots required).
The steps involved in setting up the Aroon indicator are as follows:
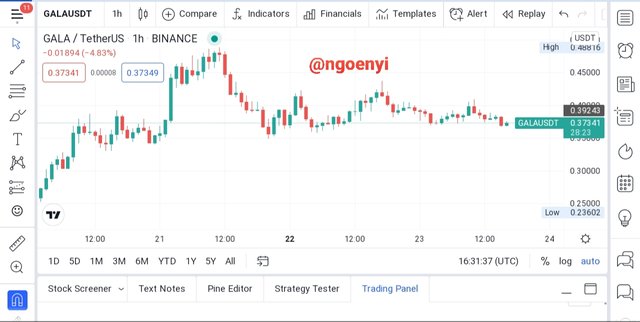
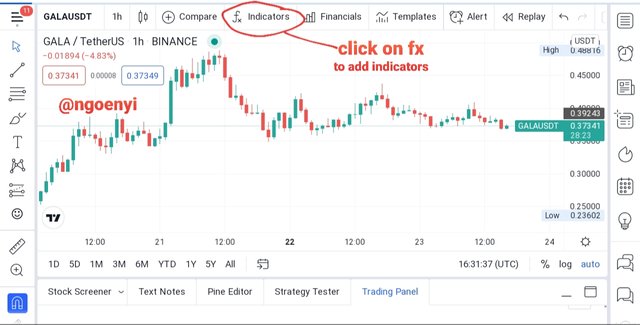
● Open a trading platform of your choice, I am using tradingview.com. I am using a chart of GalaUsdt.
● At the menu side, select fx which is normally used to add indicators to our chart.
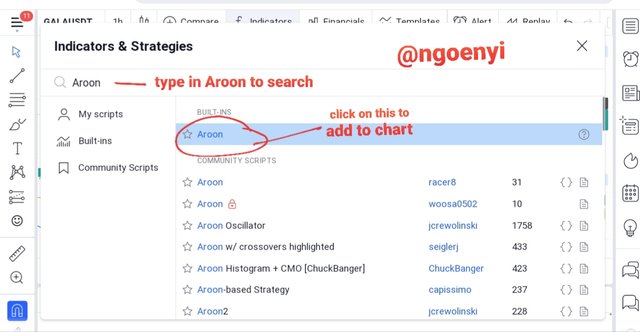
● on the search bar of the indicator dialogue box, type Aroon, then on the drop down menu, click on Aroon.
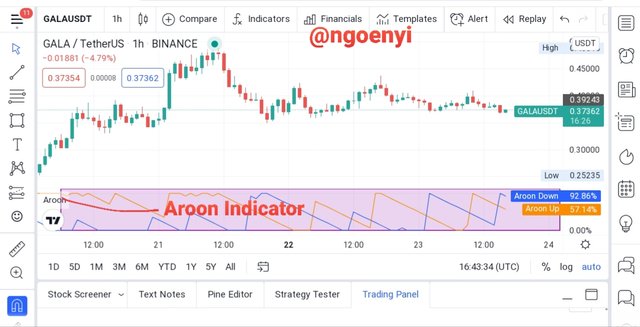
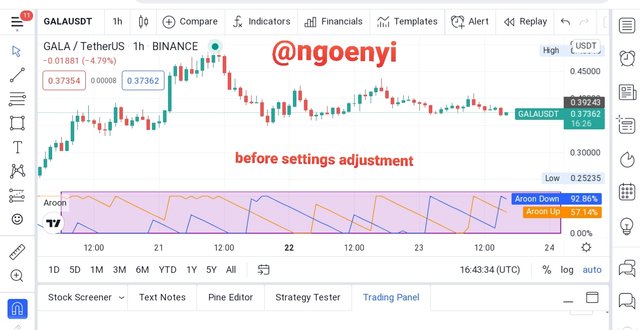
● The Indicator now appears on the chart.
To adjust the settings if we wish*
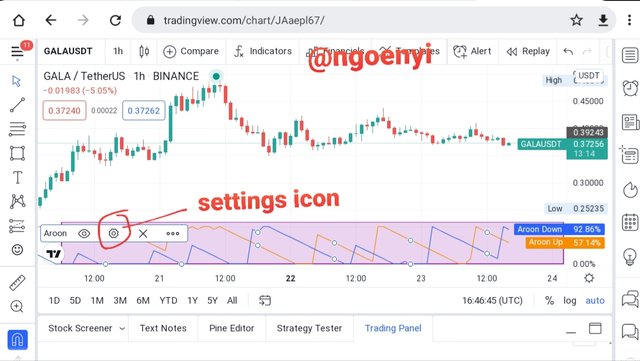
■ Click on the settings icon of the indicator
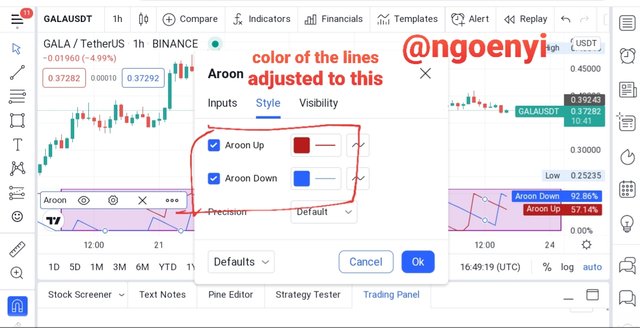
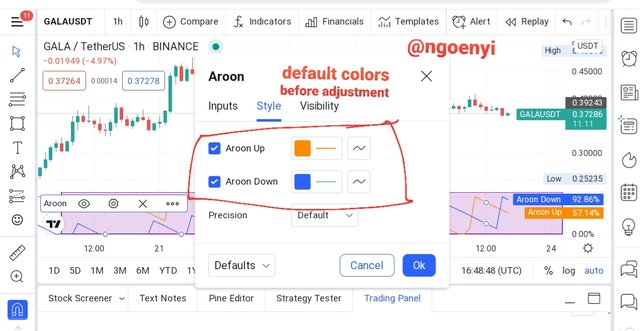
■ we can adjust the colours of the AroonUp line and the AroonDown line
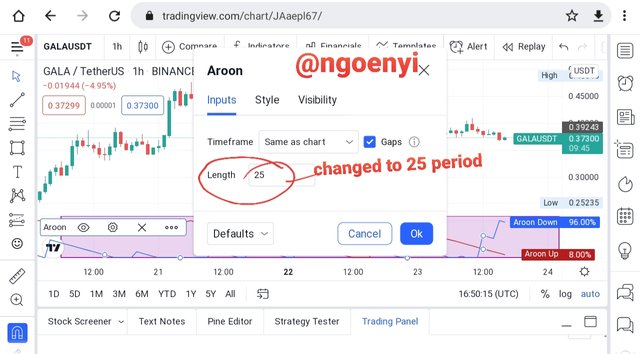
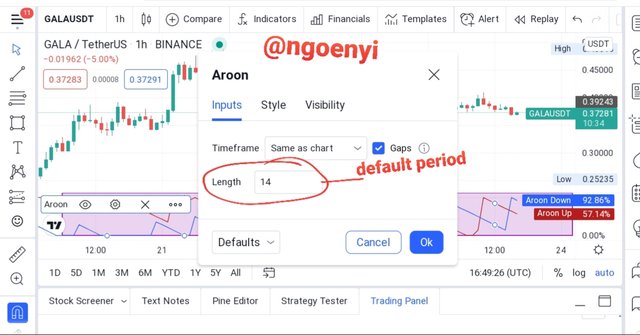
■ The period setting is 14 by default, so I will change to 25.
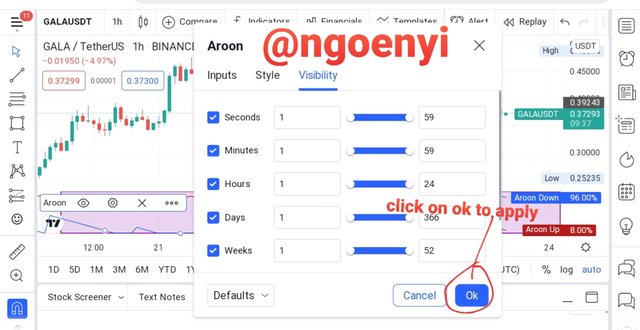
■ Visibility setting is to ensure that it appears on all timeframes.
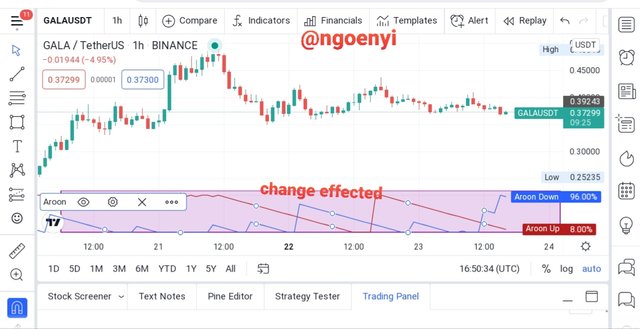
Then click ok, the changes we have made will appear thus
This is how to setup the indicator on the chart.

What is your understanding of the Aroon Oscillator? How does it work? (Show it on the chart,)
We have earlier mentioned that when the value of the Aroon indicator is between the values of 70 to 100, it implies that we have a strong trend, but when observed to be between 30 to 0, it implies a weak trend. It is also good to note that when the value is at value 100 for a long time, it probably means that the trend is about to change.
The AroonUp line and AroonDown goes a long way determining the readings of the Aroon Indicator. There are usually what we call crossovers for Aroon indicator, which may likened to a death cross. Those crosses are important indicators of a buy or sell signal. This presents an opportunity for the traders to open a buy or sell position. Apart from indicating an entry position, be it buy or sell, these crossovers confirm the reliability of the change in trend.
In a situation where a crossover occurs and the AroonUp maintains a record of consecutive new high, the Indicator value will be high, moving along with the uptrend. Conversely, in a situation where AroonDown crosses the AroonUp during a downtrend creating new lows, the AroonDown value will be higher.
Buy Signal
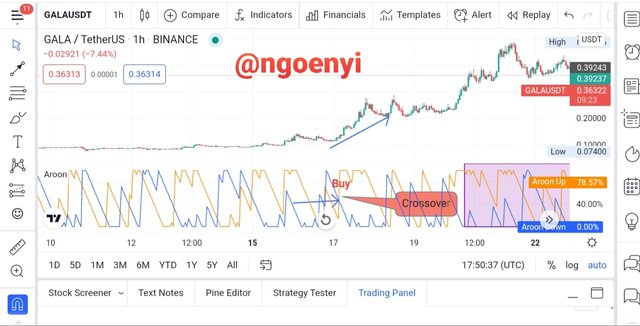
To identify a buy signal using the Aroon indicator, whenever the AroonDown line have been above the other line for quite sometime, and then we start observing the AroonUp moving up while the AroonDown is moving down. It eventually crosses the AroonDown and continues moving upward, it is time to open a buy position just slightly above the point of crossing.
The orange line is the AroonUp line while the blue line is the AroonDown line.
We can see from the chart that at the point of crossing, the AroonUp was more than 75% indicating a strong uptrend. We can also observe that it stayed up for quite a time as can be seen in the chart. So the point at which it crosses is a buy signal for traders to open buy position.
Sell signal
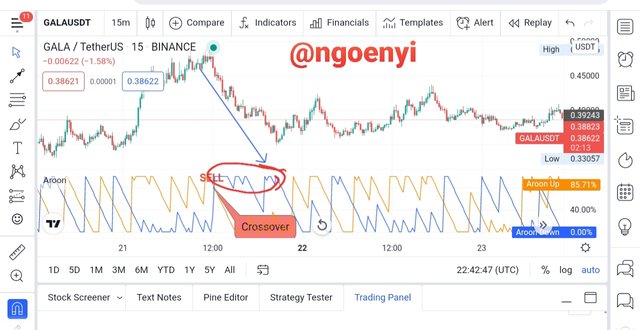
The Aroon Indicator also provides a sell signal. This it does when the AroonDown line which has been down for quite sometime starts moving up such that it crosses over the AroonUp line. This implies that the trend have changed from upward to downward trend. That point of crossover presents a sell entry opportunity to ride the downward trend.
Let us look at the chart below.
From the chart above, we will observe that the price was in an uptrend, then suddenly the AroonDown started moving up until it crossed over the AroonUp Line signifying a change in trend. At that point of crossover presents a fine opportunity to enter a sell entry position.

Consider the Aroon Indicator with a single oscillating line, what does the measurement of the trend at +50 and -50 indicate?
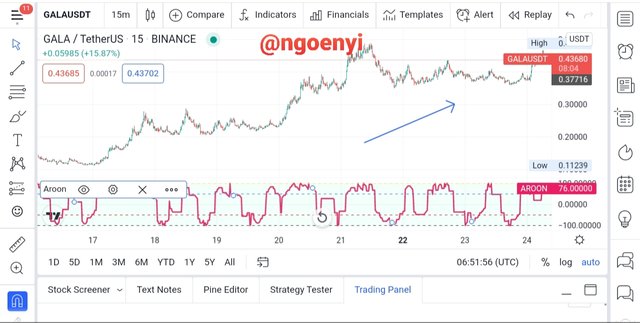
For the Aroon indicator with only a single oscillating line, it uses a value range of 100 to -1000. When the value of the indicator is above or at +50 , this is an indication of a bullish trend, conversely, when the value is below -50 this signifies a bearish trend.
Moreover, when the values hovers around the zero line, that signifies non availability of any trend in the market.

Explain Aroon Indicator movement in Range Markets. (Screenshot required).
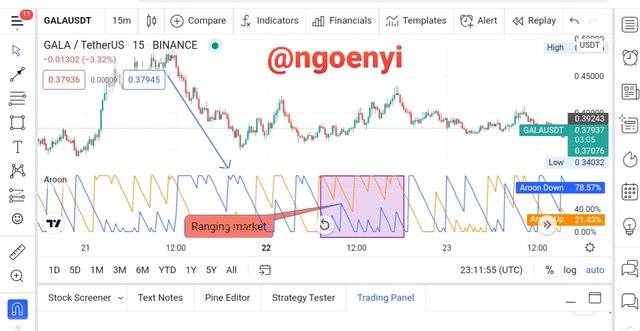
The Aroon Indicator also helps the trader identify when there is no trend in the market. Instead the asset pair is moving in a sideway or ranging movement. This saves the trader the problem of locking up cash in the trade since there is no clear movement of price. During the ranging market, the AroonUp and AroonDown moves in a parallel direction without crossovers for some period of time.
The chart below shows:
Viewing the chart above, we observed that the asset price movement was already in an uptrend since the AroonUp line was up above the AroonDown. Additionally, for quite some period of time we notice that no crossover was made as shown in the highlighted area of the indicator.
Once no crossover occurs and the lines moves in parallel direction, this shows the market is ranging.

Does Aroon Indicator generate False and Late signals? Explain. Show fake and late signals of the Aroon Indicator on the chart. Combine an indicator (other than RSI) together with the Aroon indicator to filter late and false signals. (Screenshots required).
Does Aroon Indicator generate false and late signals
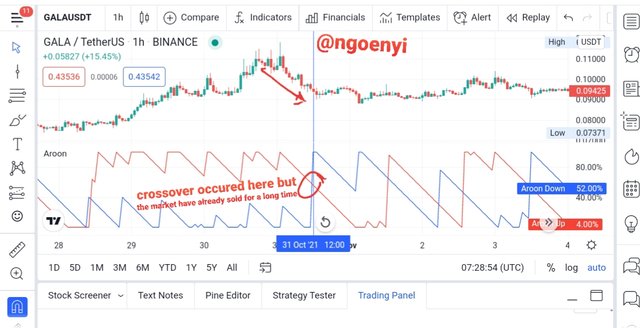
The Aroon Indicator is not a perfect Indicztor. Just like anyother indicator will not give you 100% percent accurate signal, Aroon also having such deficiency. This is due to the reason that, it is a lagging indicator, measuring the price movements of the assets in the past. Because of this reason, the crossovers may occur late, generating a late signal for the trader, meanwhile the trend have gone far.
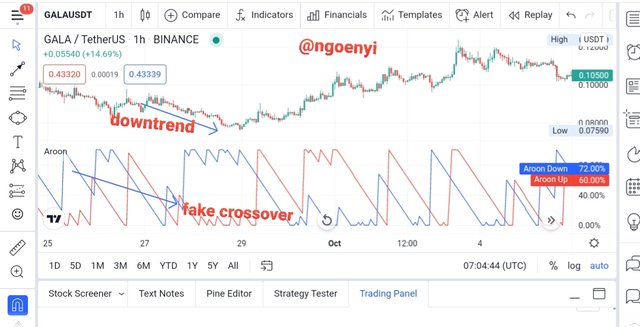
Additionally, there is also the possiblity of generating a false signal through multiple crossovers, since these crossovers will not last long. In this situations, the trader would have to confirm the signal by adding other indicators in his chart.
Let us see an example of a fake signal.
From the chart above, we can see that AroonUp crossed over Aroondown. But this was only temporary and fake sin it did not last long before the Aroondown crossed over it again and extended the downtrend.
We can also see the example of a late signal from the chart below.
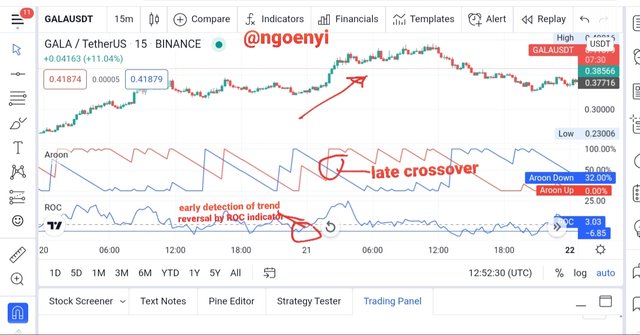
We will observe from the chart above that before the crossover took place, the market have sold for quite sometime. The vertical line shows the point where the crossover occurred on the chart. So it is already a late signal.
Combining other indicators with Aroon to filter out late and false signals
To help filter out late and false signals , and make the Aroon indicator more perfect, it is best to use it with other indicators.
One of the indicators that works well with Aroon is the ROC indicator. It can assist in confirming the trend reversal early and in filtering out late signals.
From the screenshot above, I have added the ROC indicator to my chart. We will observe that at the circled point, the ROC was already below the zero line at -6.85 , which means that the asset pair was in an oversold condition. Thus warning the trader of an impending trend reversal earlier. Unlike the Aroon indicator that gave a late signal when the new trend is already on its way down.
So with this we are convinced that using the Aroon indicator with other ones provides an early signal to trader enabling him to get the best out of his trade and detect trend changes early.

Enter at least one buy and sell trade using the Aroon Indicator with the help of the indicator combined in (7) above. Use a demo account with proper trade management. (Screenshots required).
Sell Trade
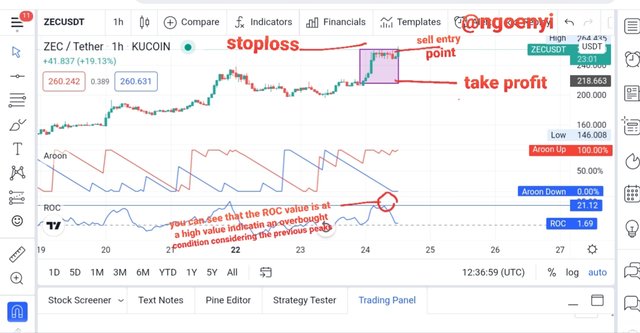
I am entering a trade with the asset pair chart of ZecUsdt. As at the time of taking this trade, this assets ROC value is already above 21, indicating an overbought condition (considering other peaks) however the Aroon Up is at 88. Knowing that Aroon sometimes gives a late signal and the AroonUp is reducing in value having being up their for sometime, I decided to enter a sell position with a tight stoploss.
See the entry below.
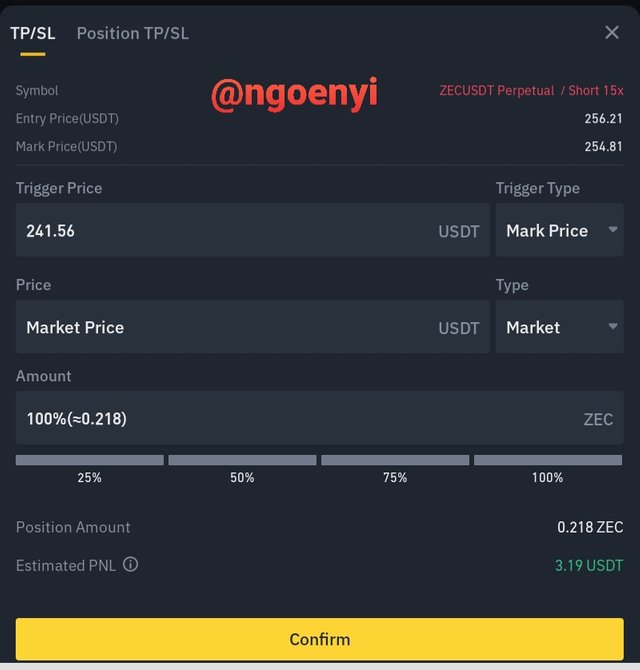
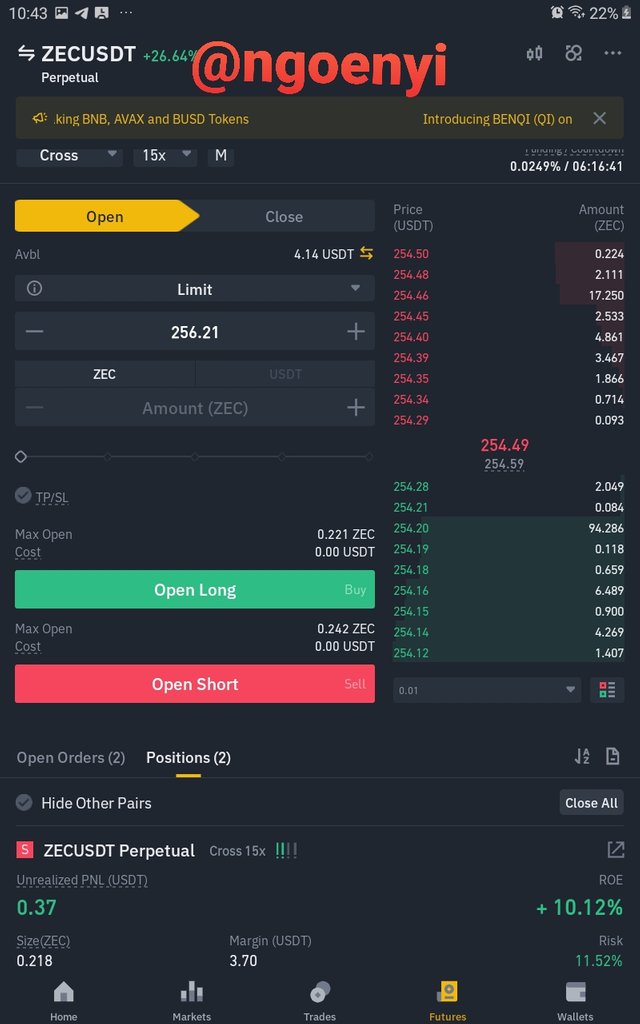
I now took the trade on Binance app. See the screenshot below.
I opened a sell position at $256.95 and from the screenshot above I have a very tight stoploss. My takeprofit is at 241.36 which is a risk to reward ratio of 1:3.
Buy Entry
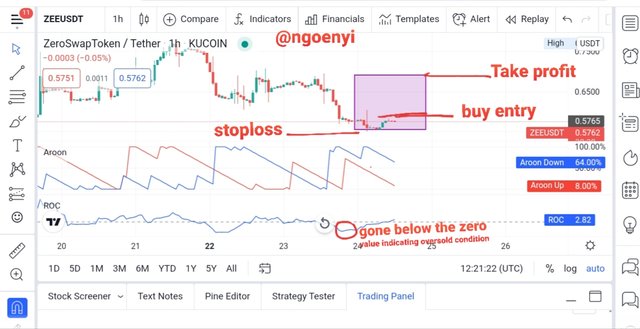
I place a buy trade of the asset pair ZeeUsdt. The asset pair is already oversold and is trying to bounce back. Even though the bullish crossover have not taken place, the AroonUp is gradually reducing.
From the chart I placed a buy entry position just above the neckline at 0.5789. The take profit was set at 0.66 while the stoploss was set at 0.5562.
Once more the risk to reward ratio is placed at not less than 1:2.

State the Merits and Demerits of Aroon Indicator.
Pros of Aroon Indicator
● It is easy to use
● It helps to identify trends very easily
● it helps the trader to pick out changes in trend.
● it also assist in measuring the strength of the trend irrespective of the direction.
● It provides traders with the ability to adjust the periods used in calculation of the Aroon lines depending on the way they trade.
Cons
■ It provides late signal to a trader. So he will not make the most out of the trade.
■ It can also provide false signal which can be to detrimental of the trader.
■ it does not provide a forecast of future price of an asset.
■ It requires that it be used in combination with other indicators to remove the false and fake signals, to give a more accurate reading.

Conclusion
Thank you @fredquantum for such a nice lecture. You have helped me to add one more indicator to my knowledge. I have learned about the Aroon indicator, how it works and how to use it to get the best out of my trade.
