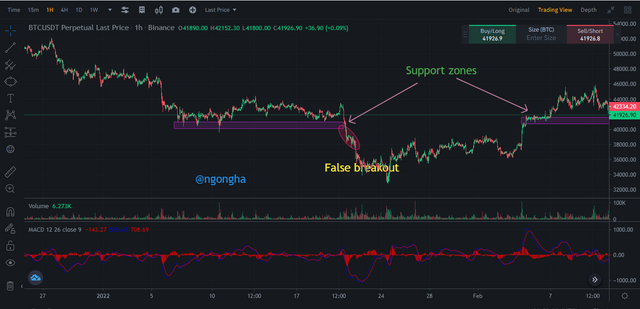
Greetings Steemians, welcome to this lesson that has been meticulously taught by professor @shemul21 on Crypto Trading by Identifying Support and Resistance in which I will love to reply to.

Question 1
What is the Support & Resistance zone?
Support and Resistance zone.
In the trading of cryptocurrency, this is give or take one of the most wildly used type of indicators in the trading of assets, currencies, stocks or cryptocurrencies. It results from the response of traders mostly around interesting or sensitive price zones. This is done in a way that the price is hit from that particular region either downward or upward resulting to a resistance or support region respectively. If these prices touch these points on numerous number of times and the result is still a hit or bounce off, it results to an increase in strength of the support or the resistance.
Resistance zones
This is the region in a chart where a particular price was not able to close above the zone (this can be seen as the ceiling of a price at a particular time).
This method of price movement is from the bullish to the bearish direction because the sellers reject the price that is steadily increasing and as a result creates a selling pressure that bounces the moving price.
This can be likened to a bouncing ball on the floor and to the ceiling. The “ceiling” in this case is the region referred to as a Resistance. The following screenshot very much helps as a visual aid.
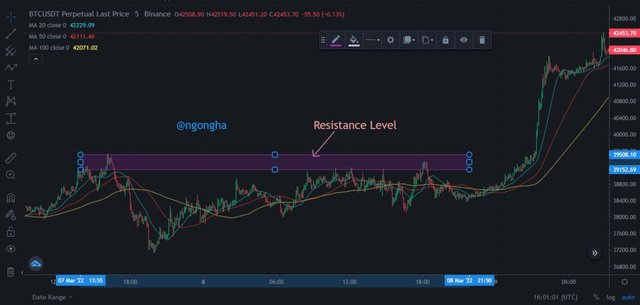
Screenshot taken from binance.com
Looking at the BTCUSDT chart, one notices that the resistance of price between 39152.69 and 39508.10 was held for a period of time where it was unable to close above it thereby favoring sellers to cause the market move downward.
Support zones
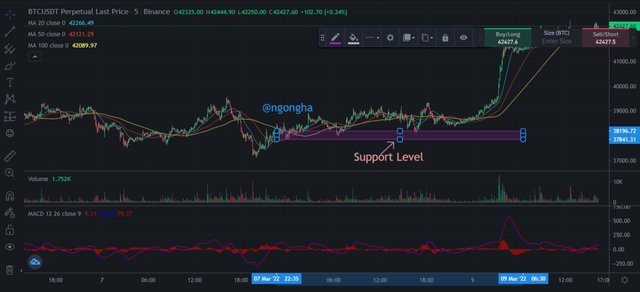
A support zone can be referred to as the bottom zone that a price can range in. It is likened to the floor on which the ball (price) falls on it and bounces off upwards.
Due to a temporal high concentration of demand, in favour of buyers, the price tends to stand for a while. This is the direct opposite of a resistance level as the price rather moves upward after its release due to an increase in the buying pressure experienced in the market. The screenshot below gives an example of such.

Question 2
Explain different types of Support and Resistance with proper demonstration
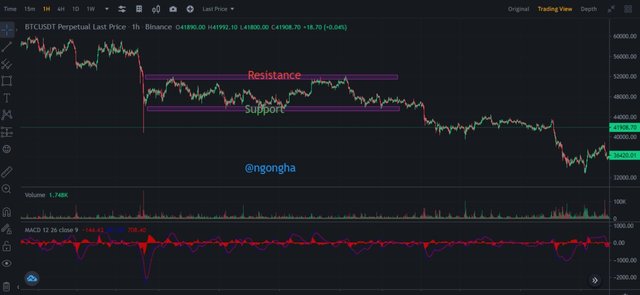
In simple terms, there mainly exist 03 types of support and resistance regions namely
- Dynamic support and resistance
- Horizontal support and resistance
- Sloping support and resistance
These will be detailed one of the other viz;
Dynamic Support and Resistance
They are easily found using the popular moving averages (MA) [50 and 200] indicator which exists as the market resists a region and continues moving in its original direction. These can occur either in an uptrend or a downtrend as explained below.
In an uptrend
Here, the dynamic support is observed from the MA if or when the price successfully breaks the indicator lines and re-finds itself to keep climbing.
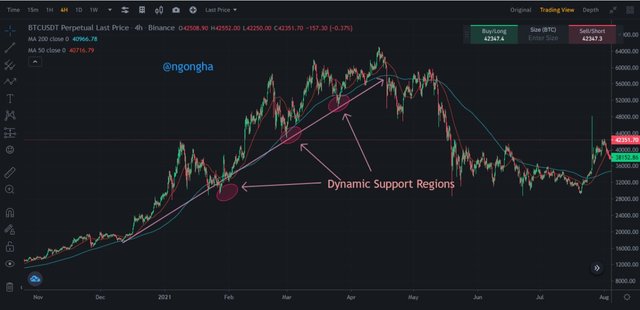
Screenshot taken from binance.com
As seen above, the MA indicators serve as a dynamic support in this uptrend. Whenever the price touched the encircled regions, it found itself retracing to the uptrend it was destined for.
In a downtrend
The moving averages present a dynamic resistance in the cases where the price digs below the indicators’ lines and continues its downtrend as seen below.
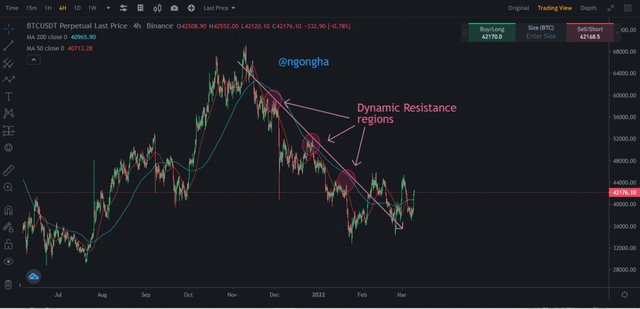
Screenshot taken from binance.com
Horizontal support and resistance
Here, the price ranges amongst a top high and a low bottom region of consolidation in which it neither breaks the support nor the resistance. At times, the price can break a resistance turning it to a support which mostly occurs in an uptrend or could do similar to a resistance transforming to a support usually in a downtrend. These regions indicate the strength of the stronger party in the market (either sellers or buyers)
In an uptrend
Generally, if a region has acted as a support for a period of time and the price successfully breaks it turning it to a resistance represented by lower highs and lows, thus transforming to a bearish market.
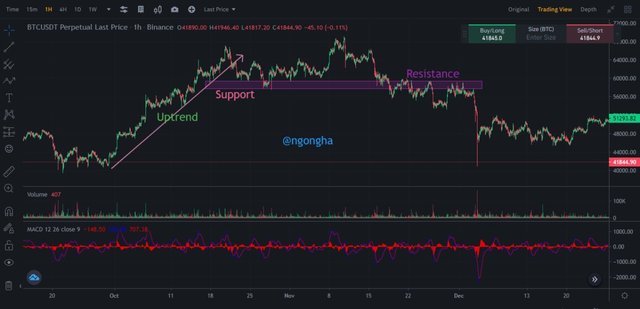
Screenshot taken from binance.com
As seen using the BTCUSDT chart, once the support is broken and closes below it, it forms a resistance which can strong if tested numerous times.
In a downtrend
If an asset is dropping in this case, it likely hovers around a resistance and then a support; that when broken, instantly leads to an appearance of higher highs and lows which are characteristic of a bullish market.
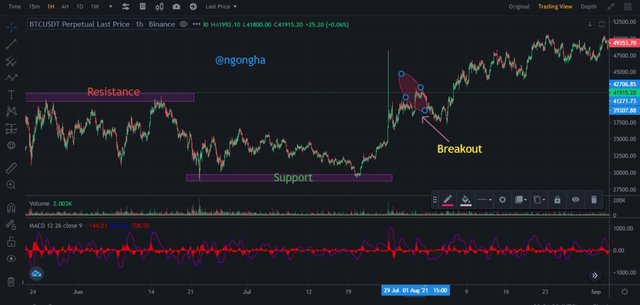
Screenshot taken from binance.com
Sloping support and resistance
These are diagonal upwards or downward trends that are visualized in the market.
In an uptrend
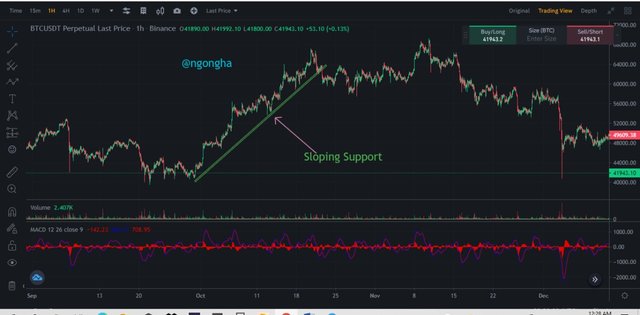
When an inclined line or region is used to gauge ascending highs and lows, vividly, a slanted support/resistance is found. This is similar to horizontal support and resistance but for the difference that the lines here are not horizontal as expected but instead slanted.
Screenshot taken from binance.com
From this BTCUSDT chart, we notice that thrice, whenever the price touches the highlighted region, if a buy order were created, one would have made profits.
In a downtrend
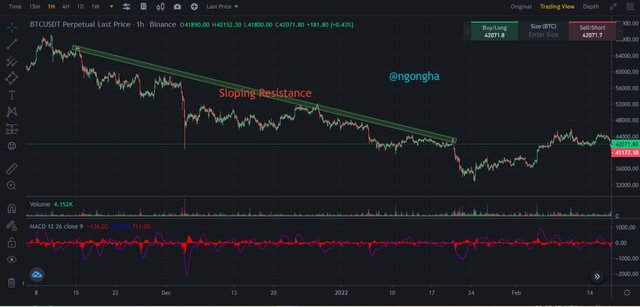
As rightly predicted, here, if a diagonal line is carefully placed along a region of momentary difficulty in breaking, a resistance is seen. This means whenever the price reaches this zone, it is unable to close above it and retraces to its downtrend. This is confirmed by the price testing this zone atleast three times but of course the more the merrier (the stronger).
Screenshot taken from binance.com

Question 3
Identify The False & Successful Breakouts. (demonstrate with screenshots)
A false breakout can be defined as the situation where a price temporarily moves either above or below an important support or resistance level, but later on retreats back to the same side as it started. This is one of the greatest nightmares of traders as it can lead to major losses if not handled correctly.
False Breakout
This is a breakout that can occur at a major support or resistance level where the trader anticipates its retest whereas it is not the case. After testing, the price just goes directly opposite to the judgement of the trader as seen below.
Screenshot taken from binance.com
Successful Breakout
Here, the breakout is successful if the price continues in its original path upward or downward or by changing the direction.
- Continuous Breakout
It occurs when a price moves in a way to test a support or resistance and finally at a given time successfully breaks it. This is shown below;
Screenshot taken from binance.com
- Reversal Breakout
This is a triumphant change in the price direction forming a different direction as compared to what it was previously going through. For instance, it can be well below its resistance for a while, and when it tests it for another time, it completely shafts it and soars.
Screenshot taken from binance.com

Question 4
Use Volume and RSI Indicator Combined with Breakouts & Identify the Entry Point. (demonstrate with screenshots)
The RSI indicator is very skilled in showing overbought and oversold portions of an asset and the volume indicator on the other hand, displays the equilibrium conditions of the asset price’s demand and of course its supply. These steps are basically compressed viz;
- Identify support and resistance regions and be certain
- Insert both indicators in any order of preference
- To buy, once a breakout from a resistance is sighted, a trade is run and of course a take profit and stop loss are recorded above and below the entry point respectively.
- To sell, once a breakout from a support is seen, a trade is executed and a take profit and stop loss are recorded below and above the entry point respectively.
Screenshot taken from binance.com
The chart indicates the use of the two indicators, the perfect stop came at the point where the RSI indicated an oversold region coinciding with a high volume breakout prompting a buy order with the obvious take profit and stop loss set as required.

Question 5
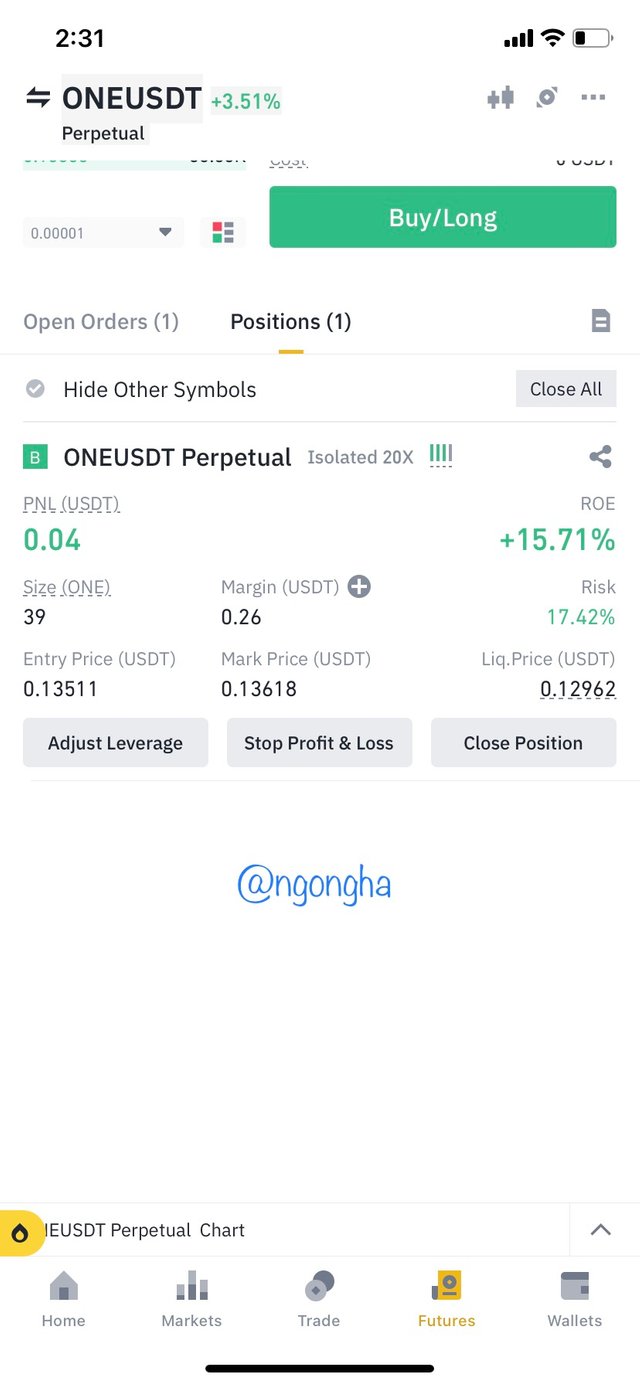
Take a Real Trade (crypto pair) on Your Account After a Successful Breakout. (transaction screenshot required)
As this is a proof of a lesson well understood, I would love to carry out some technical analysis on my verified Binance account and trade.
On a 5min chart using the ONEUSDT chart, I would love to set EMA period; 3(white), 6(cyan) and 9(yellow). The colours are vividly differentiated to ensure visual coherence and a crossover of the 3 period through the 6 and 9 EMA is awaited.
Screenshot taken from binance.com
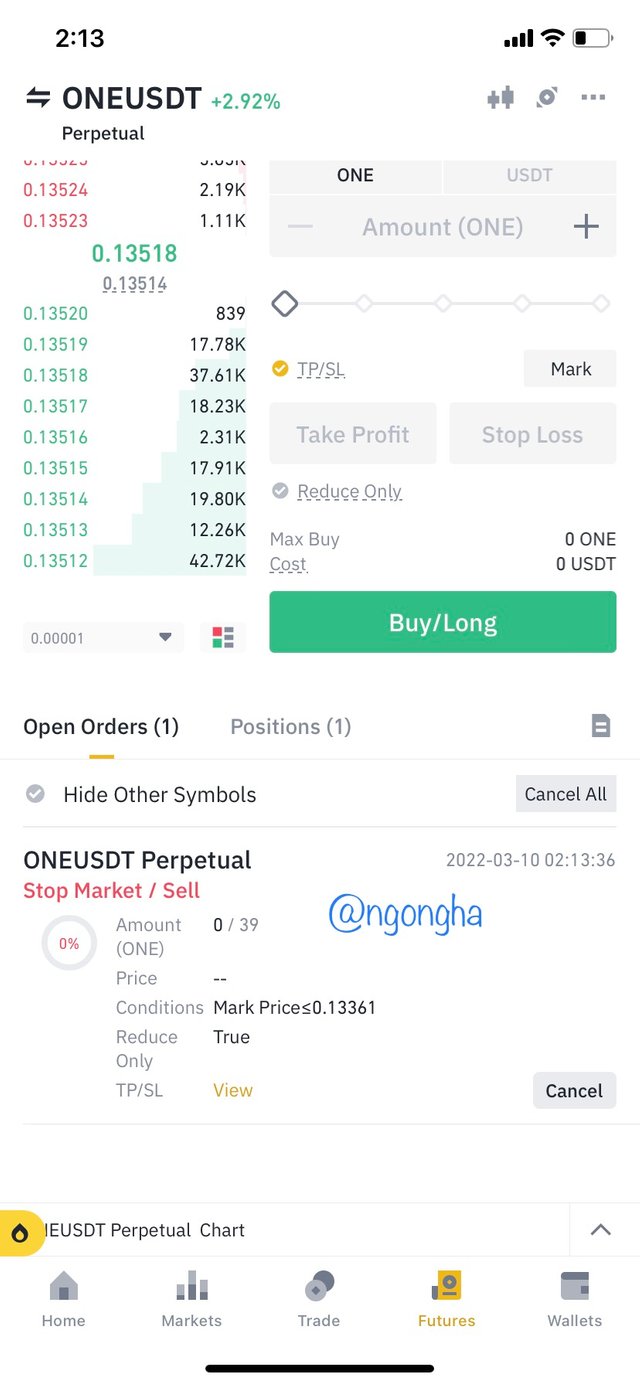
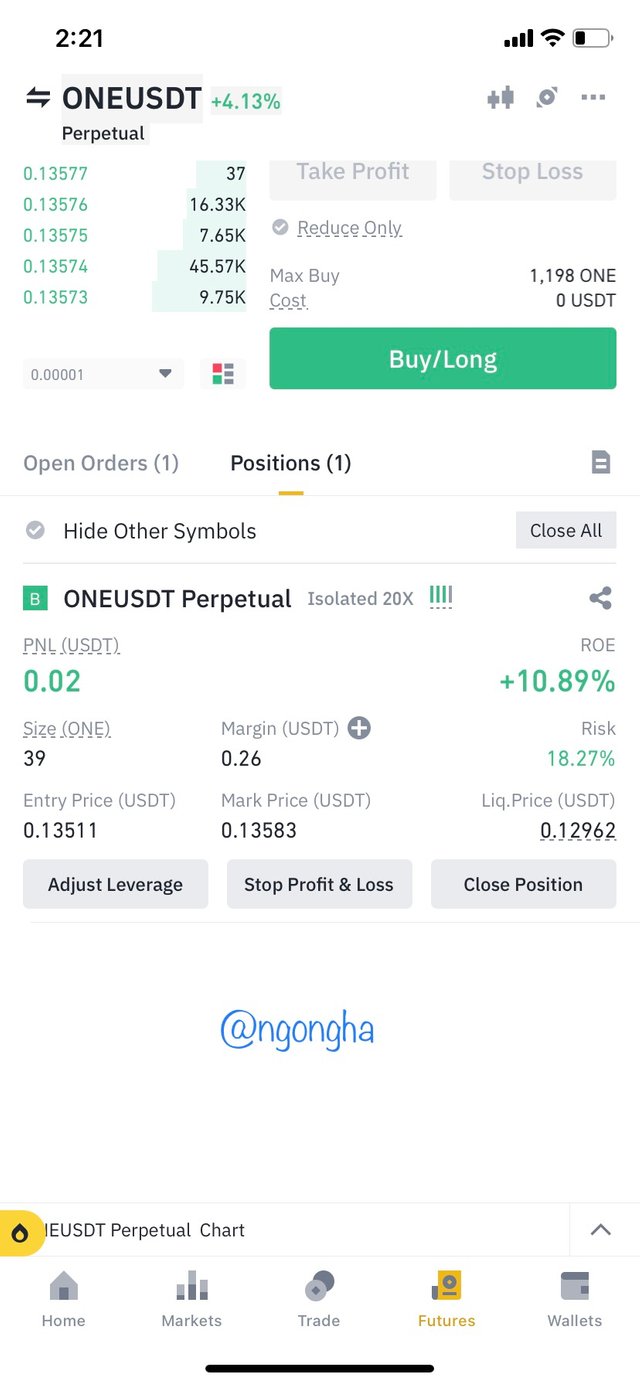
Once I notice that these three periods are intertwining, I zoom out the chart a bit to see if I can notice a potential support or resistance level to it. When found and it is evident that the 3-EMA is trying to cross over the rest, a trade is entered at an entry price(USDT) of 0.13511 with my stop loss certainly set as shown.

Question 6
Explain the Limitations of Support & Resistance (false breakout).
One major difficulty of false breakouts is the uncertainty when looked at in a ranging market. If taken wrongly, it can lead to liquidation of one’s asset as they tend to occur not only once but a reasonable number of times in a day.
Below is a vivid example of a false breakout that can cause deadening blood flow changes if taken into consideration at the time.
Screenshot taken from binance.com
It is evident from above the shock a trader is going to face in times of false breakouts. That is why as advised by our esteemed professors, since no strategy is ever the holy grail, it is very much essential to use a combination of other indicators and a good number of practice to harness this chi.

Conclusion
With great thanks to professor @shemul21, not only have I had a good knowledge on the support and resistance levels, but have I also learnt of a new combination of technical indicators namely the RSI and Volume. Considering trading, I was able to use 03 intertwining EMA periods which gifted me a profit of $0.04.
Once again, I shower a lot of appreciation to Professor @shemul21 for his intellect and selflessness in giving to us this pearl of information.
CC
@shemul21

