I am excited to participate in the week2 season 4, I am @nikoyana and below is my homework post


Define in your own words what Harmonic Trading is?**

HARMONIC TRADING:
like the saying "goes that whatever goes up must come down" or "what goes around, comes around" it is no different in the world of crypto as we see the fluctuations in the market charts, giving repetitions and following patterns on regular basis, similar to the example given by the professor in the lecture about the life cycle, we can also take an example from a maize crop that was planted, it germinates, it grows, it is harvested and then it dies . with that itt can be likened to the accumulation stage, distribution stage, re-distribution stage and then the declining stage.
Harmonic trading is just the repetition of the market trends over a period of time. in otherwords if there is a bullish movement in the trend of a market, there is going to be an eventual downward movement followed by a similar bullish movement in the market trend to pull it up, likewise the similar trend in the market occurs for the downward or bearish movement in the market

Define and explain what the pattern AB = CD is and how can we identify it?

The AB = CD pattern in the Harmonic Trading can not be defined and explained without recognising who discovered it. the pattern was discovered by HM Gartley. The pattern is built on four(4 major) cardinal points being A,B,C,D. It indicates a potential reversal zone at different points both at buy entry and sell entry. It is a great pattern to learn because as soon as you are conversant with the movement A,B,C,D, you can identify any time frame you wish to analyse or under-study as certainly we are sure there is going to be a repetition of movement
Let me give a brief explanation on how the AB=CD pattern works for a bullish and bearish market trend
AB=CD pattern happens in both that is in the bearish and bullish movement of the market.
So let’s quickly examine how they can be identified easily on a bearish trend first
Bearish Market Trend
To identify the Bearish AB=CD pattern, these are the steps required
- The price at the moment must be on an up trend
- While looking for your 4 points, A must be your starting point with its position at the lowest level
- Then point B, should be higher than A, showing the highest point of the price movement at that time
- Then come point C, which should indicate a retracement from point B, meaning the level of point C should be lower than Point B but higher than point A
- Then Point D which should be another upward movement from point C showing that the buyers has taken possession of the market, after this point then a final reversal may happen.

The 4 point has to be verified by the help of another indicator called the Fibonacci Retracements , these are the ways to properly verify the AB=CD pattern
- Using the Fibonacci retracements, measure from A to B. the retracements line should not pass B from A
- The Point C must be between 61.8% and 78.6% of the fibonacci retracements.
- The point D must fall in between 127.2% and 161.8%of the retracements of the movement between BC.


From the above chart we can see that point C is between 61.8% and 78.6%

Point D is at 161.8% from the fibonacci retracements movemnet of BC
Bullish Market Trend
To identify the Bullish AB=CD pattern, these are the steps required
The chart below is AUDIO/BTC in a $hour time frame

- The price at the moment must be on an downtrend
- While looking for your 4 points, A must be your starting point with its position at the highest level
- Then point B, should be lower than A, showing the lowest point of the price movement at that time
- Then come point C, which should indicate a retracement from point B, meaning the level of point C should be higher than Point B but lower than point A
- Then Point D which should be another downward movement from point C showing that the sellers has taken possession of the market, after this point then a final reversal may happen.

From the Chart above, we can see the movement of the fibonacci retracements from A to B and point C happens to be between 61.8% and 78.6%

Point D is at 161.8% from the fibonacci retracements movement of BC.

Clearly describe the entry and exit criteria, both for buying and selling using the AB = CD pattern?
For Buy and Sell Entry
- First it is important to identify the for different points A,B,C and D
- As soon as we have confirmed the 4 different points, it is important to identify that C is between 61.8 and 78.6 and that D is between 127.2 and 161.8 of the Fibonacci Retracements fot all points to be valid, if they points do not meet this requirements then we should immediately disregard it
- If we notice that the point D joins with the Fibonacci Retracements at 127.2% & 161.8% and immediately starts to form a bearish candle, it is wise to enter the trade immediately
For Buy and Sell Exit
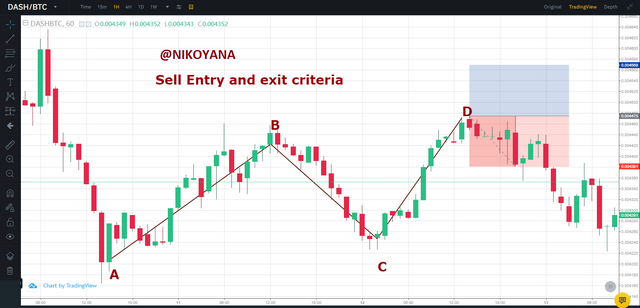
for an exit set your stop loss at 2% above or below point D, which was the point at which we made the entry

Make 2 entries (Up and Down) on any cryptocurrency pair using the AB = CD pattern confirming it with Fibonacci.
For Buy Entry and exit Criteria
The chart was gotten from AUDIO/BTC on a 4 hours time frame
Identify the 4 Point ABCD
Using fibonacci retracements to verify your points
From the distance between A and B is measured and Point C lies between 61.8%
From the distance of point B to C, point D lies between 127.2 and 161.8%
We executed our buy order at point D, using a risk to reward ratio of 1:1
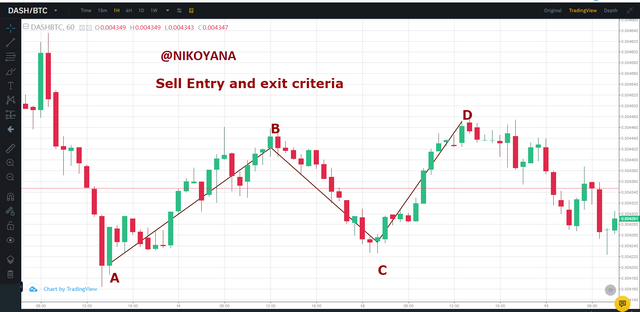
For Sell Entry and exit Criteria
The Chart was gotten from DASH/BTC on a 1 hour time frame
Identify the 4 Point ABCD
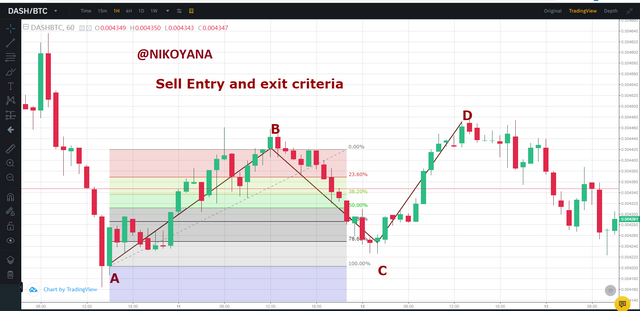
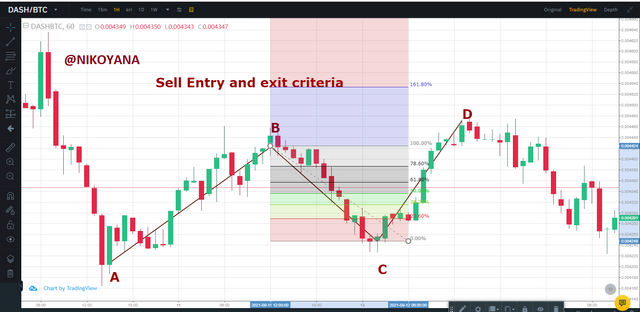
Using fibonacci retracements to verify your points
From the distance between A and B is measured and Point C lies between 61.8%
From the distance of point B to C, point D lies between 127.2 and 161.8%
We executed our sell order at point D, using a risk to reward ratio of 1:1
ALL SCREENSHOTS WERE TAKEN FROM THE TRADINGVIEW WEBSITE LINK
CONCLUSION
It was really an interesting class, as I learnt alot from the class about the harmonic trading and all that concerns it. getting more acquainted with the AB=CD and the conditions that most be met to make an entry or an exit using the principle learnt
Knowing this principle will increase your chances of predicting the price of an asset and aid better trade for investors using the Fibonacci Retracements
best regard
@lenonmc21


.PNG)
.PNG)
