greetings steemains, it's awesome to be here again and this is week 5 of season 5 and we learnt a very interesting topic and I will be giving my answer based on the lecture.
There may be a little mistake due to google translate but I will try my best to minimize it. let's dive into the homework post


Explain and define in your own words what the "VWAP" indicator is and how it is calculated (Nothing taken from the internet)?
I have so much talked about the use of technical indicators in the crypto market, Most profitable traders makes use of different technical indicators tools in the market, which helps them in different thing ether to determine trend, or know the exact entry and exit point in the market.Today we will be looking at one of the most profitable tool in the Market. The name of the Technical indicator tool is the VWAP which stands for Volume Weighted Average Price.
The VWAP or Volume Weighted Average Price is a very unique indicator, that has a special feature that most technical indicators tools does not have. Many traders in the market uses this technical indicator tool know the price direction. It uses the relationship between the price and the volume. The VWAP normally is used to know the trend of the price of the asset and also the amount of the asset.
One Great feature of this indicator is it ability not to change phase orr orientation in different timeframe. Most technical indicator tools changes phase at different time frame, but not in the case of the VWAP. Most other indicators, you will need to re-adjust the settings but not in the case of the VWAP.
The Technical indicator tool is made up of a line that looks like the moving average, this line move in the same direction with price. You can only buy using the VWAP when the Price is above the line and sell when the price is below the low.
For you effectively calculate the VWAP well, you need to put into account the following informations
Price
Volume
Number of Candles per day
The Formular that the VWAP is calculated on is the formular below
VWAP = P + Vm / Ndc
Where the VWAP
P = price
Vm = Volume of money traded
Ndc = Number of Candles per day
Using the above formula, you can comfortably calculate the Volume weighted Average price.

2. Explain in your own words how the "Strategy with the VWAP indicator" should be correctly applied (Show at least 2 examples of possible inputs with the indicator, only own charts)?
Knowing how to use the VWAP effectively is a key in trading with the VWAP indicator, or else you will regret using it. Using this strategy, you will need to know about the Market structure, and also how to use the fibonnaci retracement tools and also how to effectively apply the VWAP also. With these three things in place you are good to go and make your profit.
We will start this process by adding the VWAP technical indicator. In this chart I am using the tradingview on my laptop which I am using the chrome browser to access the tradingview by entering their website at Tradingview.com
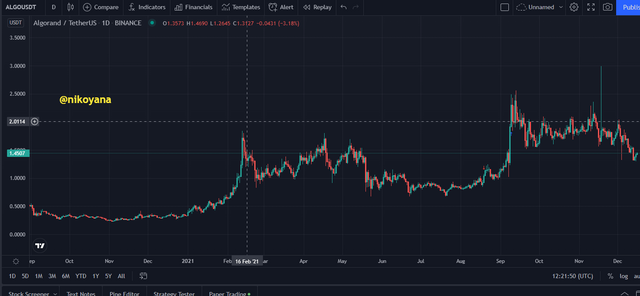
- This is how the chart is when you open it using the chrome browser, I made the background to be dark, Then you can click on “fx Indicator” this place has all the indicator .
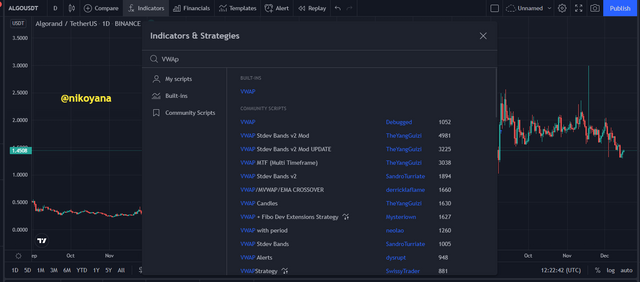
Then gently search for the VWAP and it will come out, then select it
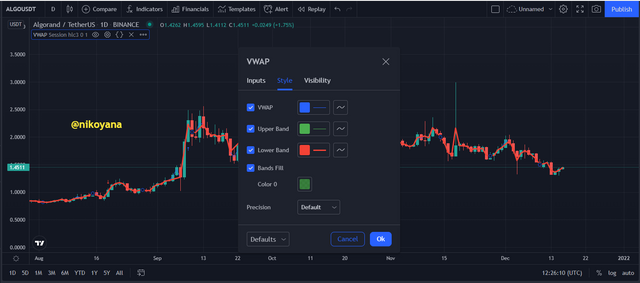
You can also go and click on the gear icon so you can adjust the settings to suit you. You can change the color and the line weight to suit. After doing all the required settings you can now click ok.
Below you can also the VWAP where it is added and see carefully how it looks from the chart below.
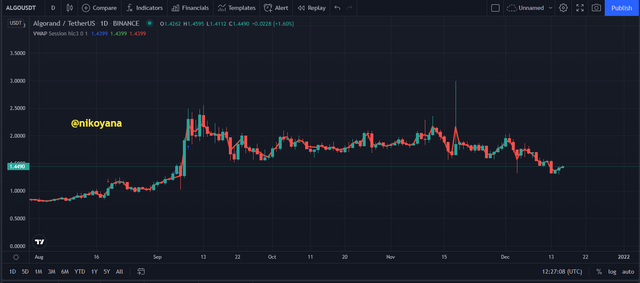
The VWAP which attract the price in the market, acts like a magnet by constantly attracting and repelling the price. Because of these you can use as a good support and resistance tool in the market. The trend reversal can some times be known when the price of the asset moves above the line, this is the reason why we must wait for the price to be close to the VWAP before we take any important decision which can be an entry or an exit point. However having the knowlegde of Market structure is key which works with the break of VWAP indicator, couple with the use of the Fibonacci retracement which serves as a Confluence (Combination of two or more technical indicator), before we can make an entry point in the market.
The Following steps are required to be taken carefully while using the VWAP indicator as a trading Strategy.
The first and most important step in this strategy is the adding of the VWAP indicator, which we have done. The use of market structure such as the support and the resistance will be also be applied and a confluence of the Fibonacci retracement will also be applied. With all these in place we are good to go, so let’s start.
Market Structure Breakout from bearish to the bullish and vice versa
The initial step we must do, is to wait last maximum point to be broken and also this will be seen in the VWAP where also the break will also occur. This is just the first step, so continue with me in this journey.
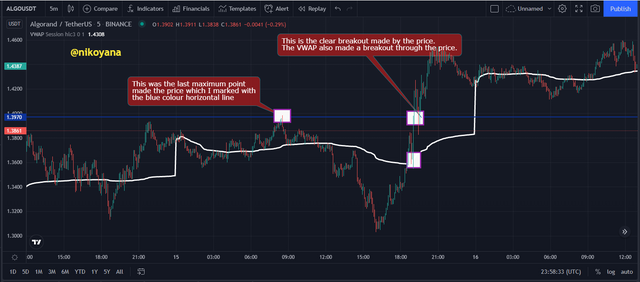
Look closely to the market structure, you will notice that after the last bullish impulse nmade by the price, it begins its retracement. Seeing the retracement, it is time to employ our Fibonacci retracement tool.
Using the the Fibonacci retracement you should measure the last impulse from bottom to the top of the price on the chart. If you do it accurately, you will notice that the zone 50% and 61.8% is the right entry zone which is the also the zone that the VWAP cut across the price, with these in place we can say that that zone is correct.
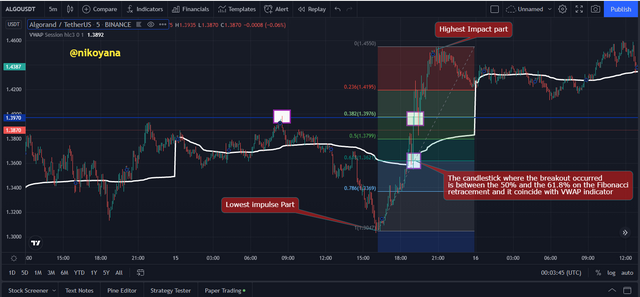
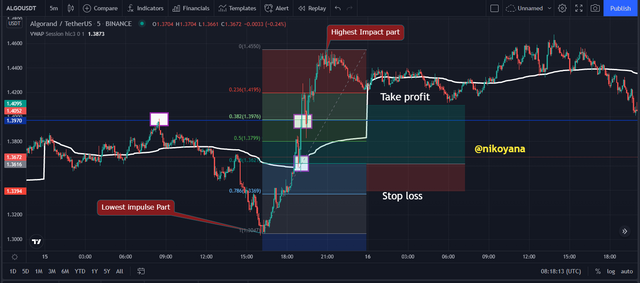
Price Management: If the point in the price where you have estimated is reached by the price, and it is between the 50% and the 61.8% level in the fibonacci retracement. We can use the the next level below as our stop loss and using a risk to reward ratio of 1:2 will carefully place our take profit.

3. Explain in detail the commercial entry and exit criteria to take into account to correctly apply the strategy wth the VWAP indicator?
You have to carefully look out for the market structure, by knowing the highest point in the market and draw an horizontal line to place support at that point and wait until the price breaks the structure which is the the support line that you have place and also the VWAP line should also cut across the line and also be below the price, this is for a buy option. The current price should be higher than the previous high. This is the first condition that needs to be in place.
Then the price should retrace to the VWAP, while the price is retracing, draw your fibonacci retracement and the for the level between the 50% and the 61.8% level if that is the level that the price breaks the VWAP, then you are on the right track. Then we can successfully take our entry position.
Our entry point for both buy or sell must fall within these levels, 50% and the 61.8% levels of the fibonacci
For a buy order the stop loss should be level below the entry on the fibonacci retracement while for the sell order, the stop loss should be a level above the entry point on the fibonacci retracement tool
Depending on your risk to reward ratio, your set your take profit with 1:1.5 or 1:2 or you exit the trade manually.
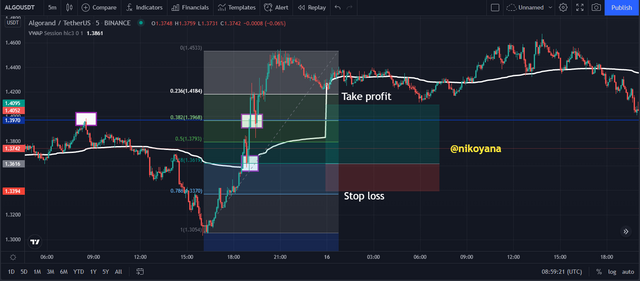

4. Make 2 entries (one bullish and one bearish), using the strategy with the indicator "VWAP". These entries must be made in a demo account, keep in mind that it is not enough just to place the images of the entry, you must place additional images to observe the development of them to be able to be evaluated correctly.
For the sell order
From the chart below, I will be using the VWAP strategy. First of all you have to look for the market structure properly, look for the lowest point and draw a horizontal line. Wait for the price to break the support which is the horizontal line
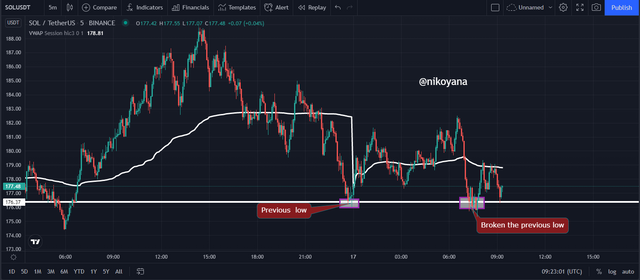
Draw the with the Fibonacci retracement because it works with the VWAP to determine the proper entry point which is on the level between the 50% and 61.8% and I entered a sell order and also the VWAP is above the price.
The VWAp served a a strong resistance that will enhance further selling order. I used the next level that is above on the fibonacci retracement as my stop loss and using a risk to reward ratio of 1:1.5 and I may exit the trade manually
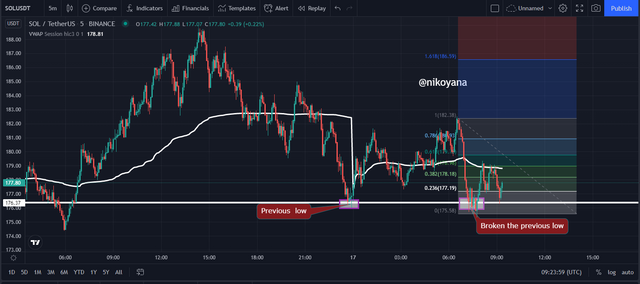
So I took, the sell order and the result is below.

For the buy order
From the chart below, I will be using the VWAP strategy. First of all you have to look for the market structure properly, look for the highest point and draw a horizontal line. Wait for the price to break the resistance which is the horizontal line
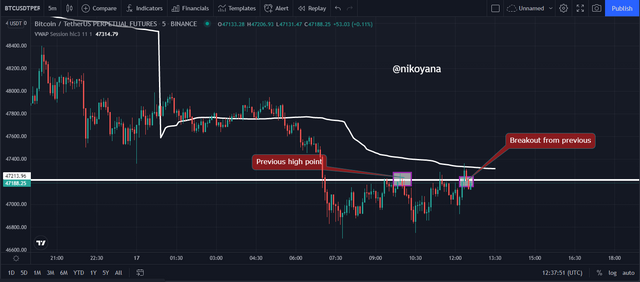
Draw the with the Fibonacci retracement because it works with the VWAP to determine the proper entry point which is on the level between the 50% and 61.8% and I entered a buy order . I used the next level that is below on the fibonacci retracement as my stop loss and using a risk to reward ratio of 1:1.5 and I may exit the trade manually
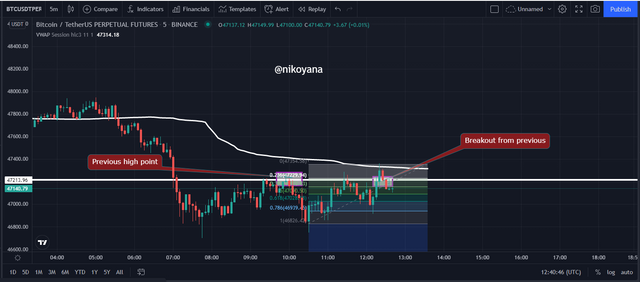
My result was not good for now, but I know if I leave the trade for some days more it will be better.


Conclusion
In conclusion the Volume Weighted Average price is a very wonderful technical indicator that is essentially if you really wants to make good profit. It works better with the Fibonacci retracement tool that determine the entry and a perfect exit point . The VWAP can also serve as strong support and resistance. It is very wonderful technical indicator, let us give it try but ensure to study and master it properly before you take it to a live trade.

IMAGE REFERENCE: tradingview
cc
@lenonmc21