I am glad we made it to the 4th week of the season 5 and we are still progressing. it was a beautiful lecture delivered and I will be writing based on my understanding.
There may be little errors due to google translate but I will do my best to make it minimal. without wasting much time let's roll.


1.Explain Puria method indicative strategy, what are its main settings. which timeframe is best to setup this trade and why? (Screenshot needed and try to explain in detail)
The Puria indicative strategy is a strategy that is based on the trend of the price in the market. For some period of time, traders now focus mostly on price trend because that is where the real profit is. The trend of the market can either be in the bullish direction or the bearish direction depending on who is in control of the market at that moment. If the buyers are in the control, it will be a bullish trend but if the sellers are in control of the market then the price will be on a bearish trend
But the Puria Indicative strategy uses the combination of one other two indicators to achieve, it goal which is to make profit. The indicators that are used in this strategy are two moving averages and one MACD (Moving Averages Convergence-Divergence).
The moving averages serves as a major support and resistance level in this strategy, while the MACD indicator helps to filter signals for correct entry and exit point in the market. So the combination of these three indicators , give us what is called the Puria indicative strategy. The Puria indicative strategy can be seen below

what are its main settings
As I have said that the Puria indicative Strategy is combination of 2 moving averages and one MACD, but there is something that I forgot to tell about the strategy. This strategy have some special settings that makes it unique, we are going to explore those setting, so we can more familiar with the settings
For the Moving Average
In the question, I will be using the tradingview platform which is on my system and I will be using the chrome browser to open and operate it. The types of moving average we are using is the Moving Average Weighted. For you to open it, go to the, indicator icon and click on it and search with the name Moving average weighted on it and you will see it appear then you can now select it

For the first moving average, these are the settings that you need to enter, in order to get a perfect puria indicative strategy will have the following settings Period = 75, Apply = low, Colour=white, Method = Linear weighted

The second moving average has the following settings that are below
Period = 85, Apply = close, Colour =Yellow, Method= Linear weighted
With these settings done to your moving averages then you are done for the setting of the moving averages.

MACD Settings
Go to the indicator search bar on the tradingview platform, and search for the MACD, then when its pop out select it, then be ready for the settings.

Input this settings on the MACD (Fast length = 15, Slow length = 16, Signal Smoothing moving Average = 1), to make work properly so that the puria indicative strategy can be of high effect to you and make you more profitable.

After all the settings have being done, look below to see how the Puria indicative strategy look like after all the settings.

which timeframe is best to setup this trade and why
The type of traders that uses the Puria indicative strategy are most the intra day traders, because of the regular signals that it produces on a constant basis. Producing these signals will require you to set on a very low time frame, lets say from the range of M5 to H4, any time frame within these will be appropriate for you to use the Puria Indicative strategy. Though the strategy works in all time frame but it is best used in smaller time frame for regular profit reason
The Way to read the Puria indicative strategy and produce signals
Make sure that all your settings are done properly, and you have added all the required indicators before you can start looking for signals.
For A Buy Signal,
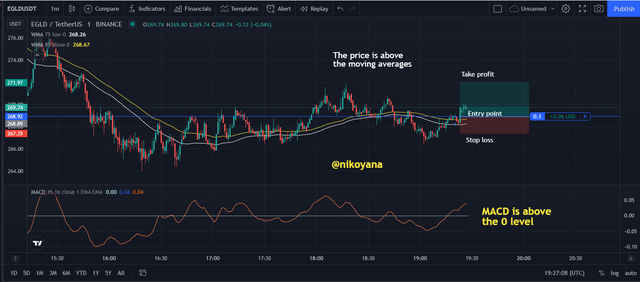
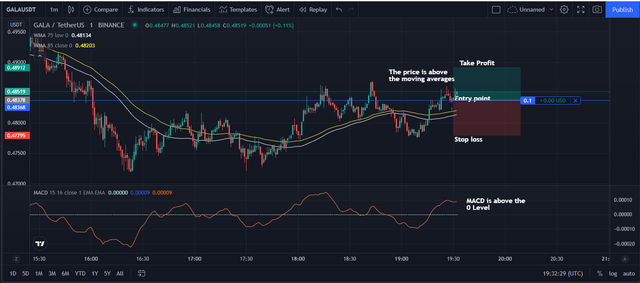
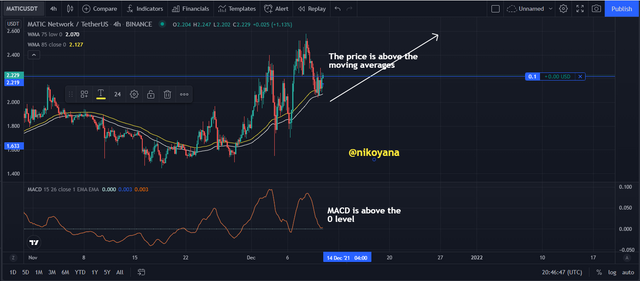
The price needs to be above the both moving averages, therefore the moving averages will be serving as a support to the price while on the side of the MACD, The MACD line should also be above the horizontal line which is an indication of the 0 level. Once you have noticed that this both conditions are in place then you can place your buy order, always remember to apply risk management depending on the amount of risk that you are willing to take. The chart for more understanding can be seen below.

For A Sell Signal
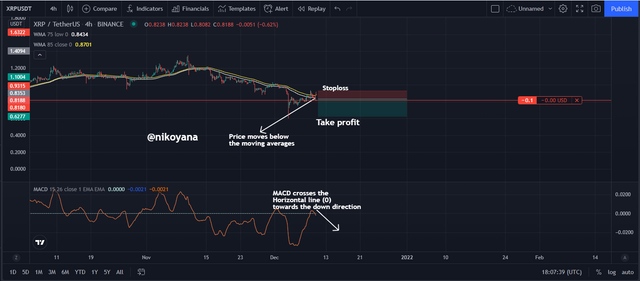
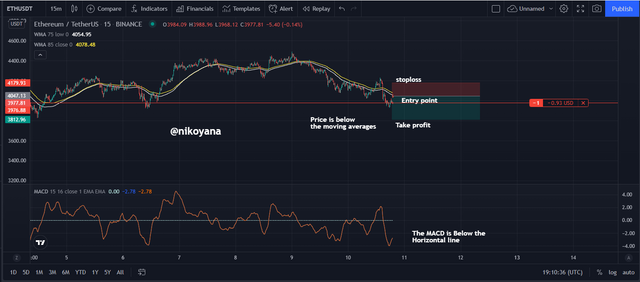
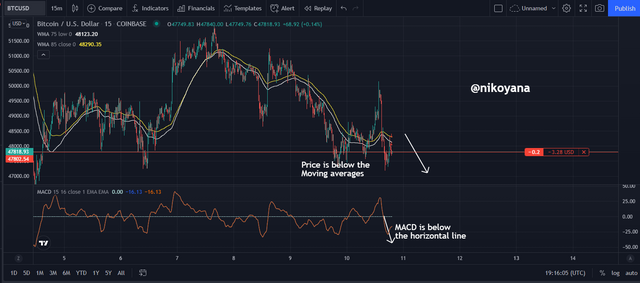
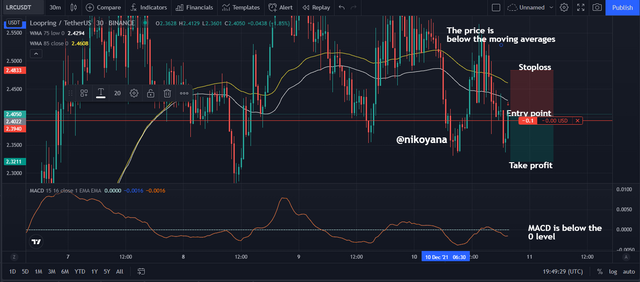
The price needs to be below the both moving averages, therefore the moving averages will be serving as a resistance to the price while on the side of the MACD, The MACD line should also be below the horizontal line which is an indication of the 0 level. Once you have noticed that this both conditions are in place then you can place your sell order, always remember to apply risk management depending on the amount of risk that you are willing to take. The chart for more understanding can be seen below.


2.How to identify trends in the market using the puria method. Is it possible to identify trend reversal in the market by using this strategy? Give examples to support your article and explain them. (screenshot needed)
Another wonderful feature that the Puria Indicative strategy has, is it ability to identify trend, using this strategy, you can easily identify trends in the market, both the bullish and the bearish trend in any time frame and in any market , that is one great feature of the Puria indicative strategy.
Identification of a Bullish Trend
For you to identify the bullish trend using the Puria indicative strategy, firstly your moving averages, the price of the assets in the market must be above the both moving average, this ensures that the price is on an uptrend. But in the case of the MACD, the MACD line must be above the horizontal line or the 0 level in the MACD windows. This shows that the bullish trend is about to begin. This is an indication that the price will go in an bullish direction, and the buyers should get ready to enjoy the bullish trend which will have several higher highs and higher lows. Look below for the screenshot for more understanding of what I have already explained initially

Identification of a Bearish Trend
For you to identify the bearish trend using the Puria indicative strategy, firstly your moving averages, the price of the assets in the market must be below the both moving average, this ensures that the price is on an downtrend. But in the case of the MACD, the MACD line must be below the horizontal line or the 0 level in the MACD windows. This shows that the bearish trend is about to begin. This is an indication that the price will go in an bearish direction, and the sellers should get ready to enjoy the bearish trend which will have several lower lows and lower high.Look below for the screenshot for more understanding of what I have already explained initially.

Is it possible to identify trend reversal in the market by using this strategy?
Identification of trend reversal in the market can also be done using the Puria indicative strategy, both for bullish and bearish trend reversal of price in the market.
Bullish trend reversal
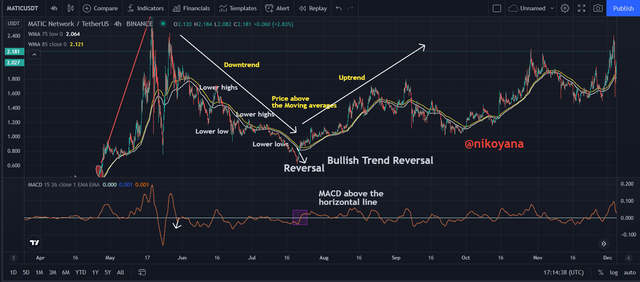
Bullish trend reversal is a situation where the price trend changes from bearish to bullish. In this trend reversal, the initial trend is usually bearish, with price making series of Lower highs and lower lows on a consist basis.
At this point the sellers were in control of the market until they became weak and the buyers took over the market, using the puria indicative strategy how can one detect this. If the MACD line move from below and crosses over the horizontal line, which means that a bearish trend has ended and a bullish trend has began, further confirmation can be using the Moving Averages, if the price moves from below and crosses above the two moving averages then it confirmation is now clear. Showing you a clear bullish trend reversal.
Bearish trend reversal
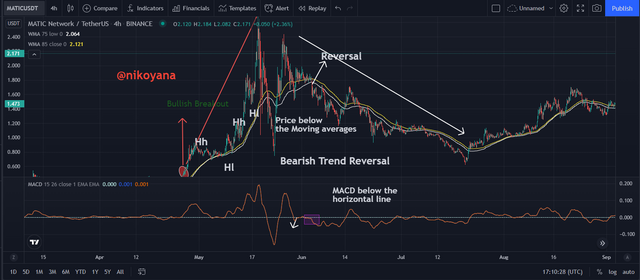
Bearish trend reversal is a situation where the price trend changes from bullish to bearish. In this trend reversal, the initial trend is usually bullish, with price making series of higher lows and higher highs on a consist basis.
At this point the buyers were in control of the market until they became weak and the sellers took over the market, using the puria indicative strategy how can one detect this. If the MACD line move from above and crosses over the horizontal line heading downwards, which means that a bullish trend has ended and a bearish trend has began, further confirmation can be using the Moving Averages, if the price moves from above and crosses below the two moving averages then it confirmation is now clear. Showing you a clear bearish trend reversal.

3.In the puria strategy, we are using MACD as a signal filter, By confirming signals from it we enter the market. Can we use a signal filter other than MACD in the market for this strategy? Choose one filter(any Indicator having 0 levels) and Identify the trades in the market. (Screenshot needed).
I will be using the CCI which stands for Commodity Channel index in place of the MACD in the puria indicative strategy. This CCI can also be used to spot trend and trend changes also. The CCI like the MACD can also give buy entry and sell entry too.
The Popular Analsyt, Mr. Donald Lambert, developed the CCI with it function of comparing the current price with that of the average price. There is a line in the CCI window that oscillates up and down with a range of -100 to +100. The price in the market moves within this range that the CCI have provided.
You can add the CCi and selecting the Indicator bar and search for the CCI and it will pop out.
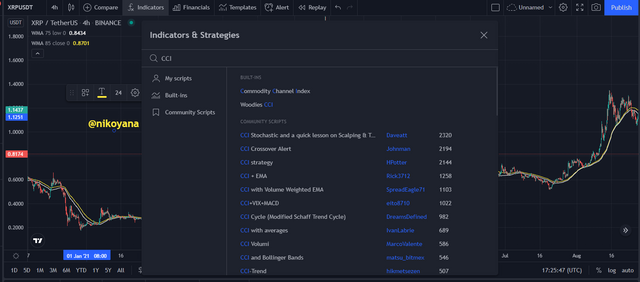
Then once you have selected your the CCI indicator, it will pop out in this format with its own window.
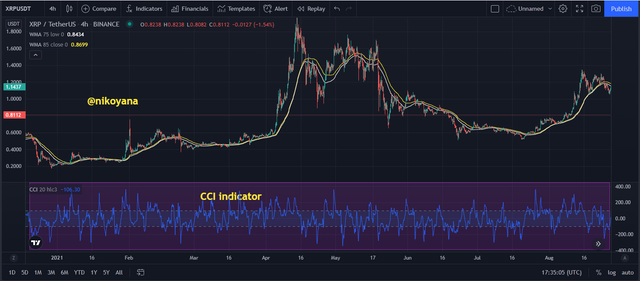
So how can you combine the CCI indicator with the two moving Averages
We are going to look for a proper trade entry for both a buy and sell order, knowing how to use the CCI which replaced the MACD, in combination with the two moving averages.
Buy Order
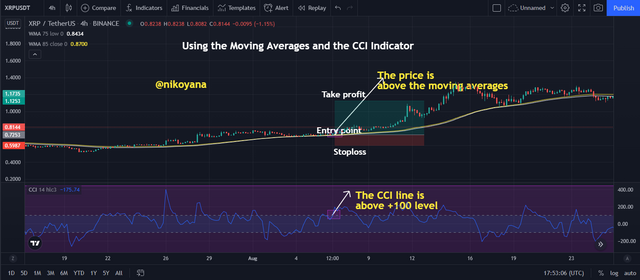
Using the combination of both the moving averages and the CCI indicator is quite easy and simple to use in the market. In the case of Moving averages, the price needs to be above the moving averages, which the moving averages serves a support to the prices while the in the case of the CCI indicator, if the CCI line goes above the +100 level, it is clear sign that the price should be on the bullish trend, if the price is really on a bullish and you have confirmed the trend. With the both combination you can confidently enter a buy order
Sell Order
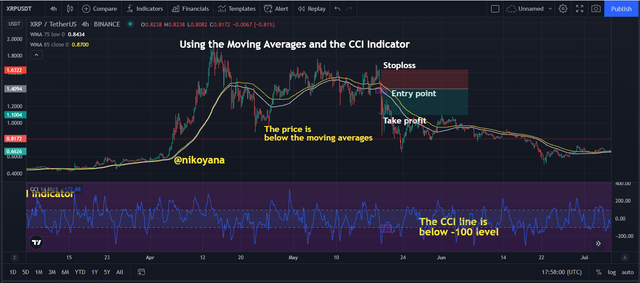
Using the combination of both the moving averages and the CCI indicator is quite easy and simple to use in the market. In the case of Moving averages, the price needs to be below the moving averages, which the moving averages serves a resistance to the prices while the in the case of the CCI indicator, if the CCI line goes below the -100 level, it is clear sign that the price should be on the bearish trend, if the price is really on a bearish and you have confirmed the trend. With the both combination you can confidently enter a Sell order

4.Set up 10 demo Trades (5 buying and 5 selling ) on 5 cryptocurrency pairs using puria method indicative strategy. Explain any 2 of them in detail. Prepare a final observation table having all your P/L records in these 5 trades.
SELL TRADE USING DEMO ACCOUNT
XRPUSDT
ETHUSDT
BTCUSD
LRCUSDT
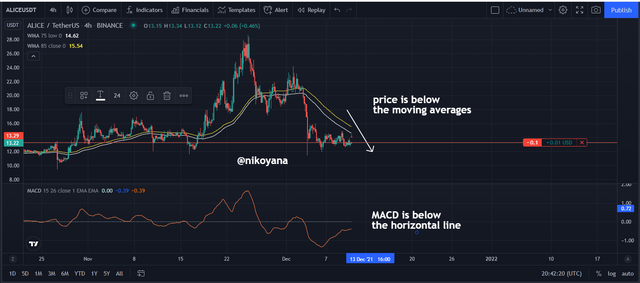
ALICEUSDT
BUYING TRADE USING DEMO ACCOUNT
EGLDUSDT
GALAUSDT
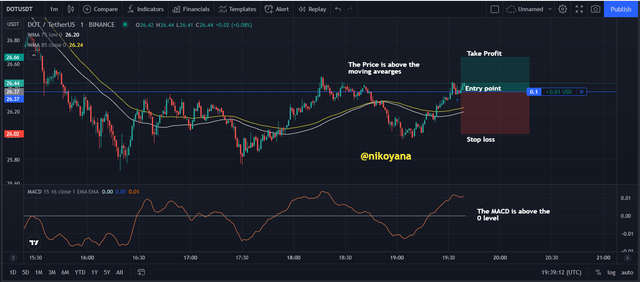
DOTUSDT
MATICUSDT
EXPLANATION OF THE BUY TRADE

From the chart of DOT/USDT, we can see that the price was above the the both moving average, and the on the side of the MACD, the line is above the horizontal line which is clear indication of a buy order, so I placed the buy order with a Previous low of the price which I used as the my stop loss, so from there I used a risk to reward ratio of 1 : 1 to put my take profit.
EXPLANATION OF THE SELL TRADE
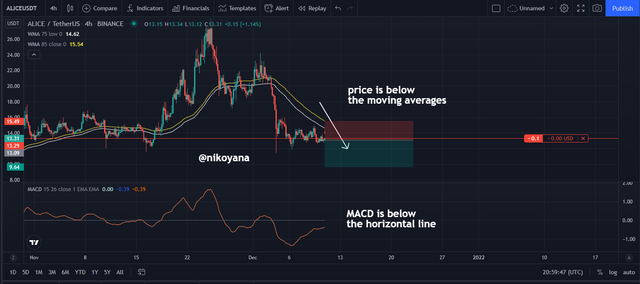
From the chart of ALICE/USDT, we can see that the price was below the the both moving average, and the on the side of the MACD, the line is below the horizontal line which is clear indication of a sell order, so I placed the sell order .I used the moveing averages as my resistance to determine my stoploss so from there I used a risk to reward ratio of 1 : 1 to put my take profit.
Let's behold the table
| Pair | Sell | buy | profit | lose | timeframe |
|---|---|---|---|---|---|
| BTCUSD | 47802.54 | ----- | 5min | ||
| Xrpusdt | 0.8180 | +0.10 | 30min | ||
| ETHUSDT | 3976.88 | ----- | 15mins | ||
| LRCUSDT | 2.3940 | ----- | 10mins | ||
| ALICEUSDT | 13.29 | --- | 5mins | ||
| Maticusdt | 2.219 | ---- | 15mins | ||
| ADAUSD | I.2649 | ----- | 1 HOUR | ||
| GALAUSDT | 0.48513 | 0.05 | 30MINS | ||
| Eegldusdt | 268.92 | -1.02 | 1 hour | ||
| DOTUSDT | 26.37 | +0.10 | 1 min |

Question 5 - You have to make a strategy of your own, it could be pattern-based or indicator-based. Please note that the strategy you make must use the above information. Explain full strategy including a time frame, settings, entry exit levels, risk management and place two demo trades, one for buying and the other for selling
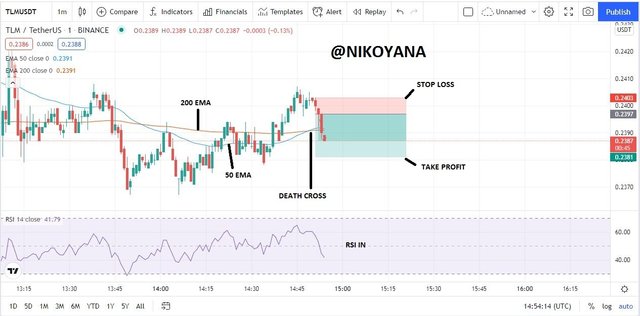
For this question, I will name my strategy REMA which is a strategy formed by 2 exponential moving average supported by an RSI indicator.
Market Concept of REMA Strategy
The rema strategy as I mentioned previously comprises of two EMA and a RSI indicator. the strategy enables quick entries on a short time frame with the help of the 50 EMA and 200EMA we can get good entries. and the RSI also helps to detect fake outs and show signs of over bought and oversold on the market.
TimeFrame Setup
As I mentioned earlier the strategy is great for shorter time frames from 1 - 15mins. giving it a smooth entry and exit indication.
REMA STRATEGY SET UP
first we are familiar withe EMA(exponential moving average). I will be adding, the 50 EMA and 200EMA to the chart
- search for the EMA indicator in the fx indicator and add it to the chart

- click on the setting on the EMA and change the length to 50 and 200 respectively then change the colors to so we do not get confused.


- Then search for the RSI indicator and add it to the chart also
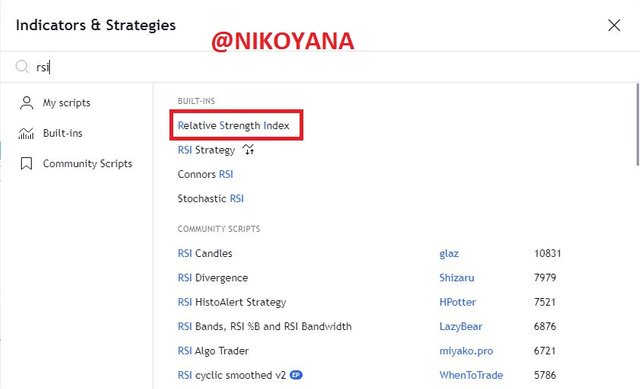
RISK MANAGEMENT
When using the REMA we have to ensure that the we make use of our stop loss to take profit ratio we should ensure to keep the stop loss and take profit at 1:1 to ensure quick entry and exit of the trade but there are exceptions where we see the golden cross(where the 200EMA crosses over the 50EMA) and when we see the death cross (where 50EMA croses over the 200EMA as we can see in the sell trade). we can then go for 1:3 RRR
Entry and Exit using the REMA method
for a buy setup ensure that the 200 EMA is below the 50 EMA and the RSI is moving in an upward direction indicating that it isn't a fake out, place at a very short time frame as you can see mine below, then place your stop loss at 1:1

for a sell setup ensure that the 200 EMA is above the 50 EMA and the RSI is moving in an downward direction indicating that it isn't a fake out, place at a very short time frame as you can see mine below. then place your stop loss at 1:1 remember I gave an exception where we see a death cross or a golden cross. below there is a death cross so we can place our stop loss at 1:3
CONCLUSION
It was an exciting experience although very stressful especially attempting to get the accurate trades. But very educative, this is the second lecture of the professor and I must say he is doing a great work.
the puria indaucative strategy is a very wonderful strategy and has being used by most traders and it t has proven to a great strategy with the amount of profit it has realized so. It confirm trend, and also trend reversal stop.
One part I enjoyed mostly was the formation of my own strategy named REMA. and I feel it is a strategy you all should try it is very helpful and cool. Thank you all for reading my post.
IMAGE REFERENCE: tradingview
CC
@utsavsaxena11
