I am happy that it is the last week for this season 5 and it was an excellent lecture delivered by the professor. I will be answering the homework post based on my understanding. I hope you also learn and enjoy reading.


1. What do you understand by ultimate oscillator indicator. How to calculate ultimate oscillator value for a particular candle or time frame. Give real example using chart pattern, show complete calculation with accurate result.

The Ultimate oscillator, has shown better accuracy compared to other oscillators and will predict price movement more accurately on a price market.
With the Ultimate oscillator, you can establish the momentum of an asset’s up and down movements and analyze their relationship with past performance. We know that markets always rise and fall on the ups and downs of supply and demand, with greater demand driving prices higher. More supply will cause falling prices for a given asset. The indicator identifies the difference between market swings as it shows which is dominating at any single moment: bullish or bearish.
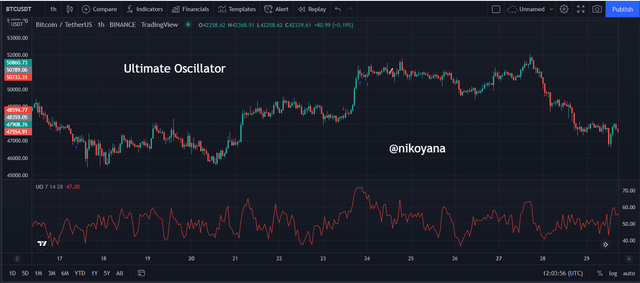
Diverse price fluctuations should be no problem thanks to Ultimate. It has a completely unseen and unprecedented algorithm and represents the ultimate and irreversible shifts in market trend. Offering both short-term and long-term views, the momentum of the market is evident because it withholds each transition from start to finish.
This oscillator is different because it can combine three previous periods to tell us the direction of its line. It usually only uses the previous period unlike the others which use only one. This new indicator Ultimate oscillator is more accurate and precise than other oscillators because it bases on median values of 7, 14, and 28-periods. With this oscillator we get better signals.
With different indicators, you can find buy and sell signals, such as the ultimate oscillator. During a buyoff condition, when this line is above level 70 on the chart, traders can believe that stocks have been bought heavily. Once this indicator lines up in a certain area, it's an indication to place a sell order.
An oversold zone exists on the chart when the trend lines for this indicator are below 30 or below. It’s time to buy and close any open sell orders at this point on the chart, as traders think that it's time to move higher.
we can use Divergences to place orders, but we could also just trade using the Ultimate oscillator without looking for divergences. We usually have to analyze how it's used because it's one of the most used techniques with this indicator
CALCULATION FOR THE MAXIMUM VALUE OF THE ULTIMATE OSCILLATOR INDICATOR
Let's start with explaining what BP and TR means before listing out their fomular
BP: is the buying pressure applied to the candle
TR: is the true range of prices that were presented in that period
where BP = candlestick close - candlestick low and TR = candlestick high - candlestick low
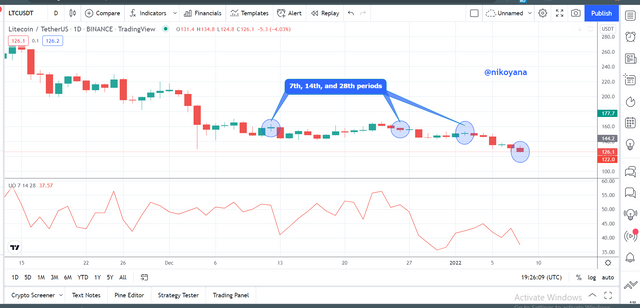
The data was manually collected by me and i configured the data using my excel sheet
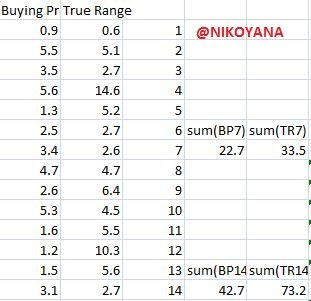
below is the screenshot for the first 14 periods with their summation
for the next 14 periods to make up 28 periods below is the screenshot
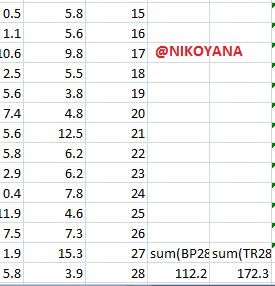
The summation of the values where calculated using excel as seen above. below is the formular to calculate the oscillator
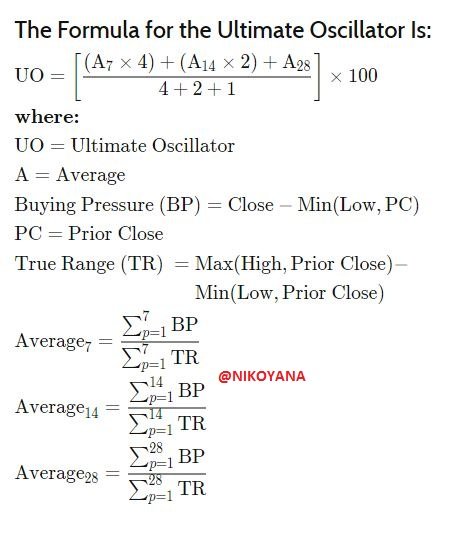
now let's calculate A7, A14 and A28
For A7
so therefore we have Bp7/Tr7
22.7/33.5= 0.6776
A7 = 0.6776
For A14
so therefore we have Bp14/Tr14
42.7/73.2 = 0.5833
A14 = 0.5833
For A28
so therefore we have Bp28/Tr28
112.2/172.3 =0.6512
A28 = 0.6512
Inputing the values inside the formular
UO = (((A7 x 4) + (A14 x 2) + A28 )/ (4 +2+1) ) x 100
UO = (((0.6776 x 4) + (0.5833 x 2) + 0.6512) / 7) x100
UO =(( 2.7104 + 1.1666 + 0.6512 ) / 7) x 100
UO = (4.5276 / 7) x 100
UO = 0.6468 x 100
UO = 64.68

2. How to identify trends in the market using the ultimate oscillator. What is the difference between the final oscillator and the slow stochastic oscillator?

No complicated indicators, such as the Ultimate oscillator, are needed to identify trading trends on a japanese candles chart. With some practice and patience, one can identify when an asset is overbought or oversold.
FOR A BULLISH TREND
Let's analyse the chart on a BTC/USDT with a 1min time frame

To analyze the momentum's direction, we should wait for the Ultimate oscillator to cross the oversold zone and enter the overdone zone, at that time we will know that having enough sellers and buyers. At this point we will get a signal when it moves below 30. The demand increases causing traders buy orders to be executed. Price reacts by rising because of the increase in demand in the market.

Our strategy combines different fundamental approaches into one, constant oscillator. Since it monitors over a wide range of timeframes, the Ultimate Oscillator needs a trader who is ready to interpret market dynamics and have a longer term perspective. Let's take a look at the chart above on a 1hr time frame
FOR A BEARISH TREND
We will observe the BTC / USDT trading pair on a 1 minute time frame. As we can see, the first thing that is identified is the Ultimate Oscillator in the overbought zone. This momentum towards the overbought zone causes prices to fall again, making a downtrend. This only us

With the sign, the impulse of the oscillator decreases until it finally drops its levels to head down. Traders note this sign and hurry to open profitable orders to exit their positions as soon as possible

Recent BTC/USDT consolidation made it to the same price zone but in 1 Hr. the market made an overbought as we can see on the chart which is a condition which signifies that buyers have been satisfied while sellers are still active.
A COMPARISON BETWEEN Slow Stochastic Oscillator and ultimate oscillator indicator
First I will have to add the indicator to the chart in order to make a comparison.

Utilizing the Ultimate oscillator will allow for a trader to measure both bearish and bullish impulses in the market, using it almost identically to the slow stochastic oscillator. If oscillator levels are below 20; we are in an oversold region and if we see high axes of 80; we are in an overbought region.
Trading at these levels also change, which is why we can buy and sell orders in this area. These levels, similar to the chart's Ultimate oscillator, happen to change concurrently with divergences at the same time. What makes them different (apart from the levels) are the different data that they analyze, it will work out thus for this indicator only 14 periods averaging period of his calculations.
Added to that, there are some units that we must take into consideration
1. K%:
%K compares the ratio between the closing prices with the lowest ones in the 14 periods with the lowest level, it's worth noting that the difference value is divided by the difference between high and low. This final result will then be multiplied by 100.
2. D%:
%D simply is a simple moving average of only 3 periods. I find that the Ultimate Oscillator indicator provides much more accurate signals than the slow stochastic oscillator because this one, using only 14 periods, it's very inefficient, rendering many of these signals meaningless.
Trading with Ultimate oscillator is reliant on the specificity of the signal's direction. Although it might not require as many trendfollowing signals as other, leading oscillators such as Dawson Dawson, The Ultimate oscillator can provide more precision. To strengthen the trade, additional indicators should be used to separate false signals from true ones.

The figure above shows that the number of buy and sell signals generated by the slow stochastic oscillator is bigger, having even more sensitivity. Hold signals for sale appear in the top area of the both indicators while buy signals appear in its bottom area.

3.How to identify the divergence in the market using the final oscillator, if we cannot identify the divergence easily, then which indicator will help us to identify the divergence in the market.

There are mainly 2 types of divergene
- A Bullish Divergence is a situation in which there is a bearish trend, but the underlying sentiment revealed by the indicator reveals less sellers pressure. This reflects satisfied supply and it’s time to satisfy the existing demand.

On the chart of the BTC/USDT on a 1minute time frame, we can see the divergence as there is a bearish trend on the chart but the indicator shows a divergence showing there is less pressure from the sellers at the moment
- A Bearish Divergence is a situation in which there is a bullish trend, but the underlying sentiment revealed by the indicator reveals less buyer pressure. This reflects satisfied demand and it’s time to satisfy the existing supply.

On the chart of the BTC/USDT on a 1minute time frame, we can see the divergence as there is a bullish trend on the chart but the indicator shows a divergence showing there is less pressure from the buyers at the moment
CONFIRMING THE DIVERGENCE WITH SUPATREND
BULLISH DIVERGENCE CONFIRMATION

The oscillator will create a bullish divergence signal, starting with a low region to a higher region on the Ultimate oscillator. We can see this with a 1minute time frame combination trade for BTC/USDT in the charts. We later see an increased momentum reading from the SupaTrend graphics, following along with a long trend down-trending with little price variation. The oscillator culminated with an upside buy signal at the time of reversal as seen by the Supa Trend
BEARISH DIVERGENCE CONFIRMATION
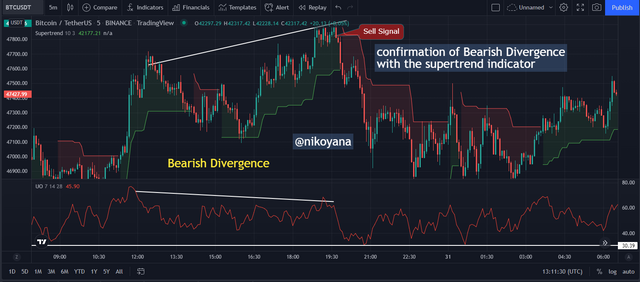
The oscillator will create a bearish divergence signal, starting with a high region to a lower region on the Ultimate oscillator. We can see this with a 1minute time frame combination trade for BTC/USDT in the charts. We later see a decreased momentum reading from the SupaTrend graphics, following along with a long trend up-trending with little price variation. The oscillator culminated with a downside sell signal at the time of reversal as seen by the Supa Trend

4.What is the 3-step approach method through which you can enter and exit the market? Show real example of market entry and exit.

To identify which type of ordering to take, it's critical that we first establish a level for overbought/oversold conditions. These should be set as a percentage between 30 and 70%.
MARKET ENTRY
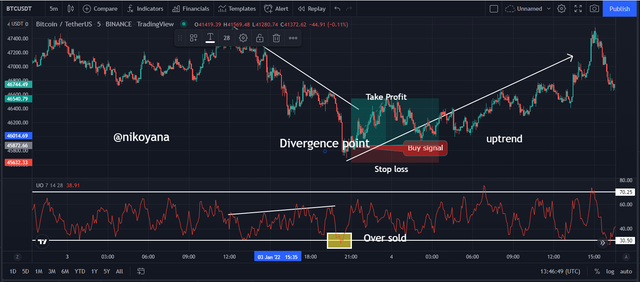
With the help of Ultimate oscillator’s, we see an uptrend has begun. The green arrow indicates that divergences are being created which are typically followed by new highs.
When the Ultimate Oscillator swings under the 30 mark, it is time to buy. If this occurs, this implies that prices are rebounding, leading to a reversal in the market.
Finally, the Oscillator Ultimate difficulty indicator must be in the area where it is overbought, above level 70.
MARKET EXIT
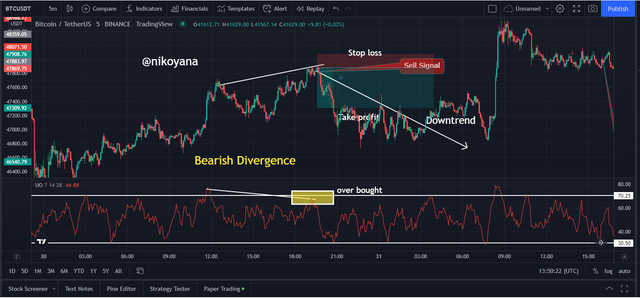
With the help of Ultimate oscillator’s, we see a downtrend has begun. The arrow indicates that divergences are being created which are typically followed by new lows.
When the Ultimate Oscillator swings above the 70 mark, it is time to sell. If this occurs, this implies that prices are rebounding, leading to a reversal in the market.
Finally, the Oscillator Ultimate difficulty indicator must be in the area where it is oversold, below level 30

5. What is your opinion on the Ultimate Oscillator Indicator? What time period would you prefer, how to use the ultimate oscillator and why?

It isn't totally bad from my angle but one of the few negative points is that it has few trading signals. Some traders will find that understanding the divergence is more important than the price action.
When trading with the ultimate oscillator, you’ll receive very few signals as well as many of the small reversions that aren’t caught. However, this lack of sensitivity provides it with better specificity because there are few signals present even when we use time frames greater than 30 minutes.
I recommend a tradeframe of 1-5 minutes with default chart settings for daily trading, since the signals become scarce as the timeframe increases. If we want to use higher timeframes and identify signals then we will require the help of other indicators such as RSI or Slow EMA to help us along.
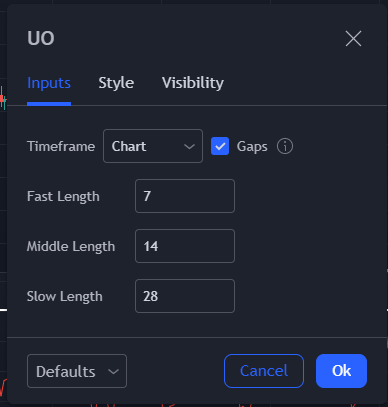
With the sensitivity of the indicator extended, we changed the parameter settings to value of 4,8 and 16 for period of time frames.
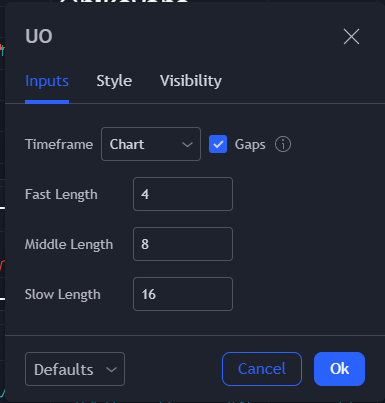
let's see the screenshot below
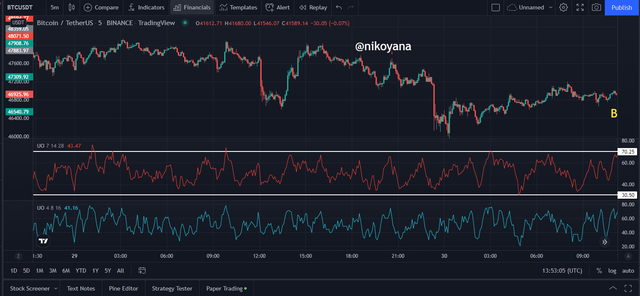
the BTCUSDT chart on a 5minute time frame showing the indicators with the two different settings where the one up is the default setting and the one down is the amended setting


The Ultimate Oscillator is an efficient, high specificity indicator which can be used while trading. As we learned in the class, there are various levels listed from 1 to 100, but what counts for buy or sell signals are the levels of 70 and 30. As long as line is below level 30, it's in oversold state which means that sellers are selling too much of the asset. Whereas if line is above level 30, it's in overbought state with buyers over-buying
The Ultimate Oscillator is a charting and trading indicator proposing support and resistance levels for an asset's price. It can be used as leading indicator to figure out buy or sell signals. These oscillations are at their best when plotted over monthly charts with an interval of 7, 14, 28 for daily charts.
thanks @utsavsaxena11

IMAGE SCREENSHOT REFERENCE: tradingview and microsoft excel

Downvoting a post can decrease pending rewards and make it less visible. Common reasons:
Submit