.png)

(1) Meaning of Harmonic Trading

During every events which takes place in a market (trade, cycled, signals) when they occur overtime or when they occur in repetition this form of trade is know as Harmonic Trade.
Therefore, Harmonic Trade is defined as the occurrence of several events which take place in a market. These events can be market cycles (bullish or bearish cycle), market signals or even market patterns. Once it occurs overtime or constantly without any changes it is a Harmonic Trade.
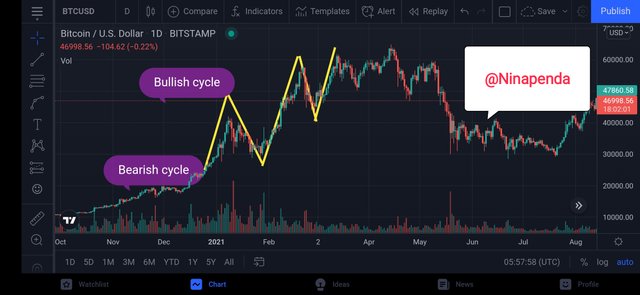
For example: In the crypto world, during the rise of a coin at the bullish cycle, once this occurs again followong another event of a bullish cycle (highest price) this is a clear example of a Harmonic Trade.

(2) Defineand Explain what the pattern AB=CD is and how can we identify it

The Harmonic Pattern AB = CD helps in the formation of wave movement of of a market. They're characterized by four (4) movements which can be commonly seen or witnessed when viewing a market trend. Harmonic Pattern originally were first brought into existence by Harold McKinley Gartley.
The wave movement is formed by A, B, C, D and this can be used in the explanation of either Bullish Cycle or a Bearish Cycle. These patterns are always obvious when observing every market trend. The A, B, C, D patterns are always present when one is analyzing a market trend of a particular asset or a coin. The analysis of a market using the Harmonic Pattern AB=CD is made possible and effective because it deals with the price changes.
Harmonic Trade (there is always a tendency that there is a reoccurrence of events that have taken place in a market before). So if I'm making an analysis now, I'll have to study events that have taken place in that particular asset's market so as to know the next thing that will occur since it is a Harmonic Trade.
The Harmonic Pattern AB=CD is affected by the Price actions or current market price of that particular asset at that point in time. Market plans or strategies can be made or mapped out with the use of these patterns.

How to identify the AB = CD pattern
Well, with regards to the trading chart of a particular market at s specific time, the AB = CD pattern can be identified there. This pattern can be categorised into two (2) forms and they are: AB = CD Bullish and AB = CD Bearish.
• AB = CD Bullish
After the occurrence of a bullish cycle, a fall in market occurs (bearish cycle). During this market event, after a bearish cycle comes another bullish cycle. To be able to take note or observe a next bullish cycle, a fall of market price must take place. At this point, the A, B, C, D movement is taken note of during the occurrence of a price fall as shown below.
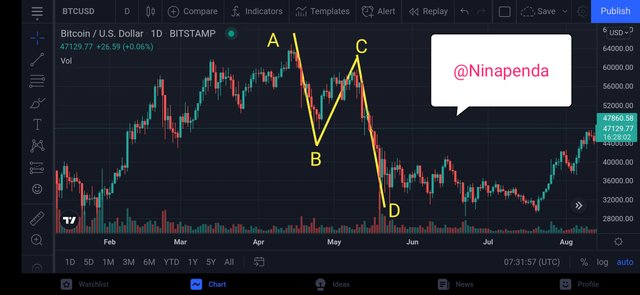
With the use of Fibonacci Retracements I'll like to explain the meaning of the A, B, C, D pattern with regard to a trading chart which I'll show its picture below.
• The movement from A to B is always the first ever movement. As shown below, there is usually no other movement that is occurring other than movement A or movement B.
• Normally, point C is always lesser in the s trading chart than in point A because the market price is trying to rise gradually.
• Point D, which is the last movement is seen to move down more. Using the Fibonacci Retracement there is a certain range of percentage at which it is meant to be as shown below in the trading chart.
• AB = CD Bearish Cycle
A preceding bullish cycle (rising market price) leads to a bearish cycle. Therefore for you to be able to observe or identity the next bearish cycle, there must be an increase or rise in the price of an asset. The A, B, C, D movements are being taken when the market is currently in a bullish cycle as shown in the trading chart below.
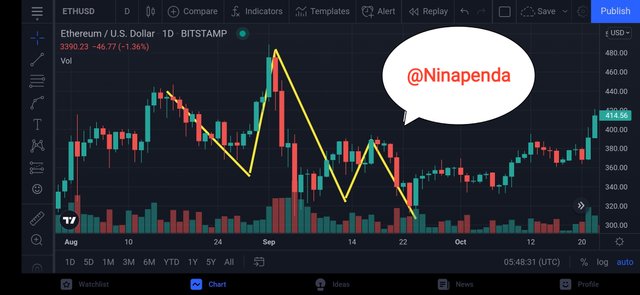
With the use of Fibonacci Retracements to explain the event or pattern happening, I'll also show the trading chart diagram below in a pictorial form.
• During the movement of A and B, no other form of movement is happening now. This means that the only movements occurring during that market phase are just A and B.
• In the Bearish AB = CD, point C is normally higher or more than point A in a trading chart. It can be confirmed from the trading chart that is shown below.
• Concerning Fibonacci Retracements, point D is usually around 127.2% to 161.8%.


(3) Clearly describe the entry and exit criteria for both buying and selling using the AB = CD pattern?

• Buy & Sell (entry criteria)
• The initial move to be taken is to identify if the price is rising (bullish cycle) or falling (bearish cycle).
• Next, study the four (4) movements A, B, C, D to know the next step to take.
• When observing the point C and point D, if its movement is corresponding with that of Fibonacci Retracements that is, it is between 61.8% and 78.7% and the movement D is between 127.2% and 161.8% then the pattern is very necessary or useful since it corresponds to Fibonacci Retracements.
• Since the pattern corresponds to Fibonacci Retracements, we can now either decide to buy or sell since we can analyze from there with the events that have occurred before in the previous market cycle.
• Buy & Sell (exit criteria)
• Firstly, identify your movement D to know what market phase are you in whether it is a bullish cycle or a bearish cycle.
• Set a stop loss and ensure that the stop loss ranges from 2% and above and must be below the movement D.
• Always ensure that your profit target is usually placed at a profit risk of 1 to 1. In other words, this means that any risk below 2% and above 2% our movement D, the profit target is always 2% away from it.

Make 2 entries (Up and Down) on any cryptocurrency pair using the AB = CD pattern confirming it with Fibonacci.

BUY TRADE
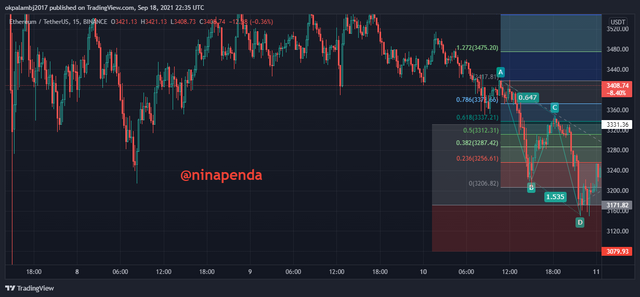
In the trade above, we identified the necessary points, and then using the Fibonacci tool we confirmed the trade and then we took a buy trade setting stop-loss below point D and then target point C and we saw price move up from there to give us what we see below
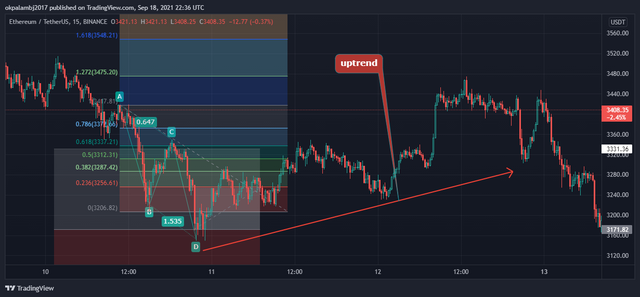
SELL TRADE
We identify the four points necessary and then using the Fibonacci tool we confirm that the different points meet the necessary requirements and we took a trade as seen below
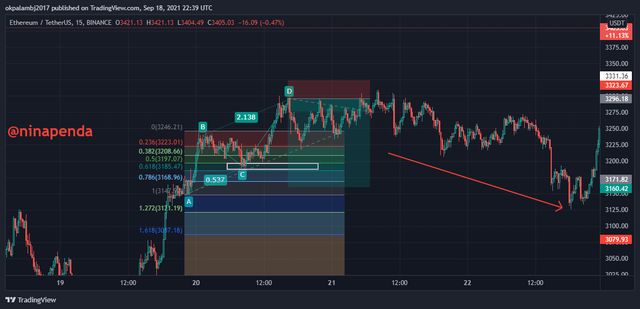

CONCLUSIONS

Harmonic Patterns are very useful because it notifies a trader before a price change of an asset occurs in a market. It is always important to understand the use of Harmonic Patterns to predict or analyze the next event which will take place in the market since it is a
Harmonic Trade and repetition are likely to occur.
Harmonic Patterns are very useful in financial markets and they can be used any time a trader feels like using them.
Thank you Prof. @lenonmc21 for this wonderful assignment you've given to us
This post is yet to be voted @steemcurator02
Downvoting a post can decrease pending rewards and make it less visible. Common reasons:
Submit