
INTRODUCTION
In trading of crypto assets, the use of indicators helps traders to better forecast the likely price movement of the chart. Although they may differ in terms of precision, various indicators have been developed by expert traders over the years that are suitable for either long term or short term trading. These indicators are differ in terms of complexity so it is advisable to choose an indicator that suits your trading style/level.
Some of the popular indicators used by crypto traders around the world include the Relative Strong Index, the Moving Averages, the Fibonacci Retracement and the Bollinger Bands. In this article, we would be taking a closer look at the Bollinger Bands and what it entails

WHAT ARE BOLLINGER BANDS?
Like many indicators out there, Bollinger bands rely on others such as the moving average in order to work effectively. It was developed by the renowned John Bollinger and are essentially two bands that envelopes the moving average price of a chart with each band serving as either the support and resistance or even trend indicator.
They look like a tunnel and most of the time, the price falls within its two bands. It is therefore very useful in predicting market volatility since a price movement outside these bands could result in a breakout. As the "tunnel" becomes narrower, price consolidation occurs which is usually a precursor for market volatility.
And although Bollinger bands are not always conclusive but they are a good way to predict the market conditions.
As mentioned earlier, the Bollinger bands work hand in hand with the moving average. So before we can create these bands, we must first ascertain the moving average of the asset. This is done using the formular below.
The moving average of the price can be calculated using the prices from 15 to 20 days. However, it is ideal to use the sum of prices over 20 days as suggested by John Bollinger in order to arrive at a more precise value.
Now that we have our moving average, it now becomes easy to build our Bollinger bands. This consists of 3 lines with the moving average being in the middle. The other two lines (bands) on the top and bottom indicate the standard deviation of the moving average in the middle and shows the volatility of the market.
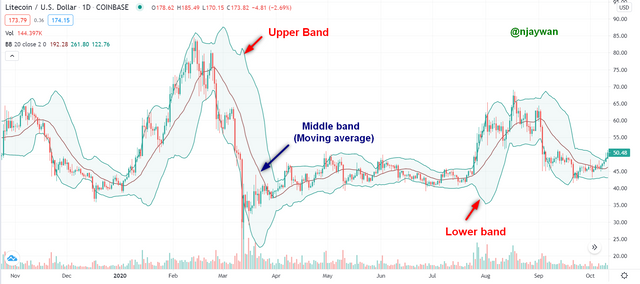
LTC/USD pair (Screenshot: Trading View)
Basically, the closer the top and bottom lines (upper and lower bands), the higher the volatility.
With the moving average, the calculation of these bands now becomes simple.
The upper band is calculated by adding 2 standard deviations from the moving average.
The lower band is also calculated by deducting 2 standard deviations from the moving average.
The number of standard deviations used is dependent on the number of days used for the moving averages. Thus, a 15 day moving average standard deviation is different from that of a 50 day one.
And now that we have our three components (the two bands and the moving average), the Bollinger bands can then be created as seen in the LTC/USD chart below.
Bollinger Bands are also quite useful in predicting the buying and selling pattern of traders and allows us to make informed decisions as to when to start taking profits or when to enter the market.
Overbought & Oversold Situations
- Overbought
A crypto asset is said to be overbought when the price touches the upper band of the Bollinger band. This means that the price is relatively higher which means that traders would start selling shortly. During this period, it is advisable to sell and make some profit before the prices move back towards the middle band.
- Oversold
On the other hand, when the price of the asset touches the lower band or is trading very lower than expected, it is said to be oversold. This situation can be viewed in two ways by an analyst. Here, they can either decide to reduce their position sizes and start taking profit or can see this as an entry point since the price is expected to bounce back towards the middle band.
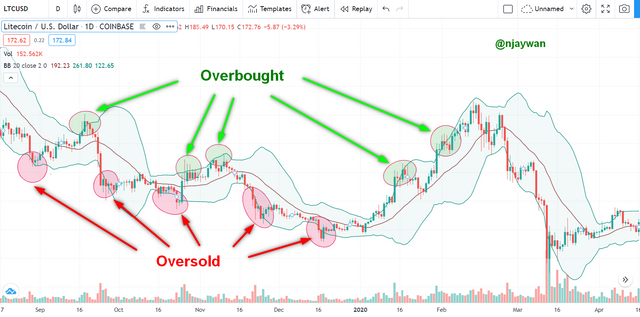
Overbought & Oversold situations in the market (Screenshot: Trading View)
In the chart above, I have highlighted the various points in the market where the crypto asset was oversold in a red ellipse and used a green ellipse for places where it was overbought.
BEST BOLLINGER BAND SETUP
In Bollinger bands prices should mostly stay within the bands and for this to happen these are the preferred calibrations.
The standard deviation is multiplied by 2 and the number of periods for the moving average is 20. The 20 day period is ideal for the best results but you can use a range of days. This would also affect your standard deviation value as a 50 day period would need a 2.5 standard deviation value while a 10 day period would need a 1.5 standard deviation value.
The source should also be closed which means that the moving average will be determined from the candle's closing price. And the zero offset value simply means there are no candles in front of the graph.
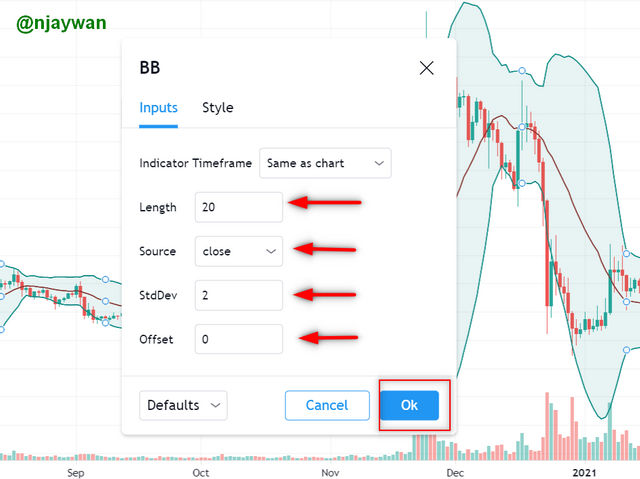
Setting up the Bollinger Band indicator (Screenshot: Trading View)

PRICE BREAKOUT
In crypto trading, price breakouts can either make or unmake you depending on the direction of the breakout. This is because it results in a sharp movement of prices from a rather narrow path.
Before any crypto assets breaks out, the Bollinger bands usually indicate a low volatility in the market. This means that the upper and lower bands gradually become narrower and the price tends to consolidate in that particular region awaiting a catalyst. This is usually in the form of a major economic news.
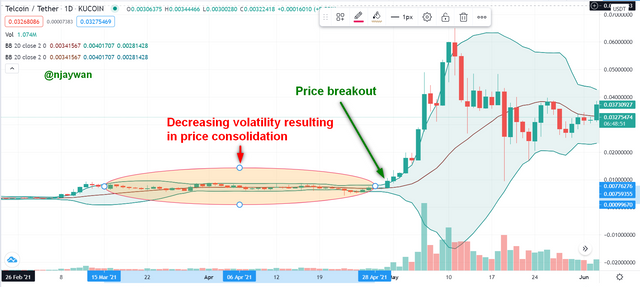
Price breakout seen in the TEL/USD trading pair (Screenshot: Trading View)
From the TEL/USD chart above, we can see the decreasing volatility from 15th March to 28th April, 2021. This also brings about a price consolidation for about a month after which the major outbreak occurred sending it from the $0.0062 to an all time high of $0.064.
Also, during price breakouts, we would mostly see the price movements outside the Bollinger bands.

Predicting Market Trend with Bollinger Bands
A quick look at the Bollinger Bands can also help to identify the market trend and make decisions based on that. This is quite simple since it speaks for itself and involves no further calculations.
A typical example can be seen in the XRP/USD chart below.
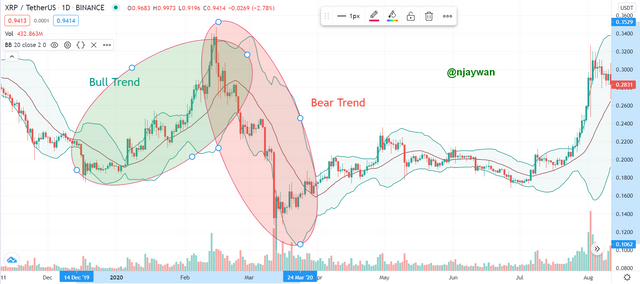
Screenshot: Bull/Bear market trends in the XRP/USD chart
In the screenshot above, we can clearly see the bull followed by a bear pattern in the XRP/USD chart between 19th December, 2019 to 24th March, 2020 with the price ranging between $0.1 to 0.35. For easier identification, I have highlighted the two with red and green ellipses for the bear and bull market trends respectively.
What this means is that the ideal time to have entered this period would have been after the asset was oversold and price touched the lower band at $0.17. There, the buying would have made a great buy and would have had a smooth ride to $0.34 during the bull trend.
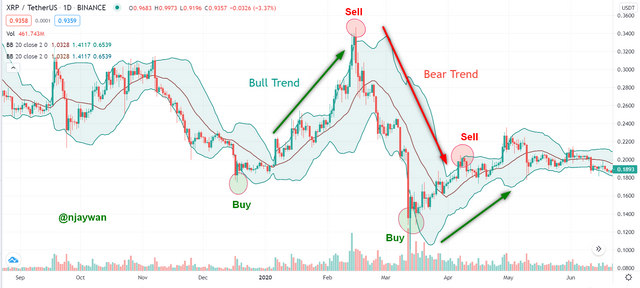
Good entry points for this XRP/USD chart based on market trends
Similarly, after selling during the beginning of the bear trend as indicated by the market overbought state, we can wait for a good entry during the oversold state when the price was now at $0.12. This would then give us ample time to sell when the asset was now overbought at $0.2.

BEST INDICATOR TO USE WITH THE BOLLINGER BAND
At this point it should be clear that the Bollinger Band is not particularly useful alone since it relies on other indicators such as the moving averages. I think a great combination for effective results would be using this indicator with the relative strong index.
This is because, similar to the Bollinger band, the RSI also predicts price action by indicating where the asset was either overbought or oversold. We can therefore expect a more effective results when the two are working hand in hand to yield a better results.
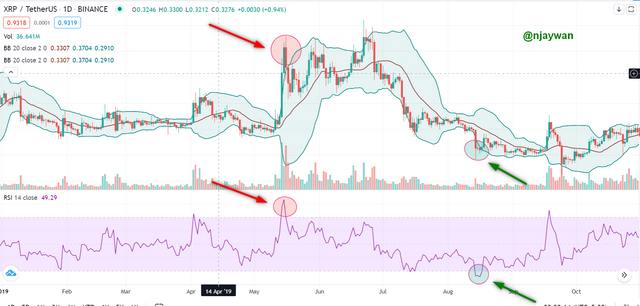
Using RSI with Bollinger bands for effective results (Screenshot trading view)
Considering the XRP/USD chart above, we see in the first instance that when the price moved above the upper band of the Bollinger band, we see the RSI chart showing a value greater than 70 all the way to 85. This shows overbought conditions and the market was likely to fall back down indicating a strong sell.
Also around 14th August, 2019, we see the price of the chart touching the lower band falling all the way to $0.21. At the same time the RSI value fell below 30 down to 26. This also meant that the market was likely to head back up soon indicating an entry zone or buy signal.

BEST TIME FRAME FOR BOLLINGER BANDS
Personally, I think this would vary depending on the kind of trader in question. This is because we have day traders who would prefer a short time frame chart for their technical analysis during the day whiles long term traders would need a longer time frame chart for their analysis.
For a day trader, I would recommend a shorter time frame of either 5 minutes of 15 minutes. This gives you ample time to monitor price movements within the day and make informed decisions as seen below.
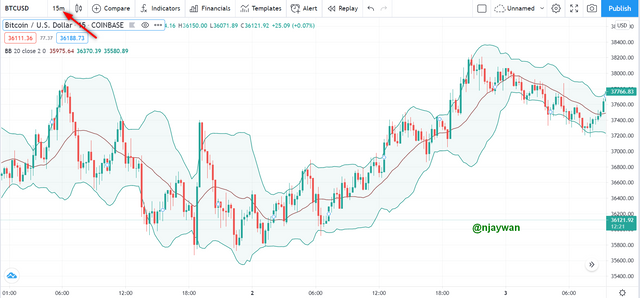
15 minutes btc/usd chart for a short term trader (Screenshot trading view)
And a for a long term or position trader, 1 day or weekly time frame would be ideal. The 1 day time frame would be particularly useful to know the price movements during certain intervals of the week and the weekly time frame would be for traders looking at changes within the month.
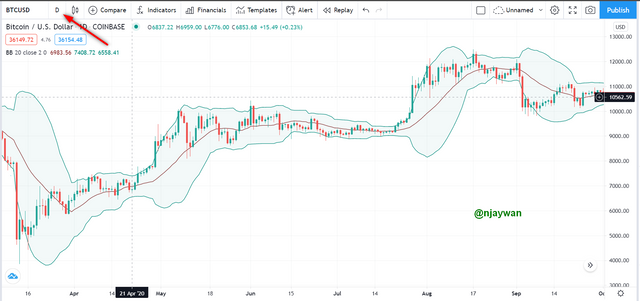
1 day btc/usd chart for a long term/position trader (Screenshot trading view)

REVIEW OF MATIC/USD CHART WITH VARIOUS BOLLINGER BAND INDICATORS
In this review, I have found a MATIC/USD chart I think is ideal for this presentation as there are almost all the signals/occurences you would expect to interpret with this indicator.
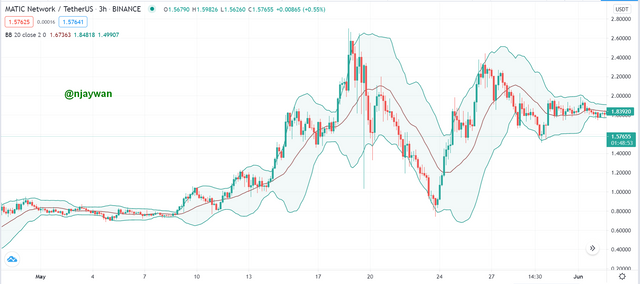
Using Bollinger Bands with MATIC/USD chart (Screenshot trading view)
To start with, you can see at that the chart starts off with a low volatility and an increased consolidation as the upper and lower bands draw closer to each other. This continues for about a week. At this point, we should expect a breakout soon which occurs and sends the price to about $1.05 shortly afterwards.
For a day trader, you can sell at this point and take some profit since the market condition here is overbought. But you can also wait till the upper band is well above the moving average at where I've circled around $1.8. This can be repeated in order to obtain some profits gradually over time.
Some good entry and exit points in this chart based on whether the price was overbought or oversold can be seen below.
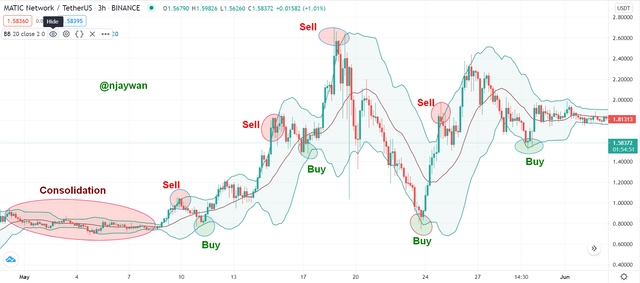
MATIC/USD chart showing buy/sell signals (Screenshot trading view)
In times where there is a wide separation between the upper and lower bands, we see periods of high volatility in the market with sharp price movements. Times like these could either make you some good profits or result in a great deal of loss.
In this situation, I have marked some good entry points for the uptrend and downtrend areas based on the Bollinger Band indicator as well as some good exit point (sell signals).
There is also a market trend reversal after the highly volatile bearish trend (downtrend). This is also a good entry point for traders.
I have indicated the various signals Bollinger band I identified on the chart below.
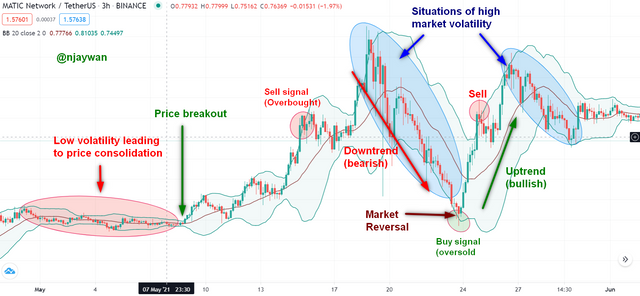
MATIC/USD chart showing various Bollinger band signals (Screenshot trading view)

CONCLUSION
Bollinger bands are very useful to a wide range of traders of any skill level since they are quite user friendly. They allow traders to make decisive choices and enter the market during oversold conditions as well as exit the market at the right time. During the consolidation phase, traders could make a great deal of profit and this is quite clear during low volatility within the Bollinger bands.
Although Bollinger bands are very useful with the moving average, I strongly recommend that it is used in conjunction with other indicators such as the RSI to yield more effective results.

Thank you for your attention.
cc: @kouba01
Hello @njaywan,
Thank you for participating in the 8th Week Crypto Course in its second season and for your efforts to complete the suggested tasks, you deserve a 10/10 rating, according to the following scale:
My review :
An excellent job, well done answering all the questions with great analysis of the charts provided by tracking the price movement of the pair. Following a clear methodology and a set of accurate information enabled you to get the highest score.
Thanks again for your effort, and we look forward to reading your next work.
Sincerely,@kouba01
Downvoting a post can decrease pending rewards and make it less visible. Common reasons:
Submit
Thank you very much.
Downvoting a post can decrease pending rewards and make it less visible. Common reasons:
Submit
Nice presentation I really loved your work.
Downvoting a post can decrease pending rewards and make it less visible. Common reasons:
Submit
Thanks buddy
Downvoting a post can decrease pending rewards and make it less visible. Common reasons:
Submit