
This is a great lecture on defining the major chart pattern that is the head and shoulder pattern. I have a little bit of knowledge about head and shoulder patterns but after attending this lecture, I understand head and shoulder patterns completely and also get the idea about the buy and selling targets using the head and shoulder pattern.

Explain Head and Shoulder and Inverse Head and Shoulders patterns in detail with the help of real examples. What is the importance of volume in these patterns (Screenshot needed and try to explain in detail)
There are three types of technical analyses that are taken into count by traders and investors in order to gain profit from the market. Two analyses are the major ones is fundamental analyses that are based on the crypto news, event, financial statements, and contact enhancements news. The second one is Technical analyses that were done by playing with chart prices, indicators, and chart patterns.
There are several patterns are made by the price on the chart. The patterns predict the expected price movement in the future. Triangle pattern, Cup in handle pattern, and head and shoulder pattern are different patterns that are included in several patterns. In this lecture, we will understand the idea about head and shoulder patterns.
Head and Shoulder Pattern
Head and shoulder pattern formation indicates and predicts the change in a bullish trend. When a head and shoulder pattern is made it indicates that the bullish trend is about to end and a new trend is going to start. In the head and shoulder pattern, there are three main factors. It makes three peaks on the upside. One peak represents the head and the rest of the two peaks indicates the shoulder's peaks.
Now we will understand that how actually head and shoulder pattern is made. The first thing that is made by price is Left Should. It is made my price due to slight pump is a market price and again price goes down. Next, the head is formed. When the price goes down after making the first and left shoulder then again the price moves up and this time price goes more up than the previous left shoulder. Again, the price goes does after making the head peak.
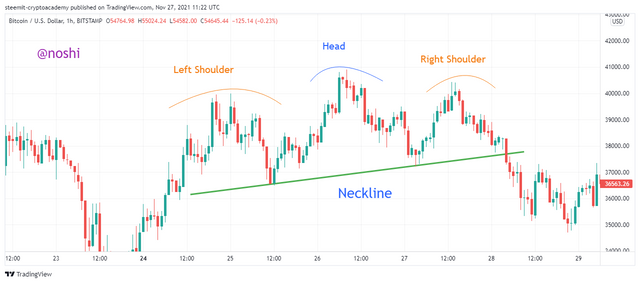
After making head the price goes down at approximately the same down peak level of the left should. Next, the price makes high again but this time price goes up at approximately the peak level of the left shoulder and again price goes down. In the following figure, you can see that head and shoulder pattern is made. I clearly mention left, right shoulders, and head. The lower point of both shoulders is called a neckline.

Inverse Head and Shoulder Pattern
Inverse Head and shoulder pattern formation indicate and predicts the change in a bearish trend. Inverse Head and shoulder patterns indicate that the bearish trend is about to end and a new trend is going to start. Inverse Head and shoulder pattern exactly the same as Head and Shoulder pattern but in opposite direction.
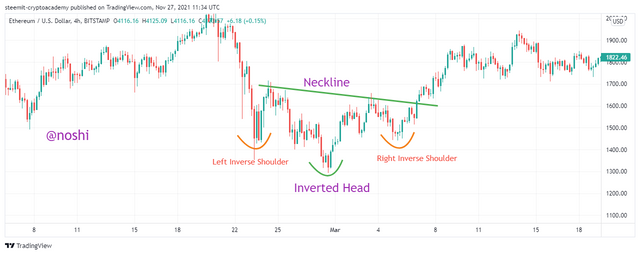
In the above figure, you can see that an inverse head and shoulder pattern is made. I clearly mention left, right shoulders, and head. The lower point of both shoulders is called a neckline. You can see that the same pattern like head and shoulder is made but in the opposite direction

Importance of volume in Making the Head and Inverse Head and Shoulder patterns.
Volume does matter in crypto trading. Volume means the number of traders interested in a particular asset. More the number of traders means the high volume and when few traders are interested in buy and selling means the low volume. When the number of buyers increased in number it indicates the accumulation in price. On contrary, when the number of sellers is higher than the number of buyers, it indicates the distribution in price.
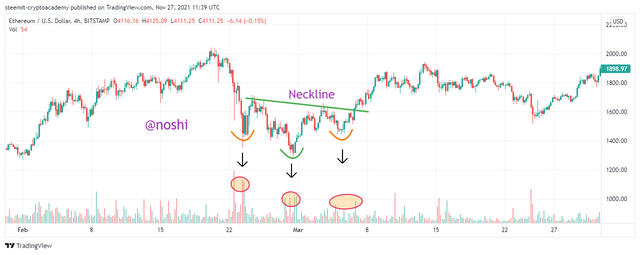
Volume plays an important role in the formation of head and shoulder patterns. When the price goes in Head and shoulder pattern for three times to the formation of Head, Left and right shoulder the volume is high. It indicates the number of buyers is increased. When the price goes down at left should low and right shoulder low, it indicates the low volume in the market you can check all the details in the above figure. The same behavior but in opposite direction is indicated by the inverse head and shoulder pattern.

What is the psychology of market in Head and Shoulder pattern and in Inverse Head and Shoulder pattern (Screenshot needed)
Head and Inverse head and shoulder patterns indicate that the current trend of the market is going to end. It is not correct all the time but, in most cases, it indicates the end of the current trend. When the Head and Shoulder pattern is formed, it indicates that the bullish trend is about to end. When Inverse Head and Shoulder pattern is formed, it indicates that the bearish trend is about to end. Now we will understand the psychology of both patterns.
Psychology of Head and Shoulder patterns
The Head and Shoulder pattern indicates the bullish trend. There are three peaks are made by the price in an upward direction. One is called the left shoulder and the middle one is called the head that is higher than the previous left shoulder. And the third and last shoulder at the right side is approximately equal to the left shoulder. The Low point of both shoulders is connected through a trend line. When price cross this neckline downward direction it indicates that the trend is changed.
The price is going up when the first left shoulder is formed. It indicates the high volume and the number of buyers more in number than sellers. When it reached a certain high point, the distribution starts, and the price goes shown. It indicates the low volume of buyers and high volume of sellers in the market. Due to the low price at left shoulder low, more traders and investors are attracted by the price. In this way, buying is start again and the price again goes up and makes high higher than the previous left shoulder high.
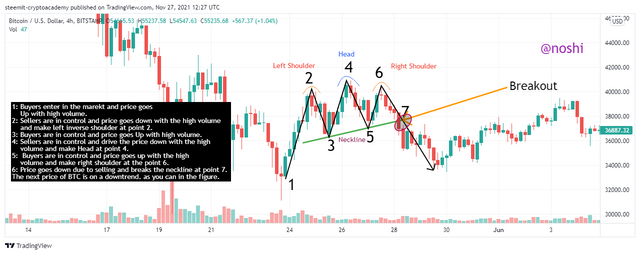
Price goes up due to the high volume of buyers in the market. After making the head, the price again moves down to selling pressure. It indicates the low volume of buyers and high volume of sellers in the market. Price goes down approximately the level of the left shoulder then gain move upward direction due to high volume. In this way, the volume plays an important role in making the head and inverse head and shoulder patterns.
You can see in the above figure, that when the price goes down the volume is high and when the price goes up for both shoulders high the volume is high and when the price goes down both shoulders low the volume is low.

Psychology of Inverse Head and Shoulder patterns
The inverse Head and Shoulder pattern indicates the bearish trend. There are three peaks are made by the price in a downward direction. One is called the left shoulder and the middle one is called the head that is lower than the previous left shoulder. And the third and last shoulder at the right side is approximately equal to the left shoulder. The high point of both shoulders is connected through a trend line. When price cross this neckline Upward direction it indicates that the trend is changed and price up.
The price is going down when the first left shoulder is formed. It indicates the high volume and the number of Sellers more in number than buyers. When it reached a certain low point, the price goes up. It indicates the low volume of sellers. Due to the high price at the left shoulder high, more traders and investors are attracted by the price for gaining profit. In this way, selling starts going down again and makes lower low than the previous left shoulder low.
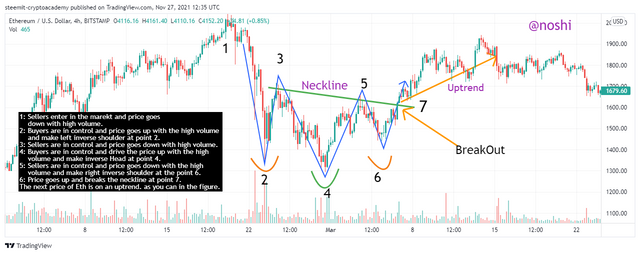
Price goes down due to the high volume of sellers in the market. After making the lower head, the price again moves up due to buying pressure. It indicates the low volume of sellers and high volume of buyers in the market. Price goes up approximately the level of the left shoulder then gain move upward direction due to high volume. This is the psychology of inverse head and shoulder patterns.

Explain 1 demo trade for Head and Shoulder and 1 demo trade for Inverse Head and shoulder pattern. Explain proper trading strategy in both patterns separately. Explain how you identified different levels in the trades in each pattern (Screenshot needed and you can use previous price charts in this question)
In the previous question, we have studied the formation of head and shoulder patterns. In this question, we will learn how to trade with head and shoulder patterns. First, we will learn that how to trade in head and shoulder patterns.
Trade with head and shoulder pattern
In this pattern first, we will be observed that the market is on an uptrend and make the left shoulder then the head is made that is higher than the highs of both shoulders and at the last, the right shoulder is formed. Next, we will connect the lows of the shoulders with the line. This line is called a neckline. If this pattern is formed, it indicates that the uptrend of the market is about to end. When price breakout the neckline, it is the entry point.
Take Profit
When price breaks out the neckline, then the price goes down with high volume. That is why we can set our take profit level after a few calculations.
Difference = Head Peak – Shoulder Low
- First, we subtract the value of either shoulder low with the value Head peak value.
- Subtract this Difference to the neckline value. The result is our Take profit level.
Take Profit = Neckline – Difference
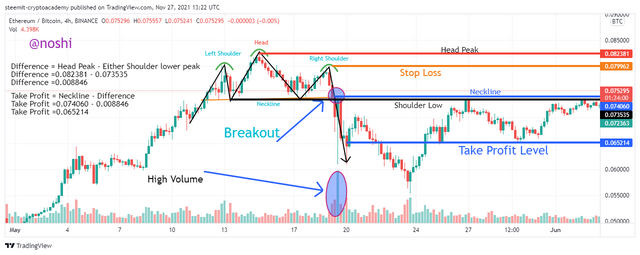
In the above figure, you can see that all the point related to the calculation is mentioned. I mention all the points that are about Head High, Shoulder Low, and neckline. All the prices are mentioned in the figure,
Stop Loss
The stop is applied slightly upside of right shoulder high. It depends on your risk-taking. You can set your stop loss level around the right shoulder high point according to your risk-taking capacity and your risk and reward ratio.
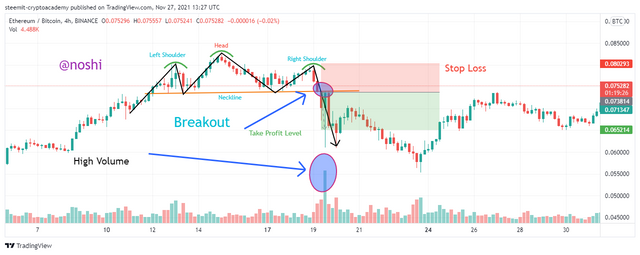
In the above figure, you can see that I place a sell order with the stop loss and take profit level. My entry point is $0.073814, Stop Loss level = $ 0.080293 and Take profit level is $0.065214. All the calculations are mentioned in the figure, you can check them. At the time of break out the volume is high that indicates the pattern is right and it is the right breakout.
In this way, we can trade using the head and shoulder patterns.

Trade with Inverse Head and Shoulder pattern
In this pattern first, we will be observed that the market is on a downtrend and make the left shoulder then the head is made that is low than the lows of both shoulders and at the last, the right shoulder is formed. Next, we will connect the highs of the shoulders with the line. This line is called a neckline. If this pattern is formed, it indicates that the downtrend of the market is about to end. When price breakout the neckline, it is the entry point.
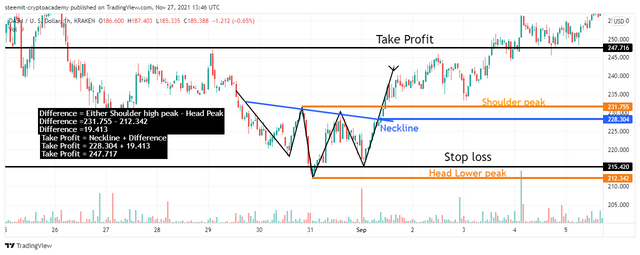
In the above figure, you can see that all the point related to the calculation is mentioned. I mention all the points that are about Head Low, Shoulder Lows and highs, and neckline. All the prices are mentioned in the figure.
Take Profit
When the price breaks out the neckline, then the price goes upward direction with high volume. That is why we can set our take profit level after a few calculations.
Difference = Shoulder High – Head Low
- First, we subtract the value of either shoulder High with the value of Head peak low value.
- Add this Difference to the neckline value. The result is our Take profit level.
Take Profit = Neckline + Difference
Stop Loss
The stop is applied slightly upside of right shoulder low. It depends on your risk-taking. If you want to take a risk then place the stop loss at the same level or slightly upside the right shoulder low. You can set your stop loss level around the right shoulder high point according to your risk-taking capacity and your risk and reward ratio.
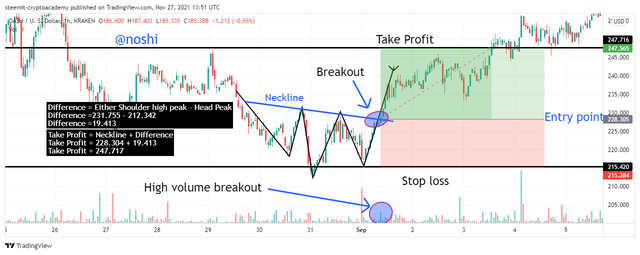
In the above figure, you can see that I place a sell order with the stop loss and take profit level. My entry point is $228.305, Stop Loss level = $ 215.420 and Take profit level is $247.565. All the calculations are mentioned in the figure, you can check them. At the time of break out the volume is high that indicates the pattern is right and it is the right breakout.
In this way, we can trade using the Inverse head and shoulder patterns.

Place 1 real trade for Head and Shoulder (at least $10) OR 1 trade for Inverse Head and Shoulder pattern (at least $10) in your verified exchange account. Explain proper trading strategy and provide screenshots of price chart at the entry and at the end of trade also provide a screenshot of trade details. (Screenshot needed.)
I place real trade using the Inverse head and shoulder pattern. For the trade, I chose SFP/USDT pair. I set the chart to 5m time period. After setting, I observed that the Inverse Head and Should pattern is made.
You can clearly check first, the left should be made. After left should the head is made with the lowest peak value. In the end, the right shoulder is made. Again price moves. This is a 5-minute chart So, I quickly draw all trading management lines.
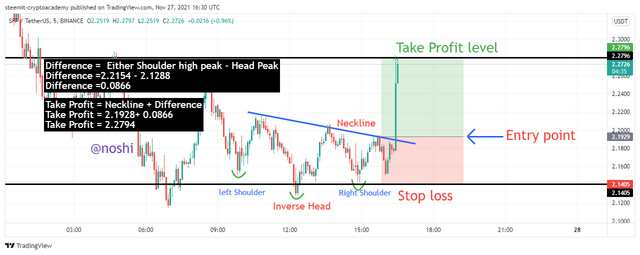
In the following figure, you check the inverse head and shoulder pattern is formed. For setting the stop loss and take profit I made a few calculations. In the above figure, you can check the head low peak, should highs and neckline price be highlighted. It will be to take place at the take profit level after the breakout.
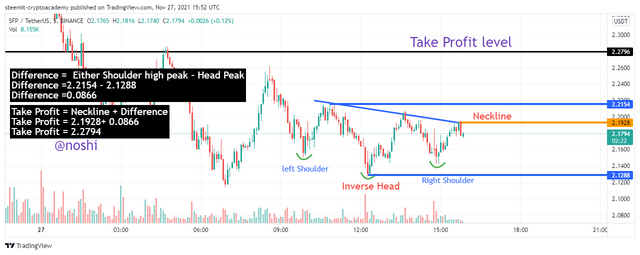
In the above figure, you can see that all the point related to the calculation is mentioned. I mention all the points that are about Head Low, Shoulder Lows and highs, and neckline. All the prices are mentioned in the figure.
Stop Loss
The stop is applied slightly down of right shoulder low. My stop loss level is $2.1417.
Take Profit
When the price breaks out the neckline, then the price goes upward direction. That is why we can set our take profit level after a few calculations.
Difference = Shoulder High – Head Low
Difference =2.2154 - 2.1288
- First, we subtract the value of either shoulder High with the value of Head peak low value.
- Add this Difference to the neckline value. The result is our Take profit level.
Take Profit = Neckline + Difference
Take Profit = 2.1928+ 0.0866
Take Profit = 2.2794
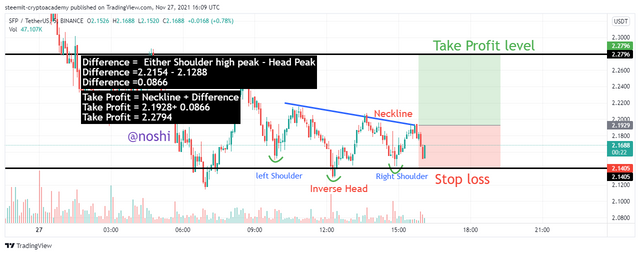
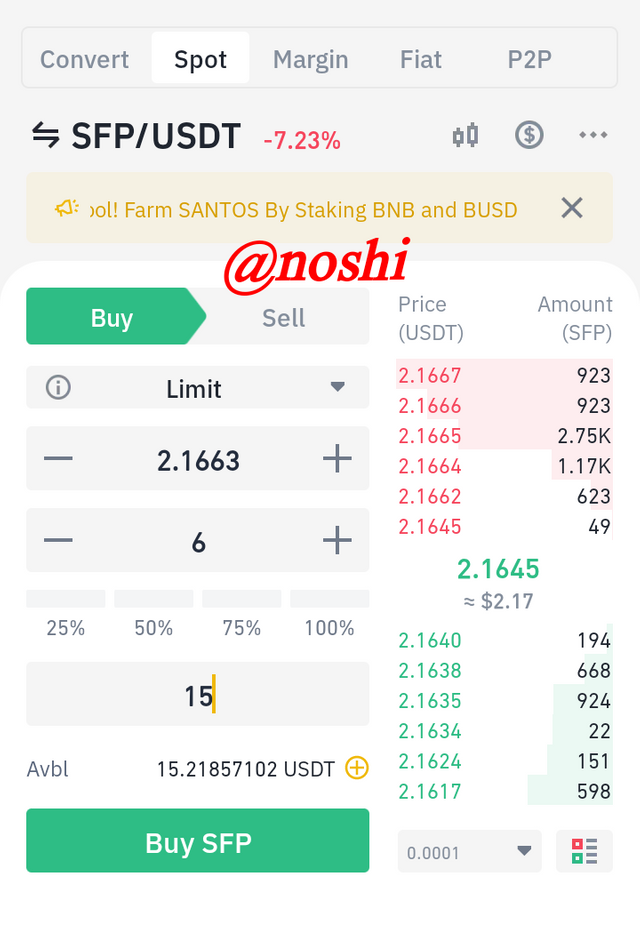
In the above figure, you see that my real entry at Binance. I buy SFP for $12.97. at the price of $2.1929. I received 6 SFP. You can check all the details about my buy order before placing the order.
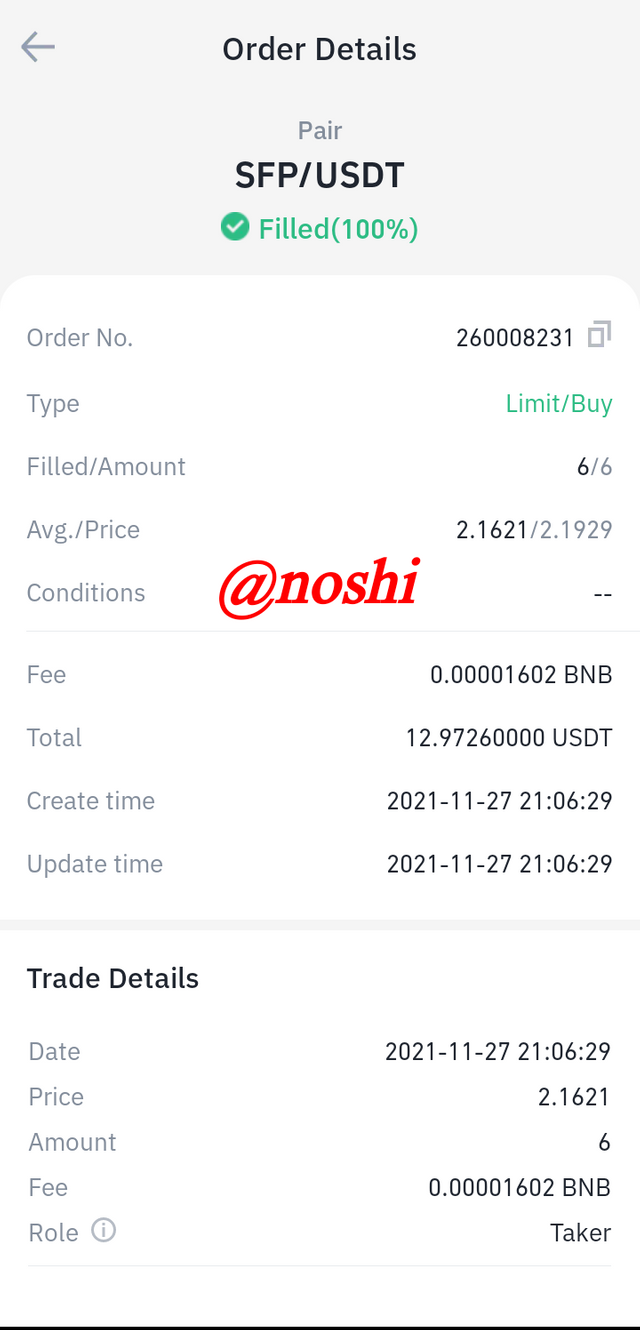
My Buy order is fulfilled. You can check all the details in the above figure.
This is the figure after the breakout. You can notice the price moves up after breakout. This indicates that the breakout is real.
In the candlestick chart, you see that the price retest the neckline. And after retest, the price increased suddenly so much and almost hit our take profit level. In this, we can make a good profit by using the inverse head and shoulder pattern.

The is a very informative lecture in which we discuss the head and should pattern and inverse head and shoulder pattern. Head and shoulder patterns comprised of two shoulders and one head. The left shoulder is formed first and the next head is formed at is higher than the left shoulder.
Next, the right shoulder is formed that’s high is lower than the high of head. There are two types of head of the shoulder patterns. One is a simple head and shoulder pattern that represents that the uptrend of the market is going to end. In this, the head and shoulders are formed in the upward direction.
Inverse Head and shoulder pattern is the second type of head and shoulder pattern that represents that the bearish trend of the market is about to end. Head and shoulder are formed in the downward direction in an inverse head and shoulder pattern. We can take profit by observing and detecting the right head and shoulder pattern and making the right entries in both patterns.
