
This is a great lecture on Rate of Change Percentage (ROC) indicator. Professor explain this indicator well. I have learned lot of things from this lecture. Professor mention few questions at end of this lecture. I try to answer all the question. I hope, it will help you to understand this concept in different angle.

In your own words, give an explanation of the ROC indicator with an example of how to calculate its value? And comment on the result obtained.
ROC is an abbreviation of Rate of Change. It is a momentum-based indicator. Like other indicators, Rate of Change (ROC) indicator is also use to do the technical analyses of crypto asset. ROC indicator measures the percentage difference between the current price of asset candle and previous nth candle closing price. Previous nth candle is set accordingly to the trading strategy.
In most of cases and indicator default setting is 9 periods. It means the indicator calculates the price difference between the current period and previous 9th period. This indicator has one oscillating line that is oscillate around the 0 line. Mostly decisions are made when oscillating line intersect the 0 line in both up and down cases.
We use this indicator when we want to determine the trend of market, oversold, overbought positions, Crossovers and Continuation in market. This indicator helps us most to determine the above situations. Buy determining these situations, we are able to do comparatively safe trading. Here is an example of Indicator.
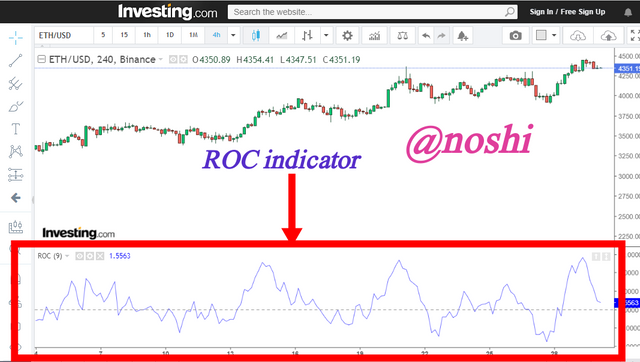
Formula of Calculating the Rate of Change percentage in Certain periods.
We will understand that, how this indicator works and how it calculates the values on the bases of previous data. The calculation of this indicator is quite easy. In the calculation of Rate of Change percentage, we consider the current candle price and the closing price of nth candle. Previous nth candle is according to the time period and length set on the indicator. In the following figure, can see the formula of Rate of Change indicator.
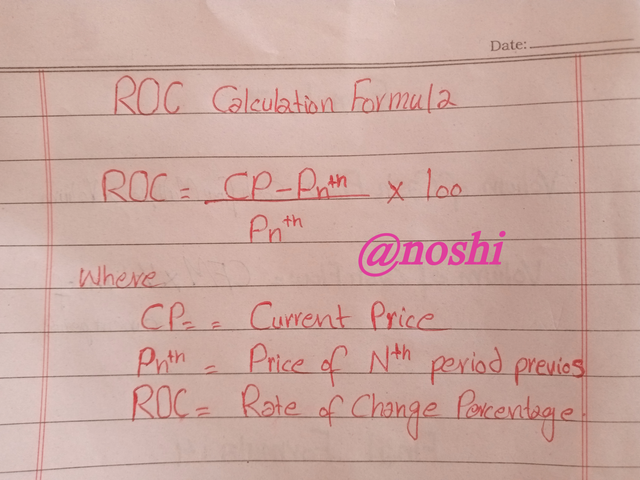
In this formula all parameters are defined. First of all, Current candle price is subtracted from the previous nth candle closing price. Next the result of subtraction is divided by the closing price of previous nth candle and at the end the result of after dividing is multiplied by 100. In this way it calculates the Rate of Change percentage between the current price and previous nth price.
In the following figure, I select the ETH/USD pair. In the chart you can see the ROC indicator is applied. I sell the Length 12. In this way it calculates the price different between the current price and previous 12 candle closing price. All the values are given.
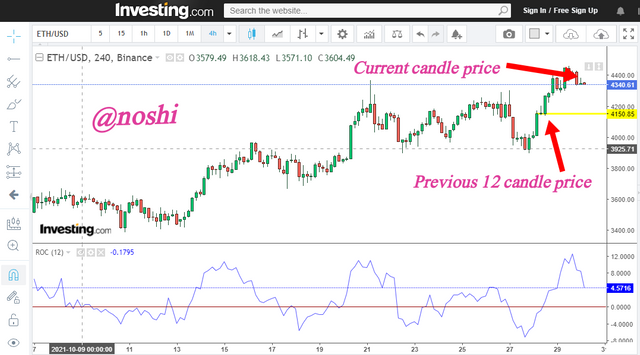
Chart figure
Current Price= $4340.61
Previous 12 Candle Closing price= $4150.85
In the following figure all the calculation procedure is shown.
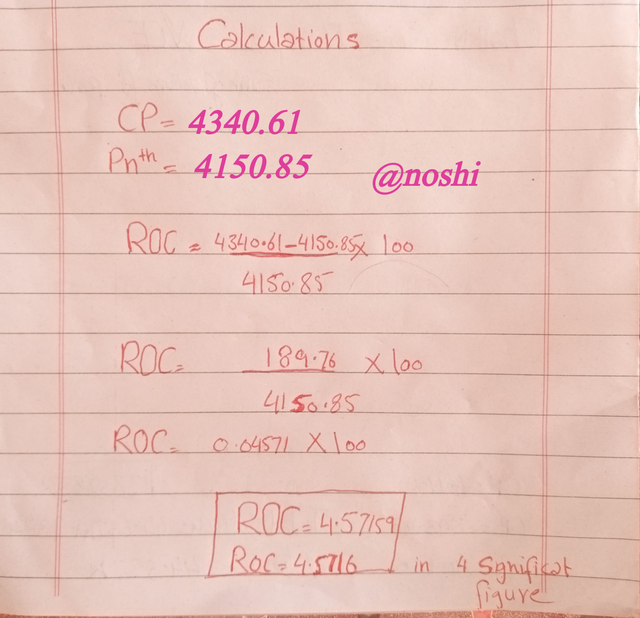
We compare the calculation result with indicator current result. We can see that the result is approximately same. It means that calculation done successfully. You can check for confirmation the indicator value in the following figure.
Figure Indicator tale

Demonstrate how to add the indicator to the chart on a platform other than the TradingView, highlighting how to modify the settings of the period(best setting).(screenshot required)
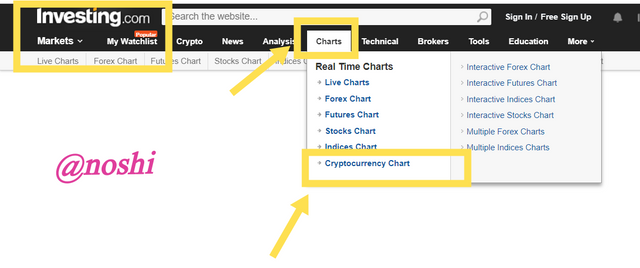
According to the requirement of question, I explore the Investing.com website. In this website, I will explain that how to open chart and apply the Rate of Change indicator on chart. For applying the indicator on chart, you need to do the following procedure.
- Go to the Investing.com Website.
- Click on the Chart options.
- Select the Cryptocurrency Chart as mentioned in the figure.
- Chart is open, you need to select the Pair of Cryptocurrency of your choice.
How to Apply Indicator on chart?
For applying the indicator on the chart, you need to do the following procedure.
- Click on the Indicator Icon
- Enter the name of Indicator in Text box that is ROC
- Select the Indicator as mentioned in the figure.
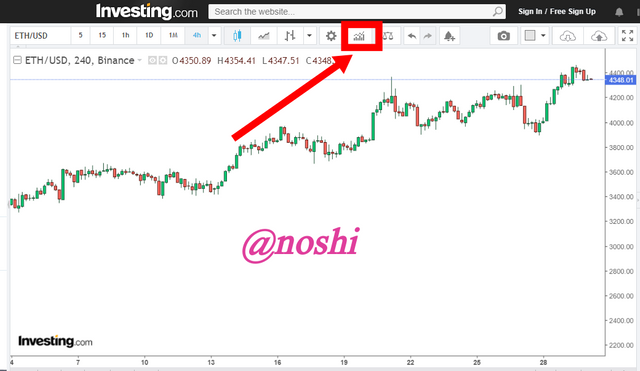
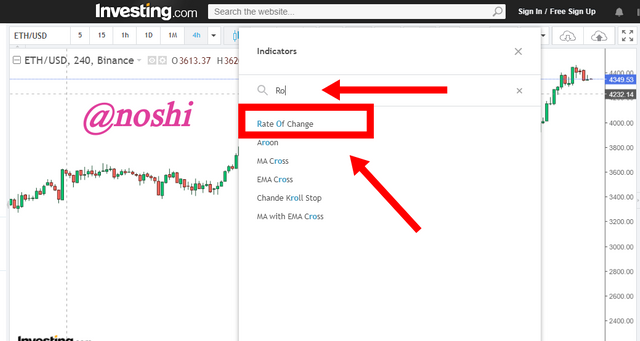

In this way we can apply the indicator on the chart in investing.com platform.
How to configure Indicator settings.
To configure the settings of Chart, you need to do the following steps.
- Click on the Setting button as mentioned in the figure.
- Input: In the Input tab, we can change the Length of Indicator. I change length 9 to 12 as you can see in the chart.
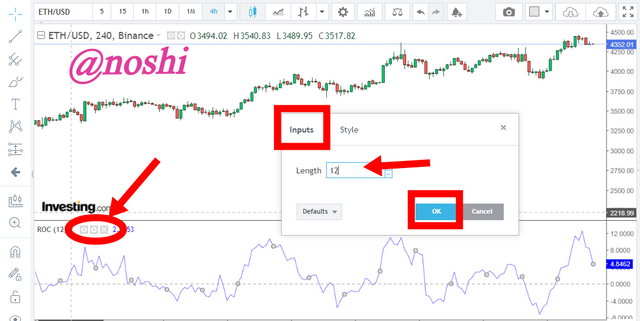
- Flip to Style Tab.
- Style: In the Style tab, we can change the color of oscillating line and zero line. We can change the format of zero flat line to dotted line. We can change the scale position here in the indicator style setting.
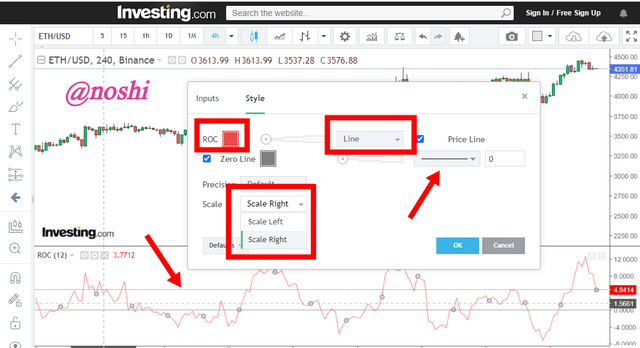
In this way, we can configure the indicator settings.
What is the best Length setting?
In the TradingView and investing.com, when we apply the ROC indicator on chart, the default length setting is 9. It means that, it calculates the price different percentage between the first candle and previous 9th candle. But of trader and analyst recommend the 12-length setting. In most of cases, length of period is changed according to the trading strategy.
It can be changed, when we are doing intraday trading. And in long term trading strategy the length is different. So, according to my perception, 12 length setting is the best setting. We can get more positive results using this 12-length setting.

What is the ROC trend confirmation strategy? And what are the signals that detect a trend reversal? (Screenshot required)
Rate of Change indicator is use to confirm the trend. We determine the market trend by observing the movement of oscillating line around the 0 zero. Value is oscillating line might be positive and negative according to the placement of line above or low the zero line.
We can detect the trend reversal by using ROC indicator. When the oscillating line moves from bottom to upward, it indicates the trend reversal in market. In it is not enough information for trading. The trend confirmation signal is appeared when the oscillating line cross the Zero line from bottom to upward direction is the trend reversal confirmation signal from bottom side.
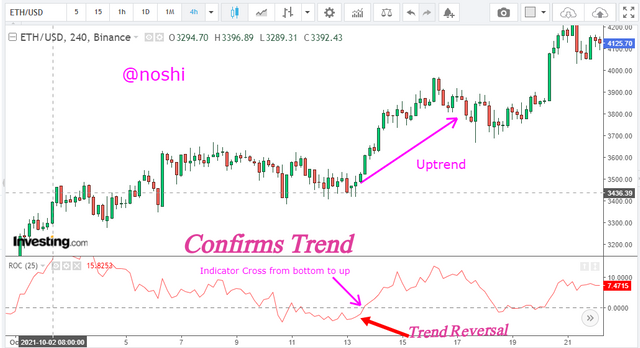
When the oscillating line moves from upside to downward, it indicates the trend reversal in market form bullish market. In it is not enough information for trading. The trend confirmation signal is appeared when the oscillating line intersect the Zero line from bottom to upward direction is the trend reversal confirmation signal from Upside side.
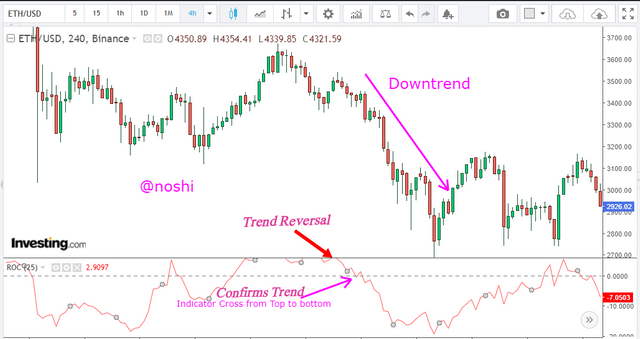

What is the indicator’s role in determining buy and sell decisions and identifying signals of overbought and oversold؟ (Screenshot required)
Buy and Sell signal is determined by Rate of Change indicator. These signals are detected when oscillating line move up and down around the Zero line. Signal can be Buy or sell according the line placement.
Buy Signal
Oscillating line oscillates around the 0 line. when the indicator line moves from bottom to upward direction and price of asset is also follow the movement of indicator and intersect the zero-line form bottom to upward direction. Sometimes the time of intersection of indicator line to zero line is very complicated for the traders to make a decision because the most of time indicator produce wrong signals.
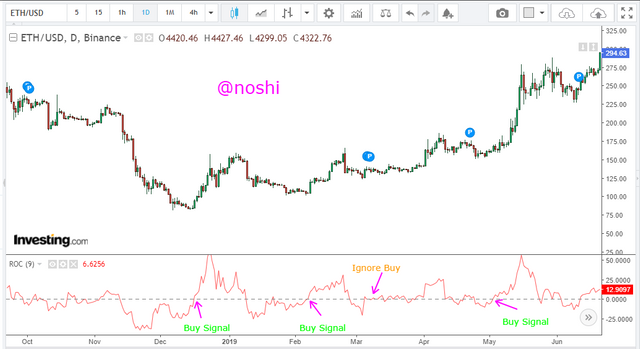
Sometime indicator line just crosses the zero line and bounce back to downward. In this situation you should ignore these wrong signals. Here traders need to wait for clearly line cross. When line is crossed to zero-line clearly, it is indicating the buy signal. We need to place the buy order at just above the cross line. Buy signals are mentioned in the chart. I also mention wrong signal in the chart and we should ignore buying at this point.
Sell Signal
When the indicator line moves from Upward direction to downward direction and price of asset is also moving in the same way indicator line intersect the zero-line form upward to downward direction. Same as in the buy signal case the time of intersection of indicator line to zero line is very complicated for the traders to make a decision of selling because the most of time indicator produce wrong signals.
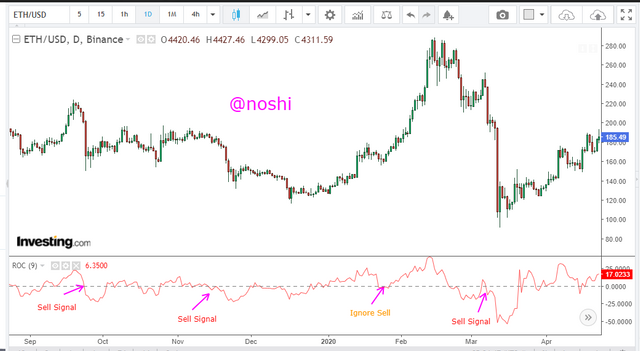
Sometime indicator line just crosses the zero line and bounce back to upward direction. In this situation we should ignore these wrong signals. Here traders need to wait for clearly line cross. When line is crossed to zero-line clearly to downward direction, it is indicating the Sell signal. We need to place the Sell order at just above the cross line. Sell signals are mentioned in the chart. I also mention wrong signal in the chart and we should ignore Selling at this point. Most of selling loss their asset due to lack of patience and sell their asset by observing these wrong signals.
Identifying the Overbought and Oversold Signals with ROC indicator.
To determining the overbought and oversold signals, we need to observe the indicator movement. In indicator line pattern, we observe the area where the oscillating line visit most of time and touch that area and again bounce bank. We can set the highest and lowest points where the price of a particular asset can reach in both upward and downward directions.
In the chart, I mention the area that is visiting most time by oscillating line. The point that I have set is +20% and -20%. These are the boundaries in both sides that are visited by price most of times. I draw vertical line in both positive and Negative side of Zero line. Green line indicates the +20% and red line indicates the -20%.
When Rate of Change indicator line cross the green line, It indicates the overbought of asset. At this stage traders are active. When trader observe that the ROC line is bounce bank and cross the green line from top to bottom, it indicates that the price of an asset is expected to go down. At this stage traders sells their assets and take profit.
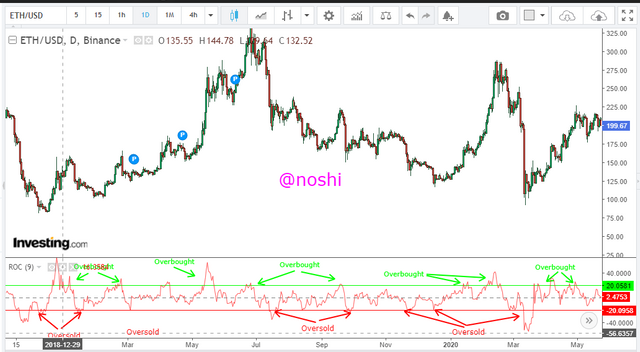
On contrary, when Rate of Change indicator line cross the red line, it indicates the oversold of asset. At this stage traders becomes active and ready for buy. When trader observe that the ROC line is bounce bank and cross the green line from bottom to top, it indicates that the price of an asset is expected to go up. At this stage traders place buy orders in market and buy asset at lowest price.

How to trade with divergence between the ROC and the price line? Does this trading strategy produce false signals? (Screenshot required)
Every time the price of a certain asset is moving in both bearish and bullish segments. The ROC indicate gives us the signal about a particular market current trend is about to finish and new trend is start. It is in the case, when market price and indicator value movies in the same direction. But on the other side, when market price and indicator value move in opposite direction, then ROC indicator also gives the signal that the current market trend is about to finish and new trend will start after the current trend.
Bullish Divergence
When the price of asset is moving down in the chart and the indicator line moves upward, it indicating the Bullish Divergence. When this situation is detected in any crypto chart and indicator, it indicates the current downtrend of market is about to finish and market is ready for new uptrend.
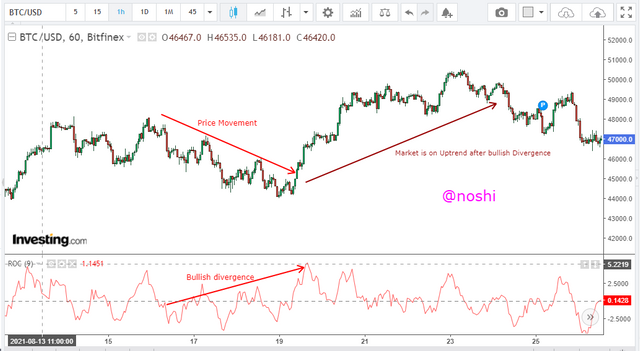
In the following figure, I observe the same scenario. In the chart, the price of asset is moving down but the indicator movement is opposite direction of price movement. Indicator value is moving upward. This scenario indicates that the current bearish trend is about to finish and new bullish trend is ready.
In the above figure, you can see that the bearish trend is finished and it converts to bullish trend after the divergence period.
Bullish Divergence
When the price of asset is moving upward in the chart and the indicator line moves downward, it indicates the Bearish Divergence. When this situation is detected in any crypto chart and indicator, it indicates the current uptrend of market is about to finish and market is ready for new downtrend.
In the following figure, I observe the same scenario. In the chart, the price of asset is moving upward but the indicator movement is opposite direction of price movement. Indicator value is moving downward direction.
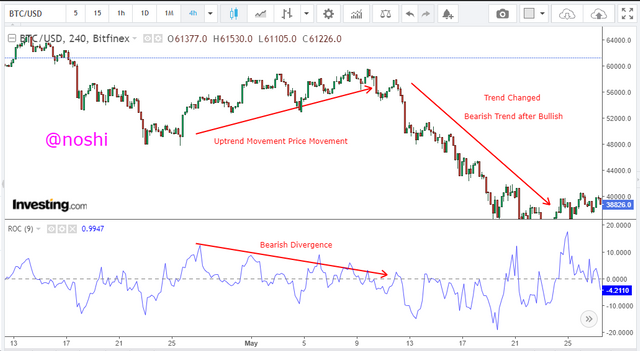
This scenario indicates that the current bullish trend is about to finish and new bearish trend is ready. In the figure, you can see that the bullish trend is finished and it converts to bearish trend after the divergence period.
Does this trading strategy produce false signals? (Screenshot required)
We have studied several times that, indicators are not hundred percent sure for trading. Sometimes indicators produce false signals. Traders do no understand this trap and loss their assets. When indicator shows divergence, it means that the current market trend is about to finished and new opposite trend is formed.
But sometimes in divergence cases, indicators show false signal. Rather then finishing the current trend, market is moving is same direction. In this scenario, most of traders are trapped that are doing trading with single or less than two indicators.
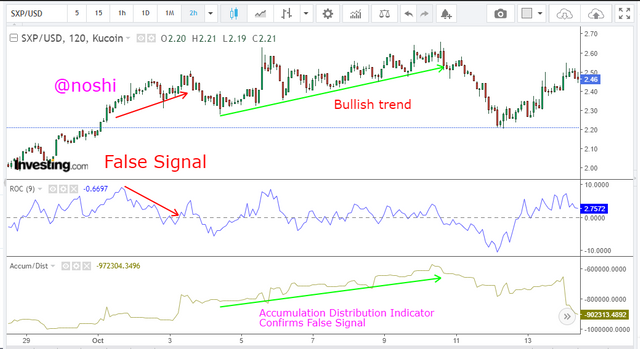
I observed the same scenario in the following chart. The chart of XSP/USD show the price movement is upward direction but the indicator is moving downward. It is a signal for current trend that is about to finish and new opposite trend is formed. Current market trend is Bullish.
Due to indicator divergence, traders expected that the current trend is about to finish, but we can see that it is a false signal that is displayed by indicator. The market price is moving is the same direction unexpectedly. Bullish trend remains bullish even indicator shown divergence.
This is why, we should not use a single indicator for trading. If we do, then we will loss our assets in such scenarios. So, I use another indicator to confirm the trend. Accumulation and Distribution indicator that I use to confirm the accumulation and distribution in market that confirm the current market trend.
In the figure, you can see that market trend is remains bullish. It confirms the market trend. In this way, we can save our assets.


How to Identify and Confirm Breakouts using ROC indicator? (screenshot required)
The price of any token is increase or decrease according to the people buying and selling. When most of people do buying, the price of asset is increased. On the other side, when most of people do selling, the price of asset is decreased.
When the ratio between the buyers and sellers bound within a certain limit then market makes side way move. We will figure out the breakout level in market, when price is bounce back after long side way moves with the help of ROC indicator.
When the indicator line makes littles swings around the zero line in a constant manner, it indicates that there is not trend in the market buyer and sellers are equal in number.
Bearish Breakout
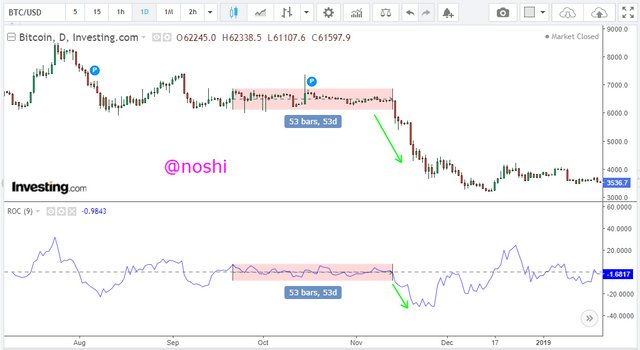
In the following Chart of BTC/USD, I observe the same situation. Price of BTC makes little swings around the zero line. We can also see the market price, that is also show the side way movement. I draw a transparent rectangle, that show the movement of indicator and market price. We can see that, there is not trend in market.
When the oscillating line is cross zero line from upward direction to downward direction and also intersect the border area of rectangle that confirms the breakout. It indicates the bearish breakout as can see in the figure, after breakout the bearish trend is formed.
Bullish Breakout
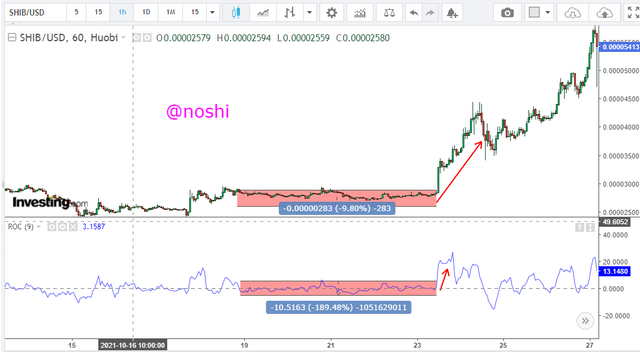
Same case with Bullish Breakout. When indicator makes little swing around the zero line then it indicates that there is not trend in market. When the oscillating line is cross zero line from bottom to upward direction and also intersect the border area of rectangle that confirms the breakout. It indicates the bullish breakout as can see in the figure, after breakout the bullish trend is start.

Review the chart of any crypto pair and present the various signals giving by ROC trading strategy. (Screenshot required)
I chose BTC/USD pair. In this chart, I figure our lot of signals regarding Buying, selling and divergence. I set the chart time period of 1Day. In this chart, at the extreme right of indicator, you can check the sell signal is making. At this place the indicator line is cross the zero-line form top to bottom. It indicating the sell signal.
In next, we can see that another sell signal is formed. In this we can also see that the indicator line is cross the zero-line from top to bottom. It indicating the sell signal. At the middle left on the chart, we can see that one Buy signal is formed. In the indicator line is cross the zero-line form bottom to top. It indicating the Buy signal.
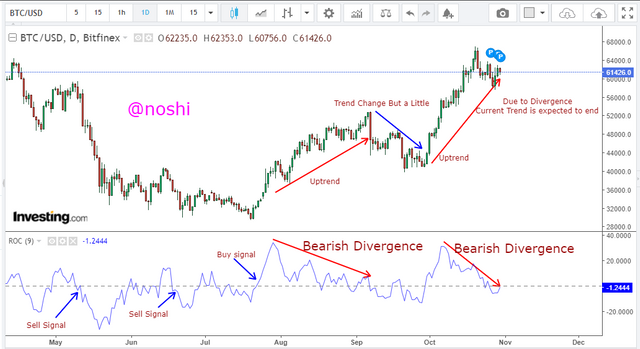
In the above figure, you can see another divergence in chart. In this market price is moving in upward direction and indicator is moving toward down direction. It is divergence that indicating the end time of current trend. Next, we can see that trend bearish after divergence but after a while it is recovered.
You can see another divergence at extreme right of chart. In this market price is moving in upward direction and indicator is moving toward down direction. It is divergence that indicating the end time of current trend. This the current trend of market at 30 October,2021. According to the divergence role we can expect the bearish after divergence.
Note: All Screenshot are taken form Investing.com

Rate of change is momentum based indicates. Like other indicators, it is also use to do the technical analyses of particular cryptocurrency. It is use to know the several things like buy and sell signal, trend strength and also divergence is determined by this Indicator.
Rate of change indicator is not hundred percent accurate. It shows wrong or false signals. So, it is recommended that we should use this indicator with the combination of other indicator like EMA, RSI, MACD and AD indicator for the purpose of confirming the trend.
We can do the technical analyses with the help of this indicator easily. The working of this indicator is not so difficult. It all about the oscillating the line around the zero line. When oscillating line is above the zero line then it indicates the bullish market. When it is below the zero line it shows the bearish market.
We should you in this indicator with the combination of other indicators. In this way we can get success in crypto trading. Trading required patience. Most of trader’s loss their asset due to lack of patience. They want to get profit quickly. With the combination of other indicators, we can confirm the required signals.

#club5050 😀
Downvoting a post can decrease pending rewards and make it less visible. Common reasons:
Submit