
This is a very informative and detailed lecture on the Keltner indicator. My technical analyses tool list is enhanced by one after attending the lecture on the Keltner indicator. I have learned the working of this indicator and also learn that how it works. I try to answer all the questions that the professor mentioned in the lecture, I hope it will help you to understand this indicator.

Creatively discuss Keltner Channels in your own words.
Keltner channel is an indicator, that is used to do the technical analyses of assets. Keltner channel indicator is developed by Chester W. Keltner in 1960. Further, it is refined by Linda Raschke in the 1980s. This indicator is used to determine the volatility of a particular asset over a certain period of time.
The volatility of assets is known as the change in the price of assets in both upward and downward directions over a certain period. Traders take an entry into the market after observing the volatility of the market and make decisions accordingly. You can in the following figure, how it looks like. Now we will understand that, what are the elements that are involved in this indicator.
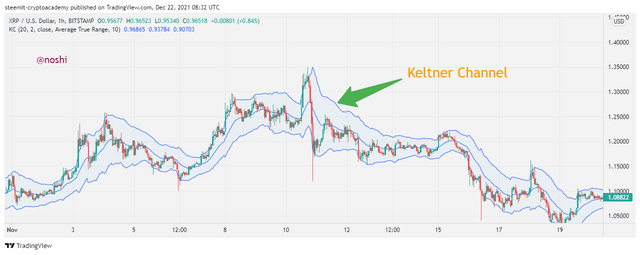
Keltner indicator is comprised of three lines. The lines are Upper, Middle, and Lower line respectively. The upper line is known as Upper Band. The lower line is known as Lower Band. The Middle line is working as EMA (Exponential Moving Average). The default length of EMA is 20. You can see upper, middle and lower band of the Keltner Indication in the following figure.
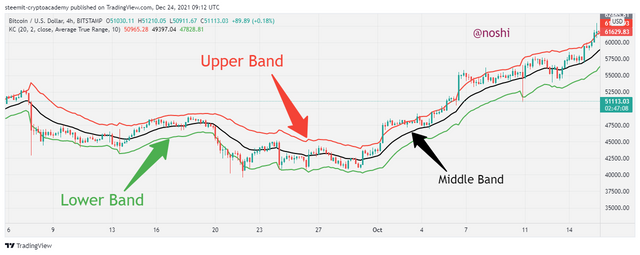
The working behind the upper band is an addition of EMA and ATR (Average True Range) with the multiplication of 2. The working behind the lower band is an addition of EMA and ATR with multiplications of -2. In this way, the Keltner channel is made. It is basically a combination of two indicators with few adjustments.

Setup Keltner Channels on a Crypto chart using any preferred charting platform. Explain its settings. (Screenshots required).
Now we will learn that how to apply the Keltner indicator on the chart. For this, we have to visit the charting platform. I choose TradingView.com for applying the indicator on the chart. You should do the following procedure for applying the indicator on the chart.
- Go to TradingView.com and open the chart of a particular asset.
- Click on the fx Indicator button at the top menu of the chart.
- Next, enter the name of Indicator as Keltner.
- Then click on the 2nd result that is Keltner Channel as shown in the figure.


In this way, we can apply the Keltner indicator on the chart. You can see this in the following figure.

Configuration Settings
We can customize the settings of the Keltner indicator according to our choice. If we have enough knowledge of trading and experience, then we can use this indicator according to our trading strategy and technique. There are two major settings that will be discussed in the following.
Input Settings
To open the settings of indicator, you need to click on the Setting Icon of Indicator. Then Input Setting is open. In this setting, we can change the period length of the EMA indicator. We can change the value of the multiplier of ATR. We can also change the ATR length in this setting tab.


Style Settings
It belongs to the appearance of the indicator. We can change the color of the Upper, Middle, and lower bands and also increase and decrease the thickness of lines. We can change the background of the Keltner indicator. We can change the line style in this setting.


How are Keltner Channels calculated? Give an illustrative example.
We will learn how to calculate the Keltner Channel values. In the above question, we have discussed the things that are involved in this indicator. In we have EMA and ATR indicators. Now we will understand with an illustrative example that how it is calculated.
Here are the expressions of all three bands.
Middle Band = EMA with 20 lengths
Upper Band = EMA + (Average True Range x 2)
Lower Band = EMA - (Average True Range x 2)
First, we should know the value of EMA at 20 lengths. In the following figure, you can see the current value of EMA at 20 lengths. Next, we need the current ATR value. In the following figure, you can see the both current values of EMA and ATR.
Current EMA = 0.4315
Current ATR = 0.0140
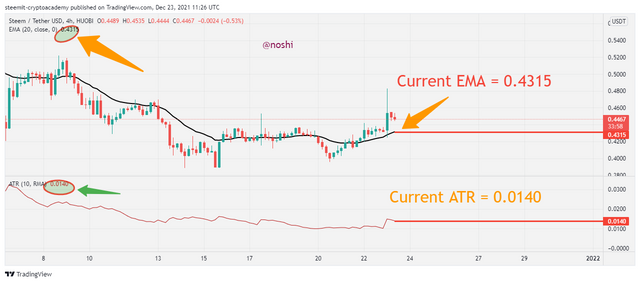
Now according to the formula, we will put these values into the formula for calculation.
The middle band is directly known after knowing the values of EMA because it is working as an EMA line. We need to know the upper band and lower band values. For this, we need to put the EMA value in the formula of both upper and lower bands.

Upper Band Calculation
Upper Band = EMA + (ATR x 2)
Upper Band = 0.4315 + (0.0140 x 2)
Upper Band = 0.4315 + 0.028

Lower Band Calculation
Lower Band = EMA - (ATR x 2)
Lower Band = 0.4315 - (0.0140 x 2)
Lower Band = 0.4315 - 0.028
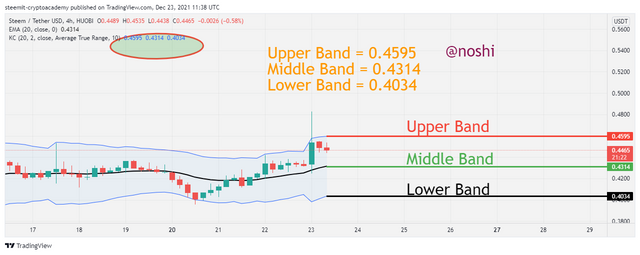
In this way, we can calculate the Keltner channel values. All the Values after calculation are matched with the Chart Indicator values. You can compare all text values with charts.

What's your understanding of Trend confirmation with Keltner Channels in either trend?
When traders want to enter the market, the first thing that they notice is the market condition. Traders notice the market condition where it is going on. They use different tools for determining the market condition. According to the market condition, they make decisions of trading.
So, the Keltner indicator is a technical tool that is one them that is used to determine and confirm the current market condition and trend. Now we will see that, how it is helpful to determine the current trend in either direction.
Uptrend Confirmation
We can easily determine and confirm the uptrend market condition with the help of the Keltner channel indicator. We can determine the uptrend market by observing the market price, Upper band, and Middle band. In an uptrend market price remains in between the upper band and middle band. The Upper band work as resistance and the middle band work as support level of price. In this situation, we can say that the market is on an uptrend.
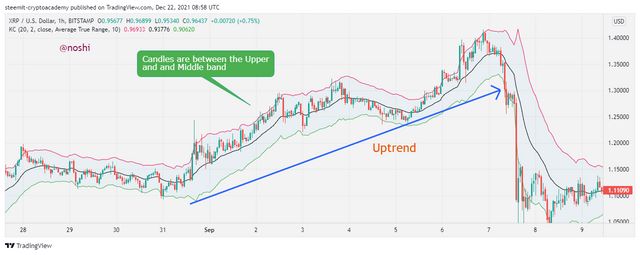
We can see the same situation in the above figure. In this, the market price mostly remains in between the upper and middle bands. The upper band indicates the resistance level and the Middle band shows the support level in the figure. You can see that the market is on an uptrend and the price is increasing.

Downtrend Confirmation
We can easily determine and confirm the Downtrend market condition with the help of the Keltner channel indicator. We can determine a downtrend market by observing the market price, middle band, and lower band. In the Downtrend market price remains in between the middle band and lower band. The Middle band work as resistance and the lower band work as support level of price. In this situation, we can say that the market is on a downtrend.
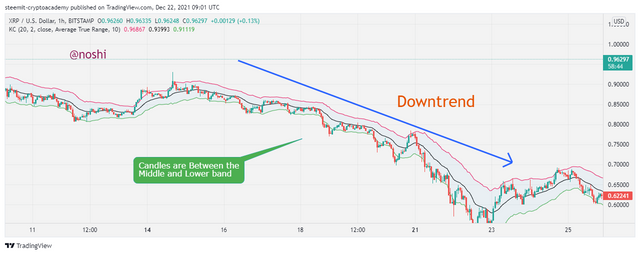
In the above figure, we can see the same situation. In this, the market price mostly remains in between the middle and lower bands. The middle band indicates the resistance level and the lower band shows the support level in the figure. You can see that the market is on a downtrend and the price is decreasing.

What does sideways market movement look like on the Keltner Channels?
We can determine the consolidation state of the market with the help of the Keltner Channel indicator. We can determine the sideways movement of the market by observing the market price movement and Middle band.
This sideways movement is very important for the traders. Because after the breakout, it born the opportunity of buys and selling of sellers. And traders do not want to miss this opportunity.
When the market price remains close to the middle band and does not touch the upper and lower band. In other words, when the EMA middle line remains between the market price then we can say that the market is in a consolidation state.
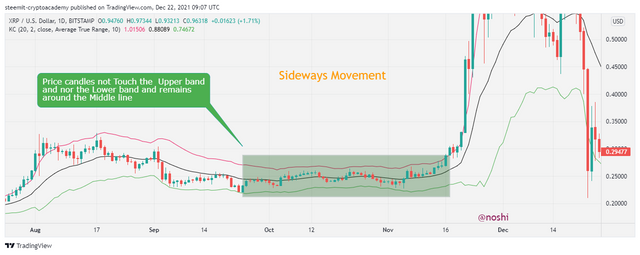
In the above figure, you can see the market makes a sideways movement. The market price sticks with the middle band and makes highs and lower around the middle line. The market price avoids touching the support and resistance. In this way, it moves in the straight horizontal direction with not enough volatility.

What should one look out for when combining 200MA with Keltner Channel? Combine a 200MA or any other indicator of choice to validate the trend. (Separate screenshots required)
As we know that, we cannot make exact and accurate decisions with the help of a single indicator. We should use more than one indicator to confirm the signal and trend. We will confirm the current market trend with the help of two indicators named 200 MA and Keltner Channel.
Uptrend Confirmation with 200 MA
We can confirm the uptrend market with 200 MA. When the market is on an uptrend then the market price remains between the upper and middle bands. The market-moving upward direction with making higher highs. We can confirm this uptrend by applying the MA on the chart. When MA is Below the Keltner Channel then it confirms the uptrend.
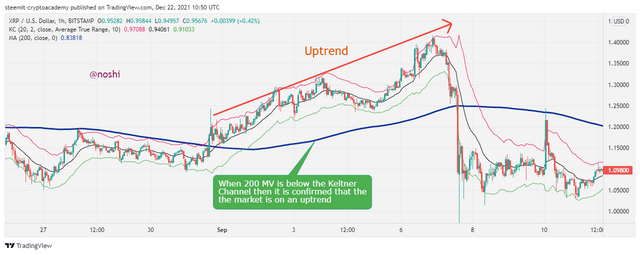
In the above figure, you can see that the market is on an uptrend. When we see the MA then, we can notice that it is below the Keltner channel. You can see the in the above figure. In this way, it confirms the uptrend of the market.

Downtrend Confirmation with 200 MA
We can confirm the downtrend market with 200 MA. When the market is on a downtrend then the market price remains between the middle and lower bands. The market-moving downward direction with making higher lows. We can confirm this downtrend by applying the MA on the chart. When MA is Below the Keltner Channel then it confirms the downtrend.
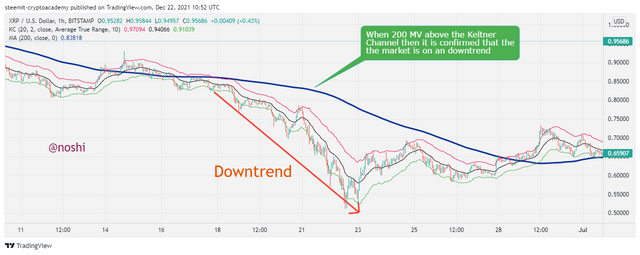
In the above figure, you can see that the market is on a downtrend. When we see the MA and notice that it is below the Keltner channel. You can see the in the above figure. In this way, it confirms the downtrend of the market.

Sideways Movement
In the figure, you can see that I open the XRP/USD pair and set the time period 1Day. Next, I apply both indicators 200 MA and Keltner channel. You can see that the market is made sideways movement.
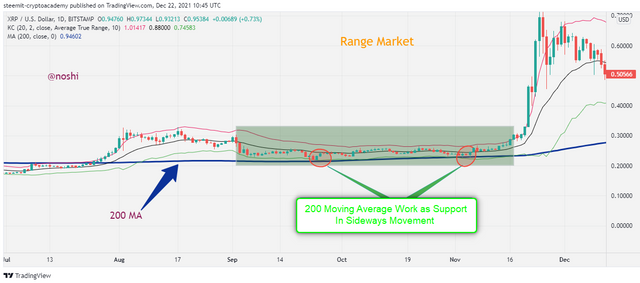
When we apply the 200 MA average on the chart then we can see that it works as a support level of the market price. In the above figure, you can see that the market price takes support at two places as mentioned in the figure. When we apply 9 MA then it will be seen between the price action.

What is Dynamic support and resistance? Show clear dynamic support and resistance with Keltner Channels on separate charts. (Screenshots required).
Support and resistance are common and very important words in trading. There are two different types of supports and resistance. One is simple flat support and resistance, which is representing a straight horizontal line. On the contrary Dynamic support and resistance are not horizontal. Dynamic support and resistances are diagonal. We will discuss both support and resistance in the following.
Dynamic Supports
When we are using the Keltner channel indicator then we can easily find out the Dynamic supports because in the channel the lower band works as a support level. Dynamic supports are not determined by horizontal lines. They are determined diagonally with help of the lower band.
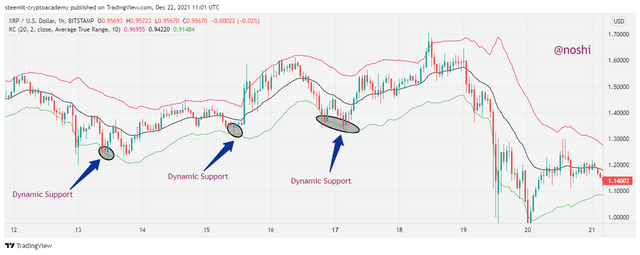
In the above figure, you can see that the market price makes multiple supports with the Keltner channel’s lower band. You can see that the price touches the lower band three-time and bound back. These supports are not in horizontal lines they are diagonal.

Dynamic Resistance
We can easily find out the Dynamic supports because, in the channel, the upper band works as resistance. They are also determined diagonally with help of the Upper band. In dynamic resistance, the price touches the upper band and bounces back.
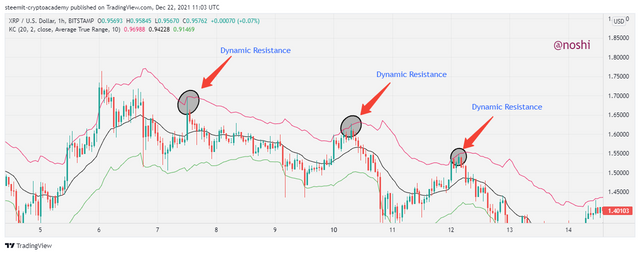
In the above figure, you can see that the market price makes multiple resistances with the Keltner channel’s upper band. You can see that the price touches the lower band multiple times and bound back. These resistances are not in horizontal lines they are diagonal.

What's your understanding of price breakouts in the Crypto ecosystem? Discuss breakouts with Keltner Channels towards different directions. (Screenshots required).
When the market price makes different patterns like rectangle, wedge, flag, and triangle patterns; after that, the market price breaks these patterns with high volume and moves in either direction then, it is indicating the breakout in the crypto ecosystem.
These breakouts are very important in trading. Traders use these breakouts to make an entry and exit from the market. Because after breakout the price moves upward and downward direction with high volume. So, all the profit and avoid loss depend on the breakouts.
Identify the Breakout with Keltner channel
The breakout in the Keltner channel is different from other breakouts in the crypto ecosystem. In this, when the price of an asset crosses one of its lower and upper bands, then it is a breakout. Now, we will discuss both upward breakout and downward breakout.

Identifying the Bullish Breakout using Keltner channel
When the market is on the uptrend and the market price bullish candle breaks the upper band and closes above the upper band then it is indicating the bullish breakout soon. It is an indication for the traders to get ready to make an entry into the market because after the first breakout the price will follow the bullish path.
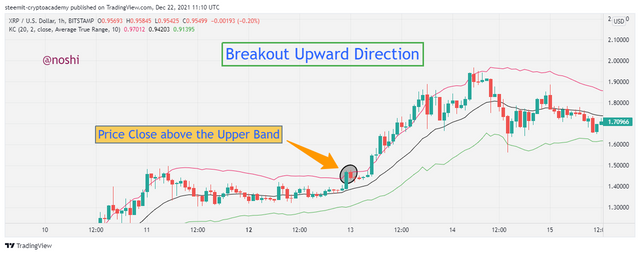
In the figure, you can see that the bullish candle closes above the upper band or resistance line. It is an indication of a bullish market. It is a bullish breakout that is determined by the Keltner channel.

Identifying the Bearish Breakout using Keltner channel
When the market is on a downtrend and the market price bearish candle breaks the lower band and closes below the lower band then it is indicating the bearish breakout soon. It is an indication for the traders to get ready to take an exit from the market because after the first breakout the price will follow the bearish path.
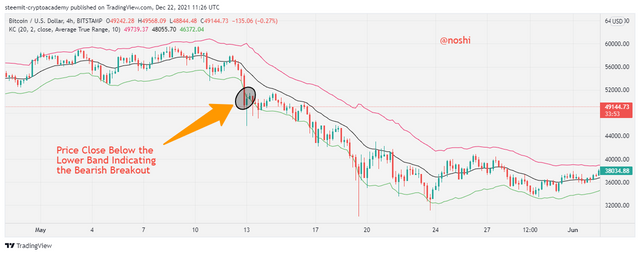
In the figure, you can see that the bearish candle closes below the lower band or support line. It is an indication of a bearish market. It is a bearish breakout that is determined by the Keltner channel.

What are the rules for trading breakouts with Keltner Channels? And show valid charts that work in line with the rules. (Screenshot required).
Now we will learn how the Keltner breakouts are helpful in trading. Traders use Keltner channel breakout to make entry and exit to make a profit from the market. In the Keltner channel breakout, the middle band works as support and resistance.

Rules for Bullish Breakout in Keltner Channel
Traders can take benefit when they make an entry after a confirmed breakout signal. There are a few rules that tell us the confirmed bullish market.
- When the market breaks a certain pattern and upward direction and one bullish candle closes above the upper band or resistance line.
- After closing at above of resistance line, the price bounces back to a downward direction.
- The market price remains between the middle and upper band for a while and takes the middle band as support and again moves in an upward direction.
- After taking support of the middle band, you should wait for two to three bullish candles and then place a buy order at that place.
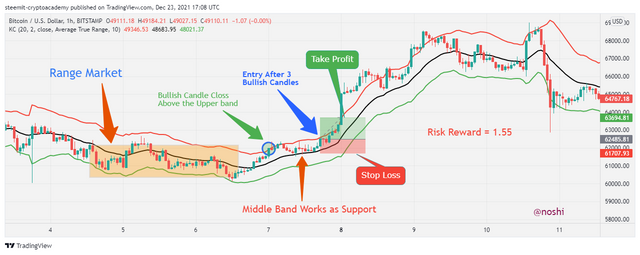
These are the rules of Bullish Keltner channel breakout. You can see in the figure the valid Keltner channel breakout.

Rules for Bearish Breakout in Keltner Channel
On contrary, these rules are opposite in bearish Keltner channel breakout.
- When the market breaks a certain pattern and downward direction and one bearish candle close below the lower band or support line.
- After closing below the support line, the price bounces back to the upward direction.
- The market price remains between the middle and upper band for a while and takes the middle band as resistance and again moves in a downward direction.
- After taking resistance of the middle band, you should wait for two to three bearish candles and then place a sell order at that place.
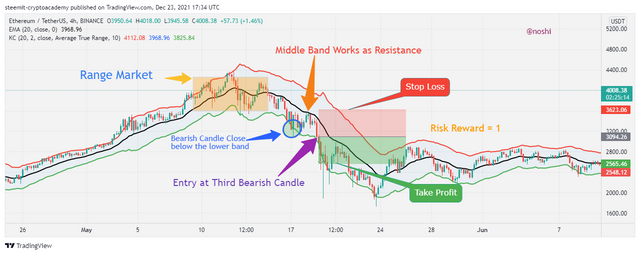
These are the rules of Bearish Keltner channel breakout. You can see in the figure the valid Keltner channel breakout.

Compare and Contrast Keltner Channels with Bollinger Bands. State distinctive differences.
If we talk about the Keltner channel generally, both are technical indicators that are used to determine the volatility of the market. Because both indicators are volatility-based. Both indicators are comprised of three bands. But if we talk about working and calculation behind both indicators then it is quite different.
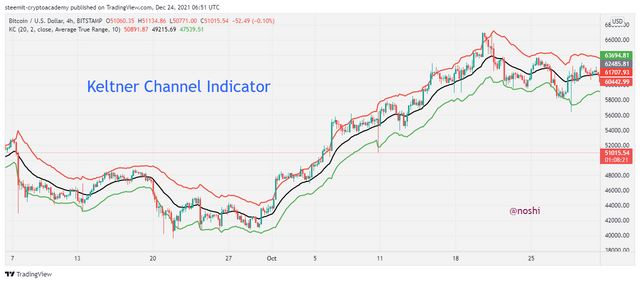
The Keltner indicator is comprised of the upper band and a lower band that is calculated using the Average True Range and Exponential Moving Average. On the contrary, the Bollinger band indicator’s upper and lower bands are derived from standard deviation. That’s why it produces late trading signals sometimes.
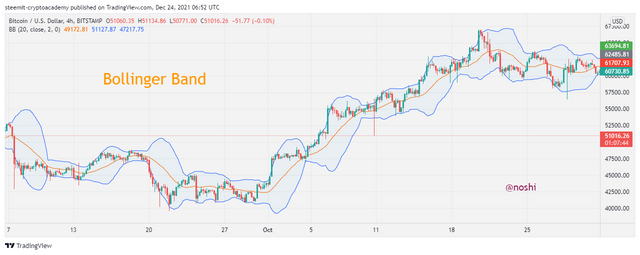
Keltner channel indicator shows the market volatility with an angle in either direction in which price goes. Bollinger band shows the volatility of the market by expanding the upper and lower band. If the space between the upper and lower band is increased then it indicates the high volatility of the market.
Now, I will mention clear difference between the Bollinger band and Keltner indicator in the following table.
| Keltner Channel | Bollinger Band |
|---|---|
| The Upper and lower band is calculated from ATR | Bollinger Band Indicator’s bands are calculated from standard deviation |
| It shows the market volatility with price angle to either direction | It show the market volatility by expanding and shrinking the upper and lower band |
| It produce fast trading signals | It produce late signal due to calculation through standard deviation |

Place at least 4 trades (2 for sell position and 2 for buy position) using breakouts with Keltner Channels with proper trade management. Note: Use a Demo account for the purpose and it must be recent trade. (Screenshots required).
I place for demo trades using the paper trading platform. Two trades for buy and two for sell. In the following, we will see how I place all trades with proper trading management.
1. Buy Trade
I choose STEEM/USDT pair for my first buy trades. In this, I found a buying opportunity according to the breakout rules of the Keltner Indicator. In the following figure, you can see that how it formed.
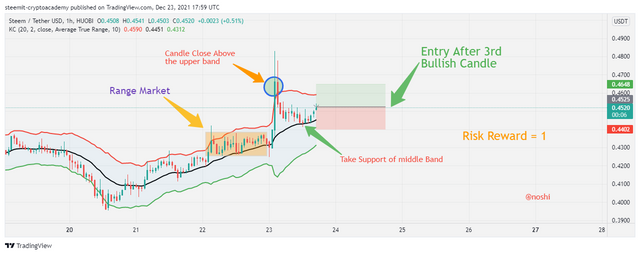
In the above figure, you can see that all the requirements for buy opportunity are fulfilled. Market at rest before the breakout and then again price pull back and take middle line as support. After taking support the 3 bullish candles are made. This condition indicates the buying opportunity so, I place a buy order at that point.
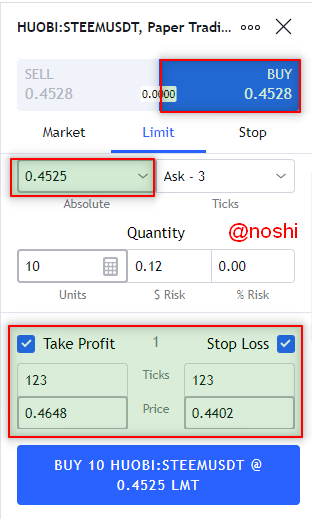
Here you can see all the order details in the following figure. All the things are mentioned in the figure like Price, Stop Loss and Take Profit.
Price = $0.4525
Stop Loss = $0.4402
Take Profit = $0.4648
Risk /Reward = 1


2. Buy Trade
I choose LTC/USD pair for my second buy trades. In this, I found a buying opportunity according to the breakout rules of the Keltner Indicator. In the following figure, you can see that how it formed.
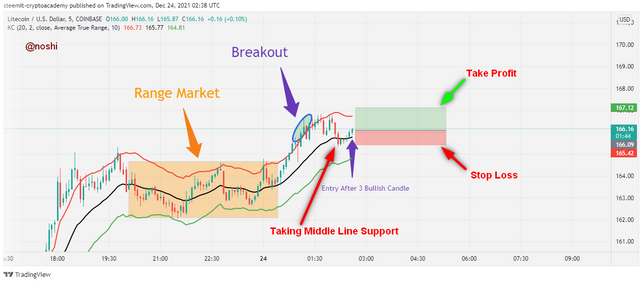
In the above figure, you can see that all the requirements for buy opportunity are fulfilled. Market at rest before the breakout and then again price pull back and take middle line as support. After taking support the 3 bullish candles are made. This condition indicates the buying opportunity so, I place a buy order at that point.
Here you can see all the order details in the following figure. All the things are mentioned in the figure like Price, Stop Loss and Take Profit.
Price = $166.17
Stop Loss = $165.50
Take Profit = $167.20
Risk : Reward = 1 : 1.5


1. Sell Trade
I choose BNB/BTC pair for my first buy trades. In this, I found a Sell opportunity according to the breakout rules of the Keltner Indicator. In the following figure, you can see that how it formed.
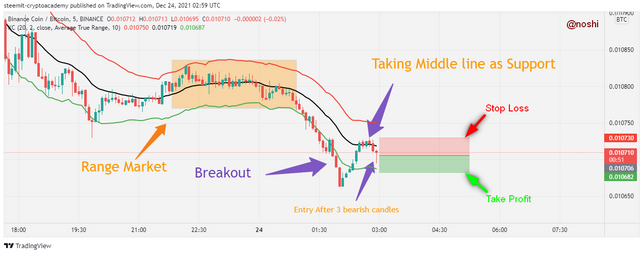
In the above figure, you can see that all the requirements for the Sell opportunity are fulfilled. The market makes a sideways movement before a breakout. After breakout again price pull back and take the middle line as support. After taking support the 3 bearish candles are made. This condition indicates the selling opportunity so, I place Sell Order at that point.
Here you can see all the order details in the following figure. All the things are mentioned in the figure like Price, Stop Loss and Take Profit.
Price = $0.010707
Stop Loss = $0.010731
Take Profit = $0.010683
Risk /Reward = 1
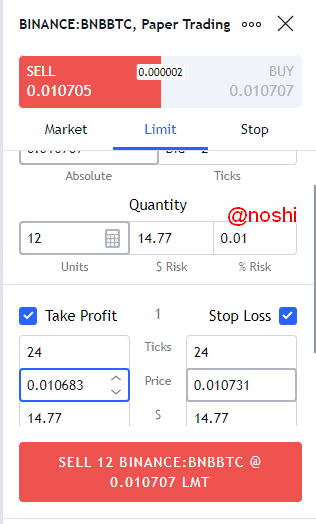


2. Sell Trade
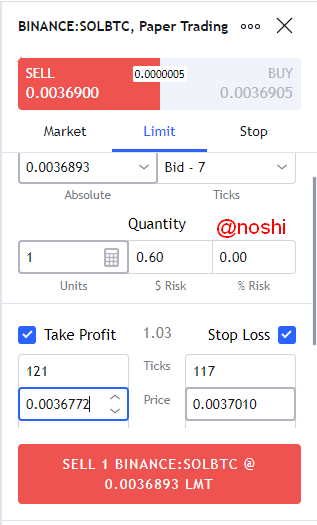
I choose SOL/BTC pair for my second Sell trades. In this, I found Sell opportunity according to the breakout rules of the Keltner Indicator. In the following figure, you can see that how it formed.
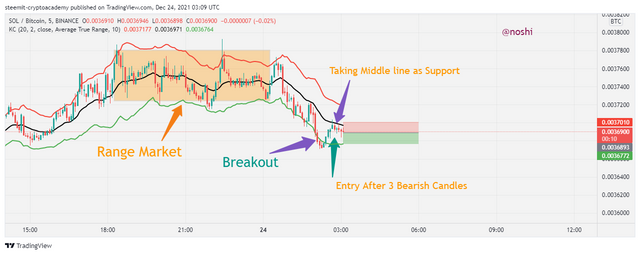
In the above figure, you can see that all the requirements for the Sell opportunity are fulfilled. The market makes a sideways movement before a breakout. After breakout again price pull back and take the middle line as support. After taking support the 3 bearish candles are made. This condition indicates the selling opportunity so, I place Sell Order at that point.
Here you can see all the order details in the following figure. All the things are mentioned in the figure like Price, Stop Loss and Take Profit.
Price = $0.0036893
Stop Loss = $0.0037010
Take Profit = $0.0036772
Risk : Reward = 1 : 1

In this way, I place 2 buy and 2 sell orders with the help of the Keltner channel indicator.

What are the advantages and disadvantages of Keltner Channels?
There are a few advantages and disadvantages of the Keltner Channels Indicator. I explain both in the following.
Advantages
- It is easy to understand and read the output.
- We can determine the current trend by using the Keltner indicator.
- We can easily determine the Dynamics supports and resistances.
- Buy and sell signals are displayed by the Keltner indicator.
Disadvantages
- It is a lagging indicator that produces false results.
- Sometimes it produces late signals that cause to lose the opportunity.

Keltner channel indicator is technical analyses tool that is used to determine the volatility of the market. Traders use this indicator for making decisions while trading. Traders set their entry and exit points. It is easy to read the signal of this indicator.
Keltner indicator comprised of three lines. The lines are Upper, middle, and lower bands. The middle band is an EMA line with 20 lengths, upper and lower bands are a combination of ATR and EMA indicators with few settings. We can determine the current trend using this indicator.
Trader’s place buys and sells trades after observing the breakouts from both up and bottom sides. The upper band works as dynamic resistance and the lower band work as dynamic support of price. Overall, it is a good indicator for doing technical analyses.
Thank You!
