
Once again, this is a very informative lecture on the topic of On-Balance-Volume Indicator. I have learned about OBV indicators working and how it is helpful for traders in making decisions while doing trading. I try to answer all the questions, I hope it will help you to understand this indicator in another way.

In your own words, explain your understanding of the On-Balance-Volume (OBV) Indicator.
There are many technical analyses tools available in the market. Indicators are the tools that are used to do the technical analyses of the asset. On-Balance Volume is one of the indicators that is used to do the technical analyses of assets in order to predict the expected price in the future.
The On-Balance-Volume indicator is designed by Joseph Granville in 1963. It is a momentum-based indicator that predicts the values by using volume injected in an asset over a particular time. There are many use-cases of OBV indicators. We can determine the current market trend, trend direction, strength of a trend, buy and sell signals, and divergence.

Working of Indicator
As we discussed above that, the On-Balance indicator is a momentum-based indicator that uses volume to predict the price of the asset in the nearest future. It shows the result on the basis of volume injected in asset. It decides the price direction on the basis of the volume injected.
When the buy volume is increased over a certain time period, it tells us that buyers dominate over sellers which leads the price of assets on an uptrend. Traders observe the volume of buyers to take an entry in the market.
On the other side, when the number of sellers increased in number, it indicates the volume of sellers is increasing which leads the price of assets to a downtrend. Seller dominates over buyers and price goes down. In this way, traders use sellers’ volume to figure out the exit position in the market.

Using any charting platform of choice, add On-Balance Volume on the crypto chart. (Screenshots required).
We can easily apply the On-Balance-Volume indicator on the chart. I use the TradingView.com platform for adding the indicator on the chart. Now we will see how to add indicators to the chart. For this, you need to do the following procedure.
- Go to the TradingView.com site and open the chart of a particular asset.
- Then click on the fx Indicator button on the top of the chart.
- Next, you need to enter the name of the indicator that is OBV (On-Balance Volume).
- Then click on the first result as shown in the figure.


In this way, we can add indicators to the chart.
We can change the setting of this indicator. Settings of this indicator are not enough. We can change the time period of this indicator and can change the color of the indicator line. It is advisable to use the default setting so, we do not need to change them.

What are the Formulas and Rules for calculating On-Balance Indicator? Give an illustrative example.
As we discussed in the above section, the OBV indicator is working on volume. Here we will discuss that how it calculates the current On-Balance volume.
The OBV indicator calculates the results on the basis of the closing of periods. If we consider the 1day chart, then it considers the previous day's closing and current closing value of the day to calculate the OBV value of the indicator.
Here is the formula and parameters used in the OBV.
OBV = The current On-Balance Volume
OBVpre = The previous period On-Balance Volume
There are three different conditions that are included in calculations. All the conditions are mentioned below.
If the current period closing is higher than the previous period closing then we add the previous period OBV value to the current period Volume.
OBV= OBVpre + Current Period VolumeIf the current period closing is equal to the previous period closing then we do nothing, the OBV is the same as the previous OBV.
OBV= OBVpre + 0If the current period closing is lower than the previous period closing then we subtract the previous period OBV value to the current period Volume.
OBV= OBVpre - Current Period Volume

Practical illustration of Calculation of the OBV
Here we discuss the example of the OBV calculation with the proper practical chart. We will see that how the OBV is calculated.
In the chart, you can see that the OBV indicator is applied on the chart. In the chart, I mention the closings of both current and previous periods. In this chart, we should notice the condition of closing.

In the above chart, we can see that, the closing of current candle is lower that the precious candle closing. In this case, we subtract the current volume from previous OBV value.
OBV= OBVpre - Current Period Volume
OBVpre= 44.126M
Current Period Volume= 130K.
Current period Volume = 0.130M
OBV= 44.126M – 0.130M
As you can in the figure, it is equal to the mentioned OBV at the bottom of the figure.

What is Trend Confirmation using On-Balance-Volume Indicator? Show it on the crypto charts in both bullish and bearish directions. (Screenshots required).
In the above, we discuss that the On-Balance-Volume indicator is used to determine the current trend and confirm the trend of the market. In the following section, we will discuss how It will help to determine the trend in both upward and downward directions.
Bullish Trend
When volume increased and the price of assets is moving upward direction, it indicates that the buyers enter into the market that’s why the price moves up by making the higher high and higher lows. We can confirm that whether the trend is real or fake by observing the OBV movements. When the OBV indicator line is also moving upward direction by making the higher highs and higher lows then it is a real trend.
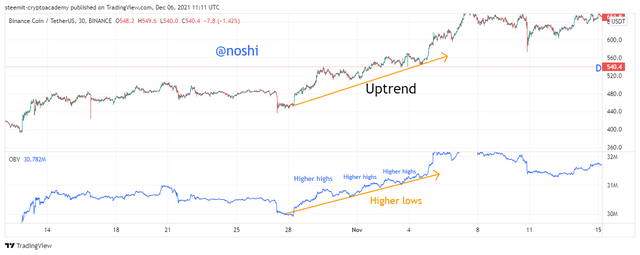
You can see in the above figure, that the price is moving in an upward direction mean is on an uptrend. At the same time, if we notice the movement of the OBV indicator, it is also moving upward direction with higher highs and higher lows. This OBV confirms this Bullish trend.

Bearish Trend
When volume decreased and the price of assets is moving in a downward direction, it indicates that the sellers enter into a market that’s why the price is moving down by making the lower lows and lower highs. We can confirm that whether this bearish trend is real or fake by observing the OBV movements. When the OBV indicator line is also moving upward direction by making the lower lows and lower highs then it is a real trend.
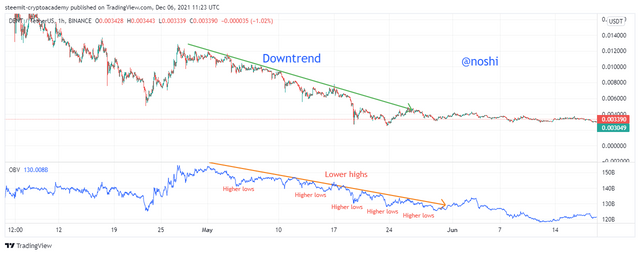
You can see in the above figure, that the price is moving downward direction means is on a downtrend. At the same time, if we notice the movement of the OBV indicator, it is also moving downward direction with lower lows and lower highs. This OBV confirms this Bullish trend.
In this, we can confirm the bearish and bullish trend by the On-Balance-Volume indicator.

What's your understanding of Breakout Confirmation with On-Balance-Volume Indicator? Show it on crypto charts, both bullish and bearish breakouts (Screenshots required).
When the market is making ups downs in between certain resistance and support levels then we call it range market. In other words, we can say that there is no trend in the market. But when the price of the asset breaks the support and resistance level either in an upward or downward direction then it is indicated that the change is coming into the market.
Bullish Breakout Confirmation
A bullish breakout is formed when the market is downtrend and making sideways movement. When the market breaks the particular resistance level and price after breaking the resistance is moving upward direction then we call it a bullish breakout. We can confirm this breakout by using the OBV indicator.
When the OBV indicator also shows the same behavior and breaks the previous resistance levels then it confirms that this bullish breakout is real. Traders use this confirm breakout signal as a buying opportunity.
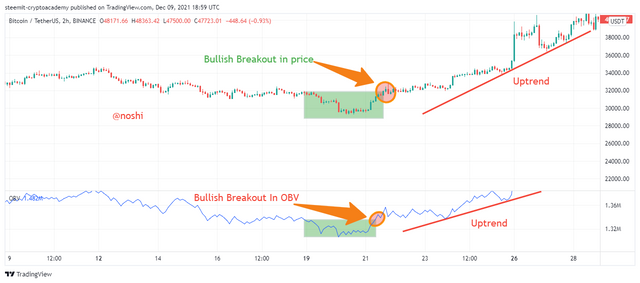
We can see that in the above figure, the price of assets is moving in a sideways pattern. When the price breaks the resistance level then the price of an asset is on an uptrend. Breaking the resistance level is a breakout. In the above figure, we can confirm the breakout with the OBV indicator. The OBV also breaks the above resistance level. In this way, we can confirm the Bullish breakout by using the OBV indicator.

Bearish Breakout Confirmation
A bearish breakout is formed when the market is an uptrend and making sideways movement. When the market breaks the particular support level and price after breaking the resistance is moving downward direction then we call it a bearish breakout. We can confirm this breakout by using the OBV indicator.
When the OBV indicator also shows the same behavior and breaks the previous support levels then it confirms that this bearish breakout is real. Traders use this bearish breakout confirm signal as an exit opportunity from the market.
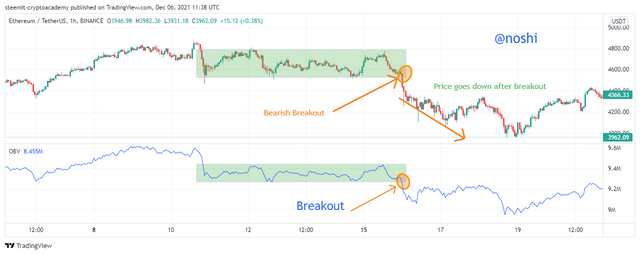
We can see that in the above figure, the price of assets is moving in a sideways pattern. When price breaks the support level then the price of an asset is on a downtrend. Breaking the resistance level is a breakout. In the above figure, we confirm the breakout with the OBV indicator. The OBV also breaks the above support level. In this way, we can confirm the Bearish breakout by using the OBV indicator.

Explain Advanced Breakout with On-Balance-Volume Indicator. Show it on crypto charts for both bullish and bearish. (Screenshots required).
After discussing the breakout, now we will discuss the type that is an Advance breakout. It is a breakout in which the price of the asset does not break the previous high/low but at the same time, the OBV indicator line breaks the previous high/low. It is known as an Advance breakout. It is usually seen in range market and rarely in trend market.
Advance Bullish Breakout
In this breakout, the market is moving in downside after a downtrend. The price of an asset makes little highs and lows and creates particular resistance and support levels. In the Advance Bullish breakout scenario, the price of assets is near the previous high. But it does not break it, at the same time the OBV indicator line breaks the previous resistance or high level. It indicates that the price of assets in an uptrend soon. Traders use this advance breakout for buying.
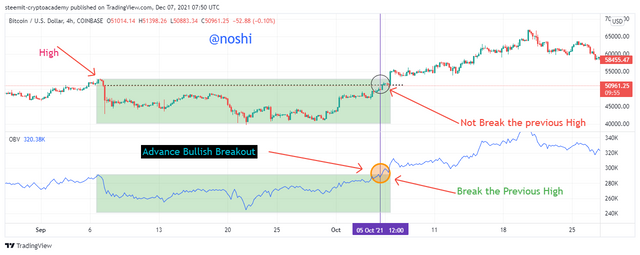
In the above figure, you see that the price of assets does not break the previous high. I mention the current level of price with Black Dotted horizontal line and purple vertical line. At the same time, we can see the OBV indicator breaks the previous high. It is an Advanced bullish breakout. After the advance breakout, the price of an asset is moving an upward direction.

Advance Bullish Breakout
In this breakout, the market is moving in upside after an uptrend. The price of assets makes highs and lows and creates resistance and support levels. In the Advance Bearish breakout scenario, the price of assets is near the previous low. But it is not able to break it, at the same time the OBV indicator line breaks the previous support or low level. It indicates that the price of assets is on a downtrend soon. Traders use this advance bearish breakout for Selling their assets.
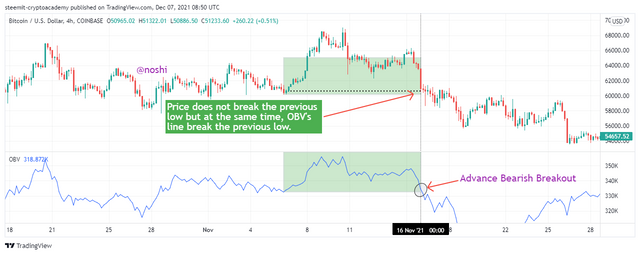
In the above figure, you see that the price of assets does not break the previous low. I mention the current level of price with Black Dotted horizontal line and purple vertical line. At the same time, we can see the OBV indicator breaks the previous low level. It is an Advanced bearish breakout. After this advance bearish breakout, the price of assets is moving downward direction.

Explain Bullish Divergence and Bearish Divergence with On-Balance Volume Indicator. Show both on charts. (Screenshots required).
Divergence is a contradiction between the price action and indicator movement. Divergence can be bullish and bearish. When divergence is observed then it indicates that the current trend is about to end and a new trend is about to start. Divergence helps the trader to take and enter and exit from the market. We will discuss both bullish and bearish divergences in the following.
Bullish Divergence
When the first high of asset is higher than the next high at the same time the first high of the OBV indicator is lower than the next high. It indicates the bullish divergence. When this scenario is made by the price, it indicates that the current bearish trend is going to end. Bullish Divergence is used by traders to buy opportunities.
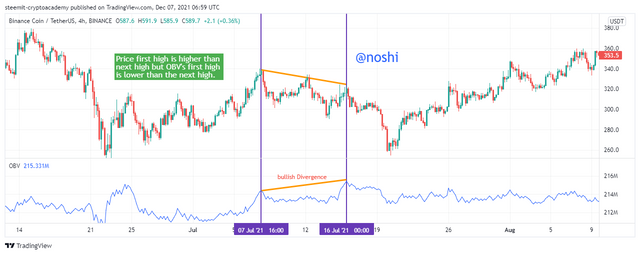
In the above figure, you can see that the first high of the asset is higher than the new high, at the same time the previous high of the indicator is lower than the new high. It indicates bullish divergence. We can see that after bullish divergence, the price of assets is on an uptrend.

Bearish Divergence
Bearish divergence is opposite to the bullish divergence. When the first high of asset is lower than the new high at the same time the first high of the OBV indicator is higher than the next high. It indicates the bearish divergence. When this scenario is made by the price, it indicates that the current bullish trend is going to end. Bearish Divergence is used by traders for selling opportunities.
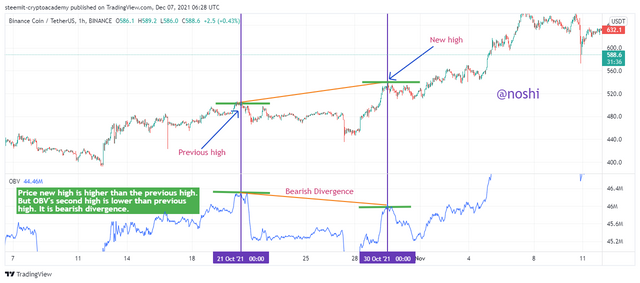
In the above figure, you can see that the first high of the asset is lower than the new high, at the same time the previous high of the indicator is high than the new high. It indicates bearish divergence. We can see that after bearish divergence, the price of assets is on an uptrend.

Confirm a clear trend using the OBV indicator and combine another indicator of choice with it. Use the market structure to place at least two trades (one buy and one sell) through a demo account with proper trade management. (Screenshots required).
It is advisable to use indicators in pairs. The alone indicator is not enough for predicting the approximate exact value in the figure. This way you should use another indicator with the OBV indicator for better results. I chose the Moving Average Indicator as a conjunction with the OBV indicator. Here I use two Moving Average with different parameters.
In the first Moving Average, I set the period length to 33 and in the second Moving Average, I sell the period length to 12. You can use 34 and 9 settings as well. These indicator settings are more compatible with On-Balance-Volume to produce exact results and confirm the signals. In the following, I mention the buy and Sell Signal confirmation with both indicators.
Buy Signal
Buy is signal is produced by the OBV when it breaks its previous high point. We can confirm that buy signal with the MA indicators. The signal confirmation is given by both OBV and the MA indicators. When the MA 33 cross the MA 12 from the upward direction to the bottom direction then at the same time we should notice the OBV indicator, if the OBV is also close and at bullish breakout then we can say that it is Buy Signal because both indicators confirm that signal.
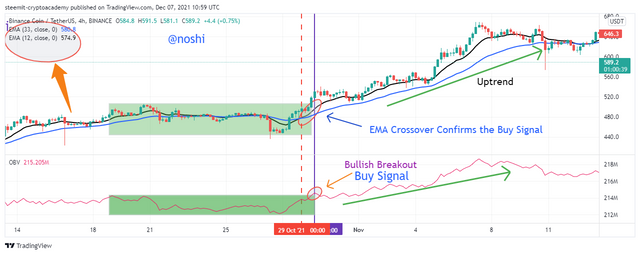
You can see in the above figure, where the MA crossover is mentioned. At the same time, we can see that the OBV line is also close to a bullish breakout. In this way, the MA indicator is used to confirm the buy signal. We should wait for the bullish breakout and place a buy order at a slight upside of a bullish breakout.

Sell Signal
Sell is signal is produced by the OBV when it breaks its previous low point. We can confirm that Sell signal with the MA indicators. The signal confirmation is given by both OBV and the MA indicators. When the MA 33 cross the MA 12 from a downward direction to an upward direction then at the same time we should notice the OBV indicator, if the OBV is also close and has a bearish breakout then we can say that it is Sell Signal because both indicators confirm that signal.
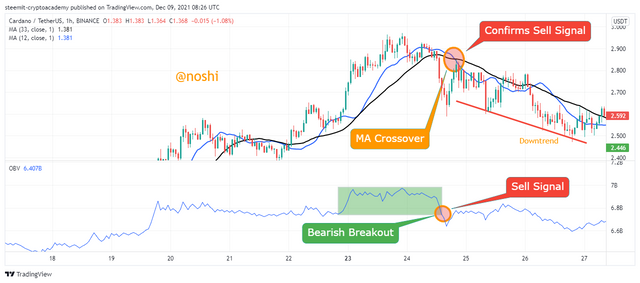
You can see in the above figure, where the MA crossover is mentioned. At the same time, we can see that the OBV line is also close to a bearish breakout. In this way, the MA indicator is used to confirm the Sell signal. We should wait for the bearish breakout and place a sell order at the slight downside of the bearish breakout.

Demo Trades
As we discussed above, we can determine the buy and sell signal by using the OBV indicator. Here we perform the demo trades by using both MA and OBV indicators. I use the Paper Trading platform to execute the demo trades.
Buy Demo Trade
I chose XRP/USD pair for buying. I place a buy order after finding out the buying opportunity and confirm the opportunity with both indicators. In the following chart, you can see that the OBV indicator breaks the previous high. At the same the MA indicator crossover after a while. After confirmation of both indicators buys Signal, I place a Buy order at a slightly low price from the current price.
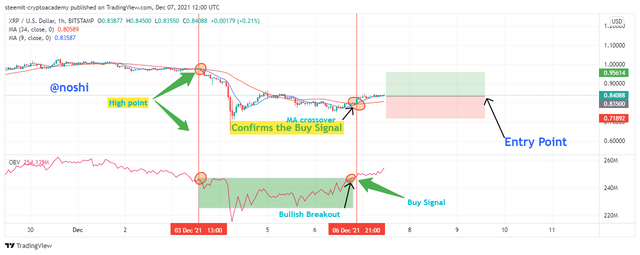
Entry Price = $0.83500
Stop Loss = $0.71892
Take Profit= $0.95614
Risk /Reward = 1
In the following figure, you can see my Buy Trade Information on the paper trading platform.

You can check my buy order is placed on Paper trading, which will execute when the price hits my entry price.


Sell Demo Trade
I chose IDEX/USDT pair for selling. I place a sell order after finding out the selling opportunity and confirming the opportunity with both indicators. In the following chart, you can see that the MV indicator crossover first, while the OBV indicator breaks the previous low that is on the bearish breakout. Each indicator confirms the buy signal. After confirmation of both indicators sells Signal, I place Sell order at a slightly Upside price from the current price.
Entry Price = $0.40991
Stop Loss = $0.45293
Take Profit= $0.36689
Risk /Reward = 1
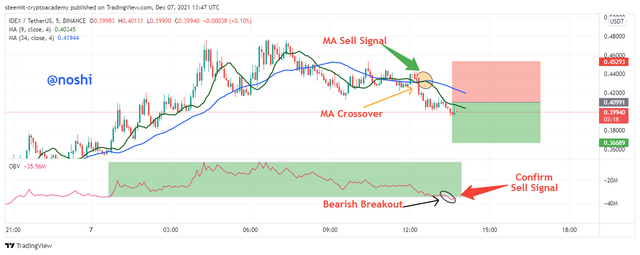
In the following figure, you can see my Sell Trade Information on the paper trading platform.

You can check my sell order is placed on Paper trading, which will execute when the price hits my entry price.


What are the advantages and disadvantages of On-Balance Volume Indicator?
As we know, most of the indicators are lagging indicators that consider previous price values and volume to calculate the current value. Some it shows the perfect result, or sometimes produces wrong results. There are a few advantages and disadvantages that we will discuss in the following table.
| Advantages | Disadvantages |
|---|---|
| It is easy to use and read | Sometime it produces wrong signals that caused to lose our assets |
| We can determine the trend continuation, trend reversal, buy/sell signals and divergence from this indicator. | It is not suitable for the short-term trading because lot of signals produced due to natural volatility and the noise in price action |
| Most of time It show the right result, because it calculates current value based on short time. | The OBV is not performed well in those cases where the assets whose volatility and volume is low |
| Repaint is not performed by OBV indicator | If we want to do trading with OBV, then we need to consider long trading history for doing trading analyses |

In Conclusion, the OBV is a very good technical analyses indicator that helps the traders to figure out the possible entry and exit points. The OBV indicator is very easy to read. It is a momentum-based indicator that is working on the volume injected into the market. Traders use this indicator to predict the possible buying and selling entries.
Traders use this indicator to determine the current market trends whether the trend is bullish or bearish. When volume increased and price also increased, it means that the buyers enter the market. On contrary, when indicator volume decreased and prices move down, it means that the sellers enter the market.
As always, the OBV indicator is also not showing hundred percent results. It is not advisable to use this indicator alone, because a lot of contradictions are found in the price action and OBV results. So, we should use one or more indicators with OBV.
Thank You!

crypto quantum leap
World's famous Crypto Video course
Join now and be successful crypto trader
https://www.cryptocrash.club/2021/12/crypto-quantum-leap-review-2022.html
First Mover Asia: Bitcoin Falls Below $49K as Trading Volume Weakens, Altcoins See Red
https://www.cryptocrash.club/2021/12/first-mover-asia-bitcoin-falls-below.html
Market Wrap: US Inflation at 39-Year High Fails to Buoy Bitcoin
https://www.cryptocrash.club/2021/12/market-wrap-us-inflation-at-39-year.html
Downvoting a post can decrease pending rewards and make it less visible. Common reasons:
Submit