 source
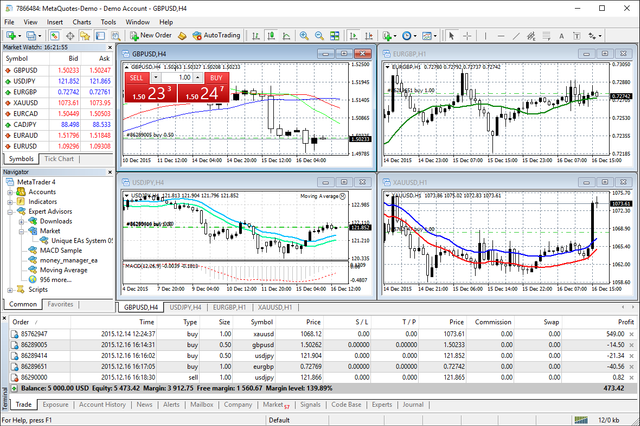
1a) Explain the Japanese candlestick chart? (Original screenshot required).
b) In your own words, explain why the Japanese Candlestick chart is the most used in the financial market.
c) Describe a bullish and bearish candle. Also, explain its anatomy. (Original screenshot required)

Explain the Japanese candlestick chart? (Original screenshot required)
The Japanese candlestick chart as the name shows was originated in Japan over a hundred years before the bar and point-and-figure chart was developed in the West.
 source
 Japanese candlestick chart can be used for various time frames, whether it is 15mins, 30mins, 24hours, 7days, a year? Whichever one you choose. It is used to understand the price action during the time frame you pick on the chart.
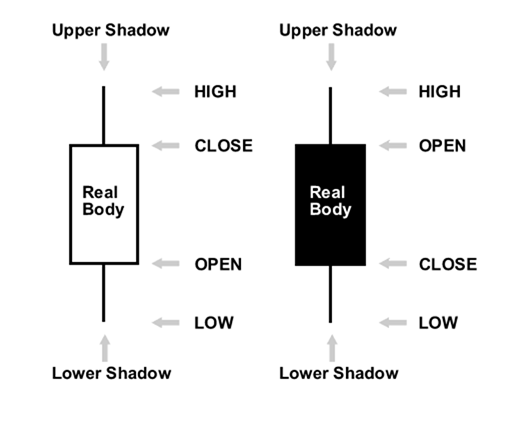
Japanese candlestick chart is useful to a trader as it shows four price points using close, low, open and high which is the time frame a trader picks.
- If the close is on top of the open, then an empty (white) candlestick is drawn.
- If the close is under the open, then a black (filled) candlestick is drawn.
- The filled or empty rectangular bar of the candlestick is known as the real body or body.
- The thin long lines shooting out below and above the real body show the low & high range called shadows.
 source
In your own words, explain why the Japanese Candlestick chart is the most used in the financial market.
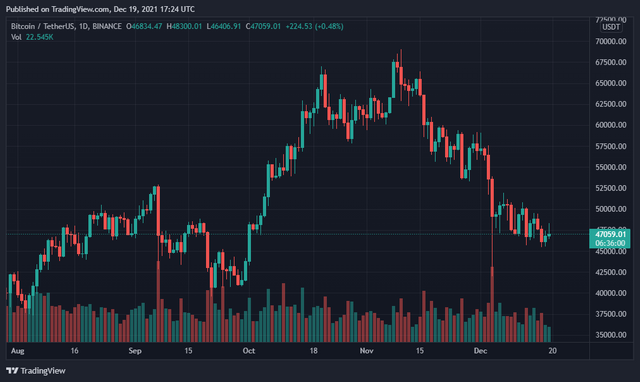
Japanese candlestick charts are seen as one of the most important tools used by majority traders in the financial world, it is the most popular method for technical traders to easily analyze price action. They provide much more information in the charts than traditional line charts, it shows a market's lowest point, highest point, closing price and opening price at a glance.
 source
 As well as using the Japanese candlestick charts to keep track of previous price movements, technical traders use them to look for clues about the direction the market is headed to next. How they do this is by searching for recognizable patterns that often lead to reversals or continuations.
Traders in the financial market find the Japanese candlestick charts quite useful and flexible because of the way price action can be examined over any given timeframe, can be from one second up to a complete year.

Describe a bullish and bearish candle. Also, explain its anatomy. (Original screenshot required)
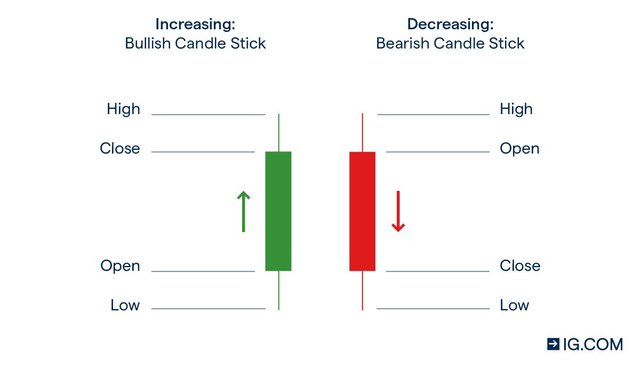
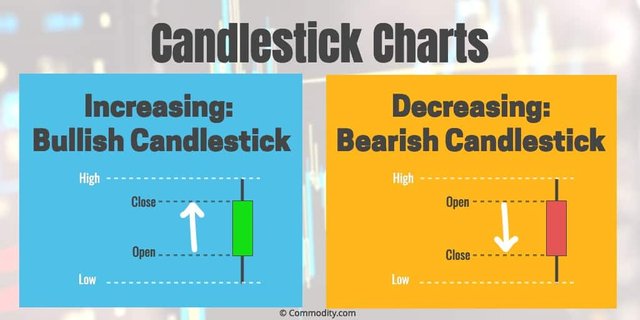
Candlesticks are shaped or formed in a chart by the up and down movements in the price. These price movements sometimes form patterns that traders use for trading or analysis purposes. Candlestick patterns are divided or separated into bullish and bearish. A bullish pattern appears when the price of an asset is rising or likely to rise, while a bearish pattern appears when the price is dropping or likely to drop. Also have it in mind that no pattern is accurate all the time, as these patterns only represent tendencies in price action. Nothing is ever guaranteed in the financial market.
 source
 Bullish candle: A bullish candle appears at the end of a downtrend. It is made up of two candles, the first candles have relatively short shadows (wicks) and a small real body. And then, on the other hand, the second candle has longer shadows (wicks) and a body that engulfs the real body of the first candle.
The second candle always overwhelms the first candle completely. For a candle to be termed as bullish, the high of the second candle must go higher in price than the high of the first candle. The same rule is applied for low.
The top of the body (closing price) should be higher than the highest price of the shadow of the first candle as well. This situation gives a bit more relevance to the second candle and it shows that the bulls are controlling the price action at that moment.
Bearish candle: The bearish candle pattern follows the same principles as that of bullish, the only difference bearish has is that it is a reversal pattern that forms at the top of an uptrend. The first candle is usually a bullish candle that signals an uptrend continuation in a chart, before the occurrence of a massive bearish candle that totally shuts down the first candle.
 source